Neo4j blog
Welcome, GraphAware
Neo4j is acquiring GraphAware, our longtime partner and a leading provider of intelligence analysis software for government agencies.
5 min read


Featured voices


Most recent
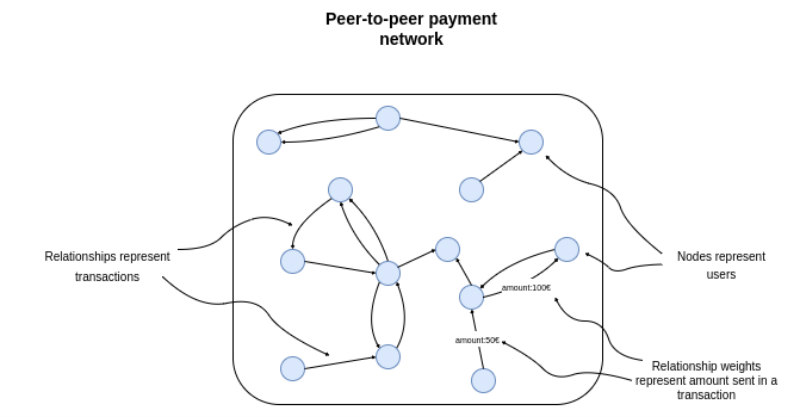
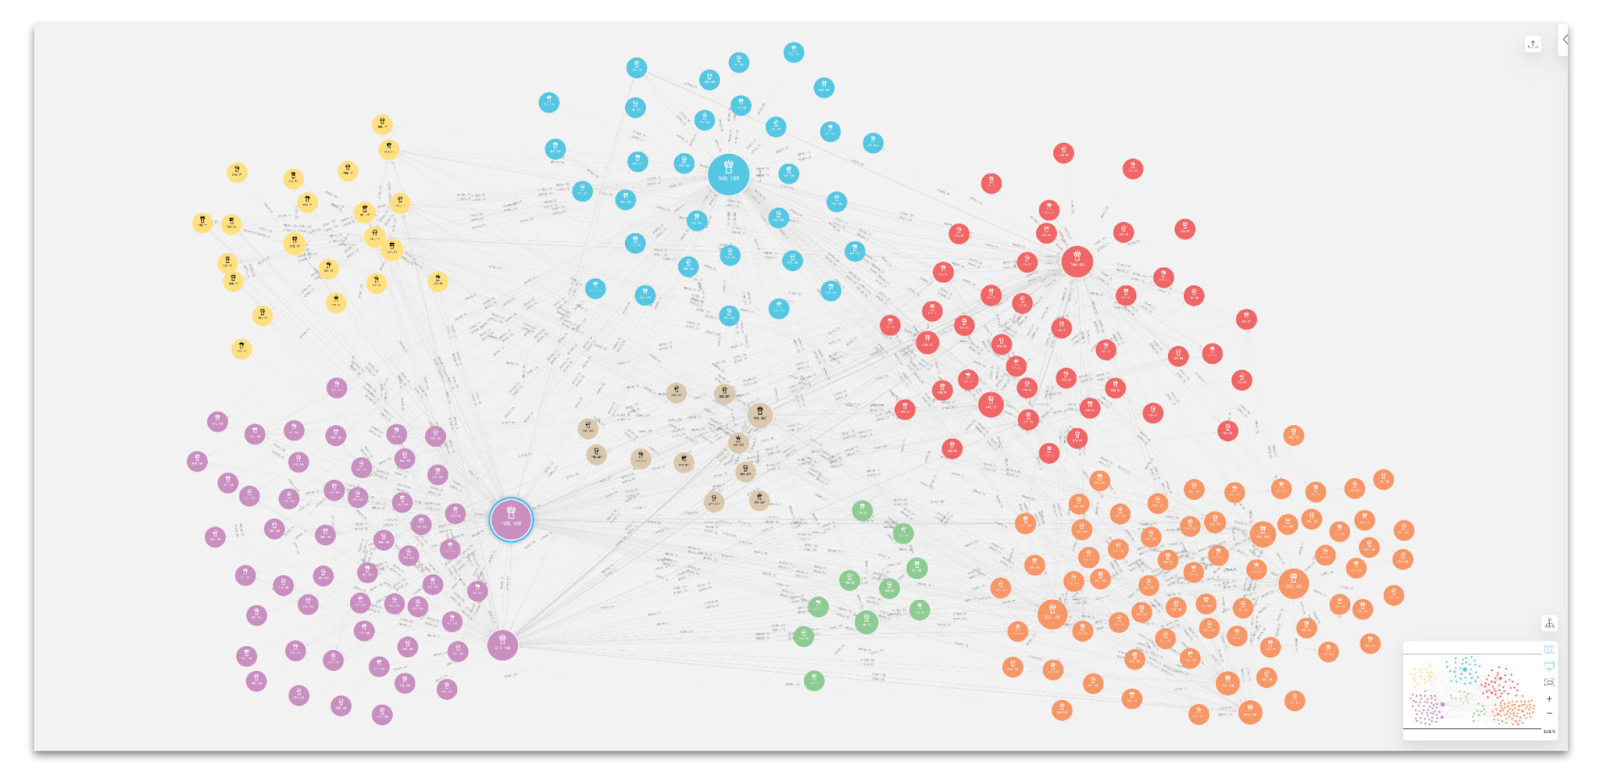
User segmentation based on node roles in the peer-to-peer payment network
16 min read
Data lineage: Using knowledge graphs for deeper insights into your data pipelines
8 min read
Neo4j in the news – summer edition: cryptocurrency, digital twin, fraud detection, and Graph Data Science
4 min read


Graph Data Science for supply chains – Part 2: Creating informative metrics and analyzing performance in Python
13 min read

Graph that saves lives: Connecting research papers to clinical trials to saving human lives
6 min read