Neo4j Blog
Introducing AI-Powered Dashboard Creation in the Aura Console
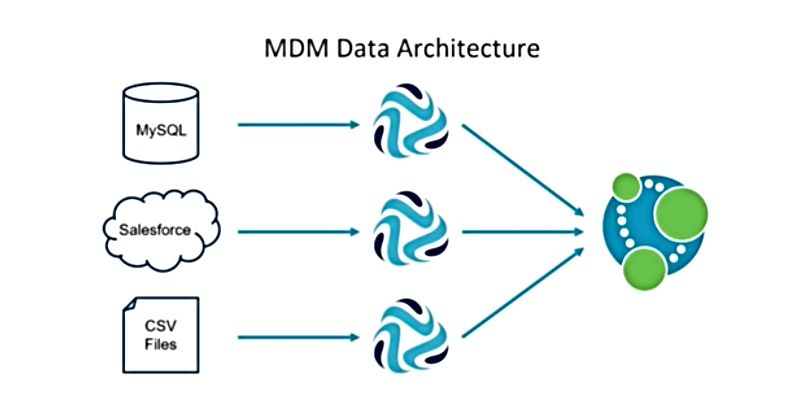
We’re excited to announce a significant step forward for Neo4j AuraDB users: Dashboards, a powerful new tool in the Aura console.
6 min read


Everything a Developer Needs to Know About the Model Context Protocol (MCP)
25 min read
How to Improve Multi-Hop Reasoning With Knowledge Graphs and LLMs
9 min readFeatured Voices


Most Recent
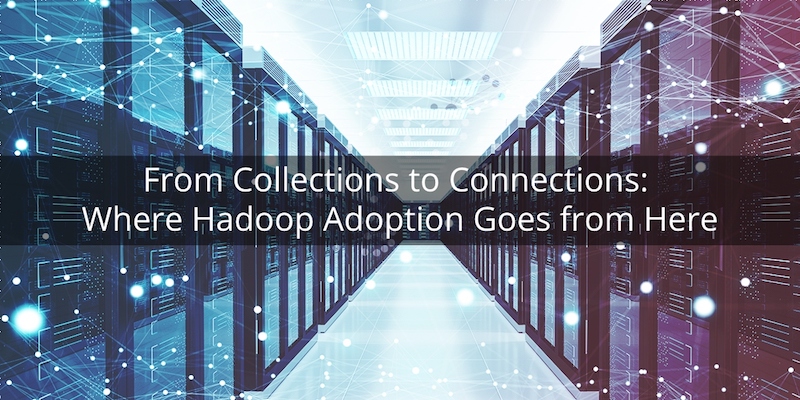
From Collections to Connections: Where Hadoop Adoption Goes from Here
5 min read
The Present and Future of Artificial Intelligence and Machine Learning
20 min read


Graphs and RegTech: 5-Minute Interview with Julian Schibberges
3 min read