Telia Zone: Scaling Neo4j to millions of homes with Kubernetes


18 min read

Editor’s Note: This presentation was given by Rickard Damm and Lars Ericsson at GraphConnect Europe in May 2017.
Presentation summary
Telia Zone is the Telia company’s router, which is used in approximately one million homes in Sweden. Telia uses Neo4j with Kubernetes to connect to all of these homes, and hosts causal clusters with Kubernetes to graph all the different actions that take place in and through the routers.
Telia has now moved to expand the use cases possible with the router and is using the graph to determine how many possible use cases there are so the company continues to build out capabilities for the router beyond basic connection to the Internet.
Some of these additional use cases could include connecting Sonos speakers to Spotify for multiple users within a home and texting parents when their children arrive home. All of these actions create instances that are tracked within the graph database to ensure things like not overloading servers and identifying which users are in certain zones the same time. These use cases are enabled by Telia’s APIs.
On the router side, more than 1.5 billion requests per day can take place. With causal clustering with Neo4j, Telia is doing a phased rollout rather than pushing this to all homes at once.
Full presentation: Scaling Neo4j to millions of homes with Kubernetes
Rickard Damm: The following is how Telia’s Telia Zone router is integrated with Neo4j, with Kubernetes to scale to the million-plus homes in Sweden that use Telia. I’m the head of the product for Telia Zone.
About Telia
Telia is the leading incumbent carrier in the Nordic market. We are in the telecom space and are a quad player, meaning we have both mobile networks and the fixed network with the enterprise and the consumer’s place. One of the areas where there’s been the least innovation on our side of the business is the broadband side.
On the broadband side, everybody genuinely understands what it does: it’s router, it does Wi-Fi, so it terminates your Wi-Fi signal to your fiber.
In Sweden, we have a lot of fiber, but we also have ADSL. We have roughly one million of these distributed in Sweden, so this blog is focused specifically around Sweden, however we’ll be deploying the Telia Zone also outside of the Swedish market.
So, we have a million of these. I saw them as an underutilized asset. We have a really great customer relationship when it comes to TV service, so roughly 60 or 70 percent of our users also subscribe to our TV service. That’s one way to interact. But hardly anyone has been innovating and doing things with the router in many, many years. We started thinking about is and decided to try and see what capabilities are there.
Expanding Telia Zone’s use cases
Roughly half of our install base subscribers are age 55 or older. If we want to make something smart for the home – smart phone home platform, which the Telia Zone is – we have to abstract quite a few levels above Neo4j. It has to be a bit more simple.
We unpacked our router and thought, “What is inside of here? Could we add something? Yes, I think we can.” So, we are adding stuff to your router. We are going to do two things for you: We are going to help you simplify your life, and we are going to help you entertain yourself together with the others in your home. Those are our two core value propositions.
How do we do that? Well, we do that by introducing services or building services, allowing other companies to build services for you based on a context. We are adding the context of the home – when you enter the home, when you leave the home, etc.
We packaged it as the Telia Zone and are deploying it to everybody in Sweden who has a Telia router. It’s neither opt in nor opt out. This is something that is going to be rolled out to everybody – roughly one million homes. The idea here is that we want people to be so proud of being a Telia subscriber that they put a sticker on their mailbox: “This is a Telia Zone home.”
Instead of explaining this as a technology – because at the end of the day, it’s a new technology that we have introduced – let’s look at it in terms of the use cases.
Essentially, your broadband connection is getting a new life. And your connected home – the Telia Zone – is the centerpiece of your connected home. But we are not trying to scare away users by trying to push a connected home platform onto them. Instead, we are inviting them to just start experimenting with our service.
For instance, you can receive a message when the kids come home – this is a really good feature. Without an app running, without anything running on the phone, you can get an SMS when the kids come home. I have three kids, and this is a magical feature.
How about the lights turning on when you come home? How about the music changing when you get home? Or when you leave the home, and you forgot to lock the door, how about we give you a message there and remind you that you forgot to lock the door? Those are things the Telia Zone does.
We built a playlist generator together with Spotify (Coplay is the app). This is the Sonos moment, the 9:00 p.m. Sonos moment where – if you have a Sonos system and you have a party with 10 people – the Sonos phone playlist goes around the table, and people start changing songs to their favorite.
How about if we generate that playlist automatically based on who is connected to the Wi-Fi? Coplay generates a playlist in Spotify, which dynamically removes you if you leave the house. If you come back, it adds your songs again. That’s what it does.
One last thing to note about customer experimentation: We also made an IFTTT (If This Then That) channel. Many of you likely know what IFTTT is. For the 55-years-plus consumer, most people don’t know what IFTTT is, but we’re trying to introduce this a little bit as a way to experiment with your connected home.

The Telia Zone is something that lives inside our partners, so we don’t have a Telia Zone app. We don’t have our own experience. Instead, we are integrating inside partner experiences.
One solution we have out there, is Glue Lock, which is a smart lock that turns the knob on the lock, so to speak, retrofit. This solution works with reminders. We also have a smart home, like the Nest thermostat, which is running for geothermal heating and a few others. We have curated them to see and calibrate what the customers are interested in.
Now we’re arriving at why we use a graph database. We actually don’t know yet what the killer use cases are for the Telia Zone. We realized that we probably have to build it as a much more open platform than a closed platform.
So we have an API today. The API is found on premiumzone.com. This is the English-speaking website where you can, as a developer, go in and look at our APIs. We have four APIs.

Working with Telia Zone’s APIs
So what you can do with our APIs?
We’re telling our developer communities that they see when somebody comes and leaves the home. So, there’s a registered device that’s comes into or leaves the zone. WebHooks is an app for that, where it allows the user to identify devices as clients within the zone, and then you can get all the other clients that are in the zone.
Those are the basic APIs. They may not sound like much if you are not building apps, but we have about 150 developers in our system today.
The last thing is that you can authenticate clients in a zone.
So the last one, Spotify, is super interesting. In this use case, Spotify is run by the mother of the family, and it’s the children sharing the account with their parents. And perhaps there are battles over this one account. What happens when the kid starts playing? You get a message on your phone that somebody is playing on the same account.
If you are using the Telia Zone home account or authentication, you’re able to start proposing things to users that you could never do before. You can see the MAC address, the registered devices, and may automatically generate new accounts for your users and then later on start filling in the required information.
In the background, using our API, you then get access to unique identifiers for every single device that is connected to this service and generates an account for those automatically, and then populate that information afterwards.
How and why we built on Neo4j
Lars Ericsson: Let’s get into the technology on how this actually works.
So first, just a small rundown on how the infrastructure is built up and how we are hosting Neo. Then we’ll go back into how we are scaling Neo4j and what we use Neo4j for.
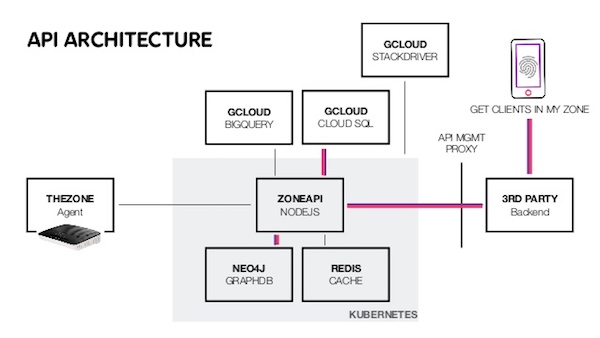
Basically, we run everything on Google Cloud Platform. We’ve created a micro-service architecture out of Node.js apps. We’re using the Neo driver for Node and we’re hosting a causal cluster within Kubernetes. We also have some other services.
This is a simplified version of our architecture.
It is really easy for us to scale within Kubernetes, and it is also really easy for us to upgrade. I actually upgraded to a Neo4j 3.2 just before we went up on stage, in development at least.
So if we have a user connecting, what is actually happening in the back inside?
Well you, of course, connect to the router. The router sends a message to our backend, to our Node applications, where we then distribute the data out to our storage solutions. What you see in the graphic above is that we are actually running more storage solutions than Neo4j. They each have different use cases.
We’re using Cloud SQL to hold a state of all our routers out there. And then, we’re building the graph database on what’s actually important to us, and what’s important to our applications to make good decisions.
What happens after we push that into our storage solutions is that we also notify you, as a third party, with a WebHook saying, “This client of yours actually has connected to this zone.” (Router is the same thing as a zone in our topology, at least for now).
So what happens then? What if you want to ask what clients are in a specific zone? Which of my users are in this specific zone? As a third party, you make the request to our API. We go to Cloud SQL to fetch the current state of that zone, but then we go down to Neo4j.
What we want to deliver back to you is who the users are. Not only the MAC addresses that we use internally in our system; we want to deliver something more valuable back to you. So we want to deliver the actual usernames, tokens or some identifier for your users. We store all of that information in Neo4j.
Before we actually know that one of these users is a specific user in your system, first you need to register that user with us. This is where we really need the hardware to do this, because how we identify users is first by the MAC address and then make an API request from within a zone.
That request goes through the router, and then we look at your IP address and know what MAC address it is.
Before you have done this last step, we won’t actually expose any devices to you – this is a super important privacy feature, of course, for all devices out there. You need to activate a device first and have something activating that device before we will provide information back to you.
So scaling this, Sweden is a pretty small country, but it’s still a lot of routers. What we have seen so far is that each Wi-Fi device generates around 100 connects or disconnects, changing the state on your Wi-Fi 100 times a day. That is 100 requests per day, per device. In each home we have seen so far, on average, you have around 11 Wi-Fi connected devices. So this adds up to around 1,100 requests per day. Still not a lot of a load, but as we scale this to up to over a million routers, it starts to add up.
All of this also requires ride operations, and that is why we are moving over to causal clustering.
This only accounts for the traffic that actually sends the update up to our system. The bigger load that we actually need to build for is what all the third parties are interested in. So just on the router side, over 1.5 billion requests per day.
We really like Kubernetes and we really like Neo4j. Neo4j’s causal clustering is working out really well for us.
As we scale this, we are doing a rollout where we’re not pushing this to all homes at once. And anyone hosting can adapt to how many users you have. We don’t want to spike out our servers to handle all the requests that might come. We want to have servers that handle the requests that are coming in.
What is Kubernetes and how does it work with Neo4j?
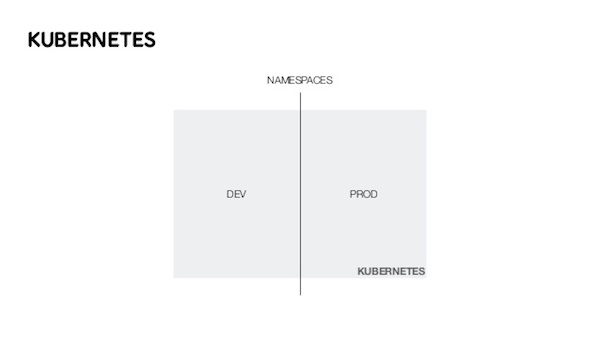
For those who don’t know about Kubernetes, it’s open source software that comes from Google that basically lets you create a cluster to run Docker containers in. Kubernetes does a lot, and it fits really well with Neo4j.
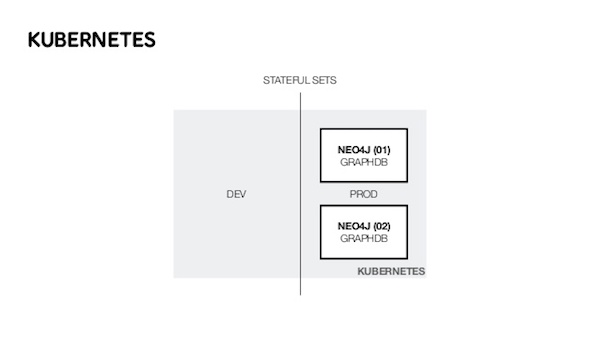
We can divide clusters into development and production. But how does that fit with Neo4j?
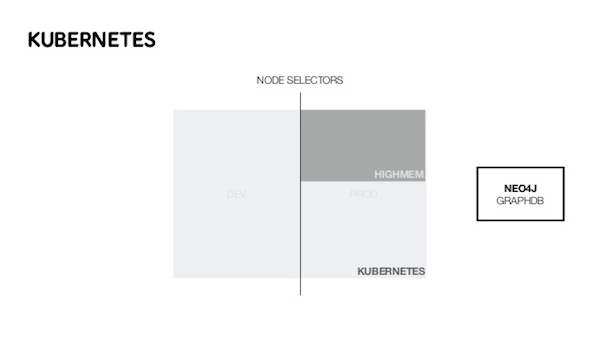
Well, we do node selection. We have servers in our clusters, and they are not all the same. We need specific servers or specific hardware where we want to run Neo4j. And within Kubernetes, we target specific servers that we want to run Neo4j on.
Why is that important?
Well, since we do this dynamically, we want to be able to make sure that all future instances of Neo4j also end up on these type of nodes, not only the ones that we’ve actually manually installed or something.
Another feature that works really well for us, together with causal clustering, is StatefulSets. What StatefulSets in Kubernetes does is guarantee a certain order where you start your nodes. As we want to scale up, we guarantee that some nodes are already there, and some instances of Neo4j are already there, before we start scaling. We just set up the initial cluster and are then able to scale directly.
Autoscaling is super important for us as well. As the load increases, we scale up to more replicas of Neo4j. What happens is, at one point or another, you grow out of your cluster. The resources in the cluster aren’t enough anymore. So then, we actually also autoscale servers.
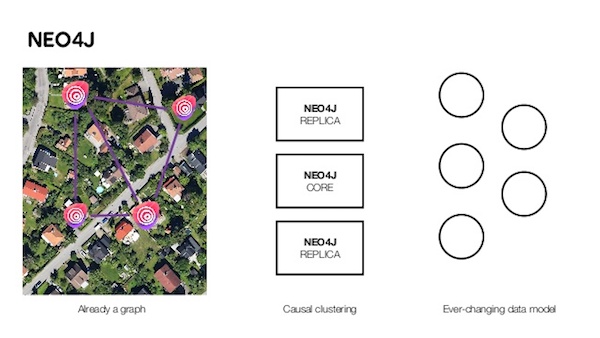
So why are we using Neo4j for this?
Well, it’s actually already a graph. And also, the scalability is super important to us. Being able to scale horizontally without actually knowing what the load might be tomorrow is super important to us. We have a data model that is constantly changing.
How Telia Zone works with the Neo4j graph
So just a quick look at the graph database.
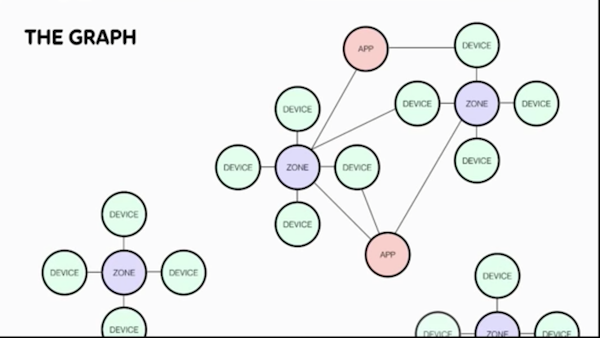
Everything centers around the zone. And to the zone, we tie relationships with devices. The devices at your home will have a strong connection to the zone at your home. Then you run apps in that zone, so apps get a relationship.
Say you run Spotify at home or you let Spotify run for anyone in your home. Well then, Spotify gets a relationship to both your device and your zone. Of course, we have different zones and other zones also run that same app. Devices might even go between zones.
Maybe you go visit a friend, you get a relationship to that zone as well, and that’s how we build up that graph.
Also, we have multiple apps. Apps are related to other devices, and the graph keeps on growing.
What do we need this for then?
We want to be able to ask questions like, “What other devices are running this app?” Or, “What kind of relation did this device have to this other zone?” Or, maybe we even want to look at predictions.
Doing business intelligence on this, looking at when you’re most likely to adopt a new application for something is super valuable data to us, and this is why we use Neo4j.
Looking ahead
Rickard Damm: To wrap up, I would like to peek a little bit into the future.
The Telia Zone is a consumer offering. Per definition, we’re a consumer brand, first and foremost, as Telia is in Sweden. From the consumer offering side, we want to expand and try to find new services that are very relevant. (That’s one part of the predictions.) The other part is that we’re also expanding this into externalizing the intelligence that we gather as a B2B offering. That is the next thing that is going to happen down the road.
This is just one graph of a subset of households where we have connect and disconnect events – so people leaving, people coming. People are very predictable. We’ve seen that just with a very simple prediction algorithm, that we can quite accurately predict when people are, for instance, coming or leaving or at home.
To give a glimpse into a little bit of a simple use case from this could be – taking one example of a food delivery app. Here is a home shopping app for food. So you just select your things there, and then you get a suggested date to when you can get this delivered.
Say I have a bag here that’s to be delivered for 500 crowns, like €50, next Monday. That’s usually what the user experiences look like on these apps. With the premium zone technology or the Telia Zone brand, we can enrich this quite a lot to become super granular and increase the customer value proposition even more.
In this case, we would have a suggestion for a delivery time. It says Monday at 5:30 in the afternoon,could propose that to the delivery company or the payment company. We don’t have to give them the entire graph. We don’t have to give them the entire data set. We just suggest one time when we believe that this person will be at home. It’s, of course, on the user – the user has to consent.
When showing this to companies, like the postal services and to other delivery services, they go absolutely wild about these ideas. Because they have had these things before. It’s still on the customer terms, you still have to accept, but the accuracy will be very much increased and also the customer satisfaction is going to be this delightful surprising experience.
We can also deliver very interesting insights. For instance, we made a run on what was the Christmas present of the year. We had a few thousand zones rolled out over Christmas, so I asked the team, “Which new devices were activated after 3 o’clock?”
So, 3 o’clock is usually when people start opening their presents in Sweden. We made a cross analysis to the vendors of those MAC addresses, and we saw that, for instance, iPhone was 68.8 percent of all the new devices. So you can do super interesting analysis on the data set that we generate. That is totally unique and nobody has thought about in our business before.
The underlying technology is found in all the descriptions of the APIs, and this current form is found under the premiumzone brands, so we have premiumzone.com. We’re positioning this as the technology, and we are expanding outside of our footprint sooner than later, for sure. We have inbound requests from quite a few other operators, as well. I would love for this to become some sort of standard.
Share Article


Explore
Related Articles

Top 10 graph database use cases (with real-world case studies)
How to graph an ERP system in 3 easy steps

Graphs for information services: The 5-minute interview with Cyndi Streun
Top 10 use cases: Empowering network and IT operations management