Why you should start thinking about your organization as a graph

Senior Consultant at GraphAware
7 min read
Do you think there is no space for a graph database in your company? Or it would be a huge effort to integrate a graph database into your product?
I have to tell you: You can use a graph database like Neo4j without touching your product, and you can use it for managing your company’s knowledge as well as to improve your software development process. So, even if your business problem is not inherently graphy (hard to believe in 2018), there are a few reasons why you should think about your environment as a graph.
Without knowing your core business, I am pretty sure that your most important connected dataset is your organization. If you’re in the IT sector, you are already connected and your most important company values are already encoded into graphs.
We have learned that graphs are eating the world, and in this blog we’ll show you why they have already eaten your entire software development process and why you should start using graph databases (if you have not started yet).
Software architecture and moving to microservices
Let’s start with your architecture. I am certain that, if you are up and running with your business for more than a few years, you have experienced the typical hype cycle inside your organization every season. You are on your way somewhere from monoliths to serverless, and there are philosophical debates about what could be better in your system.
It is possible that you’re working on loosely coupled microservices, which often have dependencies (by which I mean both development and deployment dependencies) so complex even your architect and service owners need a proper tool to identify and analyze them.
Even if you are doing microservices very well, there will always be a person from your company who will describe your software architecture as a dependency hell, or a distributed monolith.
Anyhow, you cannot override Conway’s Law; your architecture will always be a copy of your organization structure. This is always a complex network/graph, except if you do a one-man show or an under-funded startup with your college besties.

So we have a complex architecture – a network of our software components – which depend on many third-party software components.
Do you remember the left-pad incident? That was the Jenga tower of JavaScript libraries two years ago. After the guy who implemented the name-conflicting Kik package removed all his packages from npm, half of the internet was broken. Thousands of builds failed around the world, thousands of JavaScript developers were crying, and no one thought that a package dependency could cause a temporary worldwide crisis. It was a sad day for the IT sector.
So lessons learned, I guess. If you develop open or closed source software, you must be aware of a few facts:
- An average of 80 percent of the applications consists of third-party components, mostly open source
- Almost 50 percent of the third-party software components of those applications are outdated, usually a few years old
To realize this, I had fun with a project last year. I loaded the Libraries.io dataset about the open source packages from the different package managers into a Neo4j instance, and I figured out that our legacy software depends on thousands of other libraries written by random people around the world. You should have the visibility and the control over your software product dependencies to have the proper business continuity. This is a perfect use case for a graph database.
The challenge: The chaos of delivery dependencies
If you are aware of your architectural and third-party software dependencies, and you are ready to ship your own software, then you have the challenge to handle your own delivery dependencies. You will realize that your project has delivery chaos, which could (and should) be tracked by a graph. Because no one will understand what should be the step-by-step deployment plan to deliver you should reduce project delivery chaos with graphs.
You likely use some issue-tracking system to support (and to frustrate) your software engineers during your development process – maybe JIRA or similar issue-tracking systems to store all your bug-tracking and project management information.
This can become a mess quickly if you do not use them properly. If you use them as expected, then you will get a lot of useful information about your progress, bugs, critical areas, etc., which provide meaningful statistics.
But your issue-tracking is not just about fixing bugs, it is also a huge, connected dataset and a graph database helps you to discover the valuable insights in the relationships of your tickets. There are hidden values that are almost impossible to discern from your issue-tracking system directly.
If you are a big enough company then every day you realize the problem-solving skills of your software engineers are documented and encoded into comments on bug tickets. There are a lot of value in the tickets and in the relationships of the tickets. Also, if someone commits a change into your code repository, then ideally the developer provides the information about the corresponding ticket as well.
Why shouldn’t you reuse this information to get a better understanding of your own software?

If you take it further, there are a lot of other places where there are more useful textual information like user comments/feedbacks on your product pages or blog posts, conversations and Q&As in developer communities or on Stack Overflow and so on. Or just look around the wild internet where your company will be judged by the public. There’s a lot of related “metrics” about your product or service.
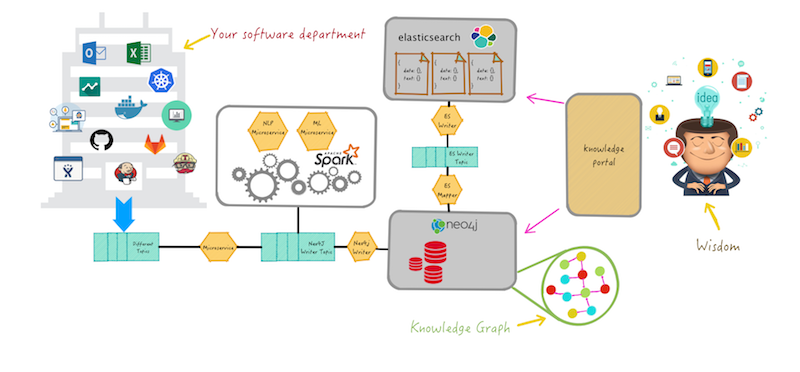
You can hoard all this information into a graph database and you are already halfway there. If you already have some content in Neo4j, then typically the first use case is to make the data searchable and deliver relevant search results to users.
From there, you will be in the positive feedback loop of always improving the search results to satisfy information needs of your users. This is the same if your users are your software developers. They have to find the relevant documents, they have to find the relationships between the documentations and the bug-reports, or the gaps between the requirements and the implemented code. There are a lot of complex queries that can help serve them.
The solution: A knowledge graph
Nowadays, it is not enough to provide relevant results, you have to provide meaningful knowledge to allow users to use the information effectively.
Your company has already accumulated more than a hundred years of knowledge, and it keeps growing. You should re-use this knowledge and the lessons learned to operate your company more successfully in the future. You don’t have to make the same mistakes again during your software development, you can make new mistakes. That is the way of learning, this is how the best companies do their job. So, we have arrived at knowledge graphs.
All learning organizations should maintain their knowledge graph. Previously, knowledge graphs were accessible only to dedicated learning organizations such as NASA. This is no longer the case, and every software development company should have one soon.
Knowledge graphs will become essential, just as your ticketing system is today.
I think this is the near future for the tech companies, allowing them to build and enhance a competitive advantage by using this synergy between the graph database, NLP/NLU tools and today’s machine learning algorithms.
It is clear that every organization is a graph from which you can get actionable insights. If you are interested in implementing a knowledge graph based on Neo4j and transforming your data into wisdom, then you should check out GraphAware’s new Hume platform which provides all the necessary components to utilize your corporate knowledge. Because wisdom is the ability to increase effectiveness.
Share Article


Explore
Related Articles

Neo4j Named “One to Watch” in Snowflake’s 2026 Modern Marketing Data Stack Report


1 of 3: The difference between a graph, a knowledge graph, and a context graph

2 of 3: Why graphs, knowledge graphs, and context graphs matter to customers