


The Neo4j BI Connector: How It Works

Senior Director of Developer Relations, Neo4j
2 min read
Graph data platform adoption is on the rise. But does this mean that people have to give up their favorite BI tools? The answer is a resounding no.
The Neo4j BI Connector delivers direct access to Neo4j graph data from business intelligence (BI) tools such as Tableau, Looker, TIBCO Spotfire Server and Microstrategy. It’s the first
enterprise-ready, supported product to deliver connected data results to BI users avoiding
coding, custom scripting and ungoverned access.
In this third blog of our five-part series on the BI Connector, we cover how Neo4j fits in with popular BI tools as well as introducing Neo4j Bloom, a graph-native visualization tool designed to be intuitive for all users.
Architecture & How to Approach Implementation
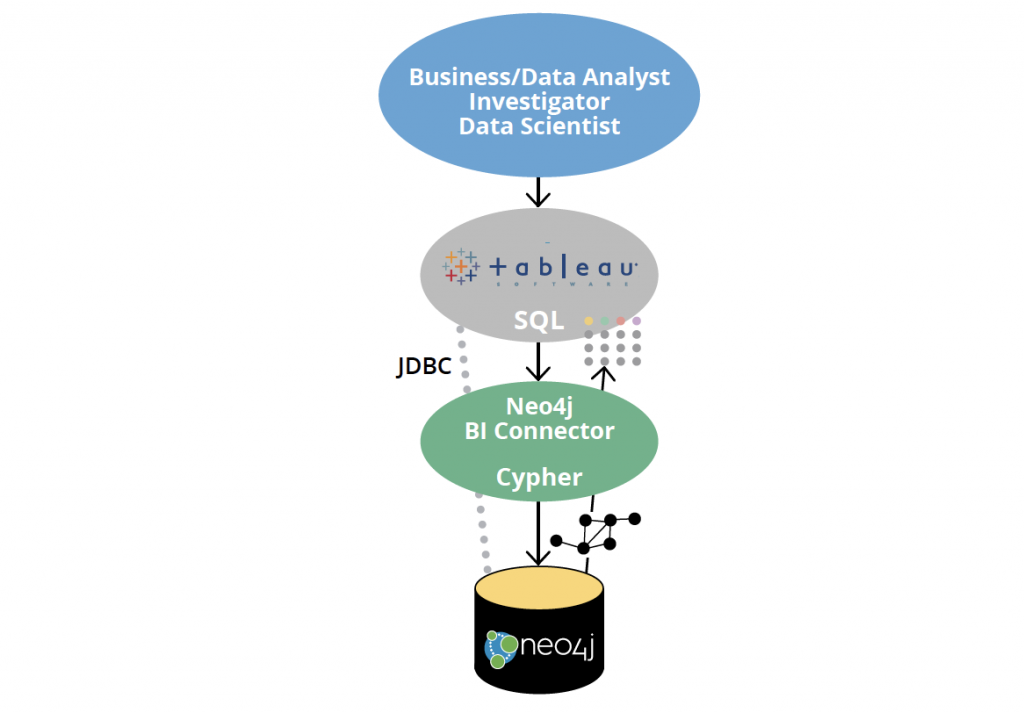
How the Neo4j BI Connector Works
Inside of the BI Connector is a regular instance of the Neo4j official Java Driver / Bolt client for
Neo4j.
When users specify a JDBC URL to connect to Neo4j, they embeda Neo4j URL that is passed
to the Driver and functions exactly as the standard supported Java Driver works. This means
that the BI Connector will transparently support the different connection schemes that Neo4j
supports.
It also means that identity separation, security, query throttling and other features, as they
pertain to the BI Connector, can be handled as any other Bolt client would be, which we
discuss more in the security section.
Graph Visualization Options
With the addition of the BI Connector to the Neo4j portfolio, customer options have
expanded. There is now a rich set of different options with complementary strengths.
In this section, we cover where to use each tool, where to avoid them and how a combination
of the available tools provides the best insight.
BI Tooling
Traditional tools such as Tableau excel at providing quick drag-and-drop style experiences for
building visualizations over tables.
Advantages
- Very accessible to business analysts all over the enterprise
- Based on SQL technology, with widespread knowledge and ability among the workforce
- Excellent at pie charts, bar charts, line graphs and standard data visualization techniques
that easily resonate with decision-makers
Disadvantages
- BI tooling cannot take advantage of “graph native” features, such as Path Finding, as
there is no way to “ask graphy questions” of data - Users will usually write extra data to their graph, representing the results of their
calculations such as Community Detection, Path Weighting and so on, so that the result
can be visualized

Neo4j Bloom
Bloom gives graph novices and experts the ability to visually investigate and explore
their graph data from different business perspectives. Its illustrative, codeless search-to visualization design makes it the ideal interface for fostering communication between peers,
managers and executives, and share the innovative work of their graph development and
analytics teams.
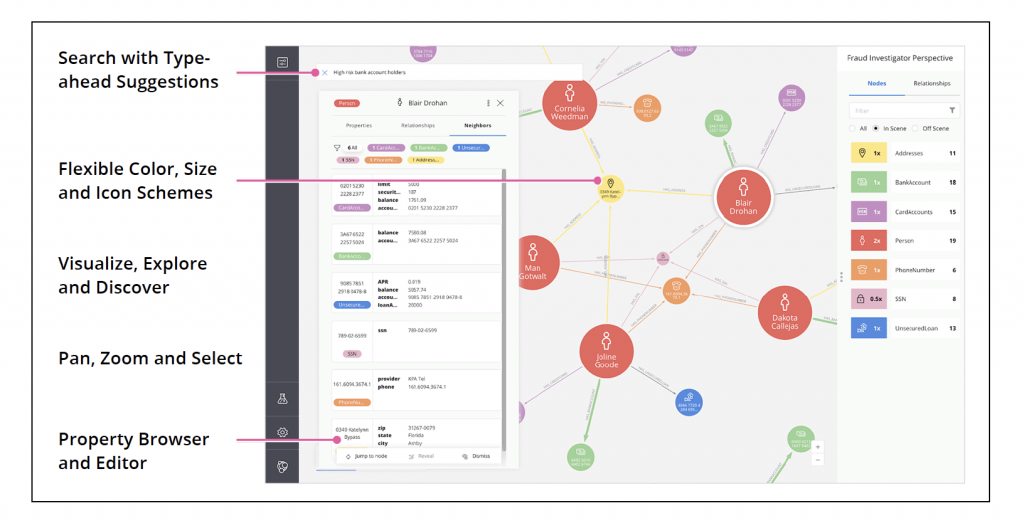
Advantages
- Very flexible and open-ended, perfect for exploratory data visualization and hypothesis
formation - Easily allows going from a topological, shaped view of a large network down to the
specifics of an individual node
Disadvantages
- Supports primarily a force-directed graph layout; support does not include more
rudimentary visualizations such as pie charts, bar charts, etc.
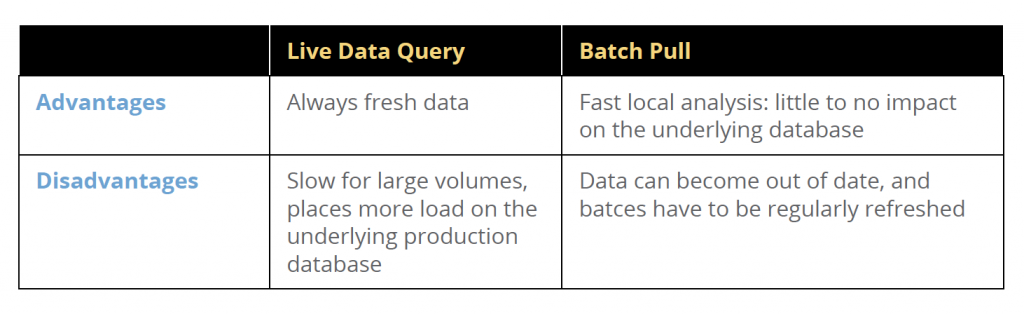
Batch vs. Live Pull
Most BI tooling has the option to “live pull” the data as needed, or to do so in batch, storing
the results in a temporary database local to the BI tool. Careful consideration should be given
to these options, depending on the size of the database and the frequency of query.
The two options represent a straightforward tradeoff. Live pulling data means the results are
always fresh and up to date, but it may incur expensive repeated queries to the database,
putting extra load on the system and performing more slowly if the result set is large.
On the other hand, batch operations allow you to pull the data once and store it locally. This
usually results in faster local analysis, at the cost that the data is not always fresh and up to
date; the batch must be periodically updated for the most recent results.
As a general rule, the bigger the dataset from Neo4j, the more appropriate that a batch pull
operation will be over live data query. In the absolute largest scenarios, to avoid load on
operational systems, enterprises typically opt for a data warehouse approach that completely
offloads all real-time query from transactional systems (like Neo4j) to a centralized data warehouse.
ODBC
As of this writing, the Neo4j BI Connector was a JDBC-only connector. This means the tooling it
supports out of the box is limited to those tools that can make JDBC connections to other data
sources, which unfortunately excludes some popular BI suites such as PowerBI.
Third party ODBC-to-JDBC bridges are available, such as the one from Progress Software.
In this scenario, a JDBC data source such as the BI Connector can be wrapped in an ODBC
interface, to allow ODBC tooling to connect. While this introduces another software layer, it’s
presently the main option if you need to connect to software requiring ODBC.
An ODBC version of the Neo4j BI Connector is planned at a later date, and is part of the
development roadmap.
Conclusion
As more people work with connected data stored in graph data platforms, demand increases for slicing and dicing that data in familiar BI tools. The BI Connector bridges the gap between the tools people love and the query language those tools use (SQL) and the growing universe of data stored in graph databases like Neo4j.
Next week, in blog four of our five-part series on the BI Connector, we will cover the important topic of data security and how the Neo4j Graph Data Platform ensures that the right people see the right data at the right time, even when using their favorite BI tools with Neo4j.
Share Article


Explore
Related Articles
Bolster Your Cybersecurity by Visualizing Attack Graphs With Neo4j & G.V()


15 Best Graph Visualization Tools for Your Neo4j Graph Database

