This week in Neo4j – Build a knowledge graph, GRANDstack podcast app, Archimate model,

Developer Relations Engineer at Neo4j
5 min read

Hello, everyone!
In this week’s episode, Jesús Barrasa shows us how to build a life sciences knowledge graph with public RDF sources on infectious diseases, viruses, chemicals, drugs, and scientific literature.
Will creates a livestream and blog post on building playlist components for the GRANDstack podcast application. Lju imports an Archimate model into Neo4j and explores the data using Cypher and the Graph Data Science library. Sarah makes the case for graph databases to analyze customer survey data.
And finally, Alex explains using Neo4j to create indirect money transfers based on user trust networks, Hack.Commit.Push announced their free and open source hackathon, and the Neo4j Community Forum has several opportunities for jobs and personal development.
Cheers,
Jennifer and the Developer Relations team
Featured community member: Jean Villedieu
This week’s featured community member is Jean Villedieu.
Jean Villedieu – This Week’s Featured Community Member
Jean is a Sales Director at Linkurious, where he helps people use graphs to fight financial crime, invent drugs, or expose criminals.
He has a lively Twitter account covering a lot of graph content and is an active member in the Graph Database – Toulouse Meetup group. Jean has made appearances on several Neo4j events and content. Most recently, he presented a session at Neo4j’s Connections event for cybersecurity explaining how graphs provide unparalleled insight to think like attackers and prevent or respond to threats. We appreciate his championing of graphs and are looking forward to his continued contributions to the Neo4j community!
Build a life sciences knowledge graph with public RDF sources
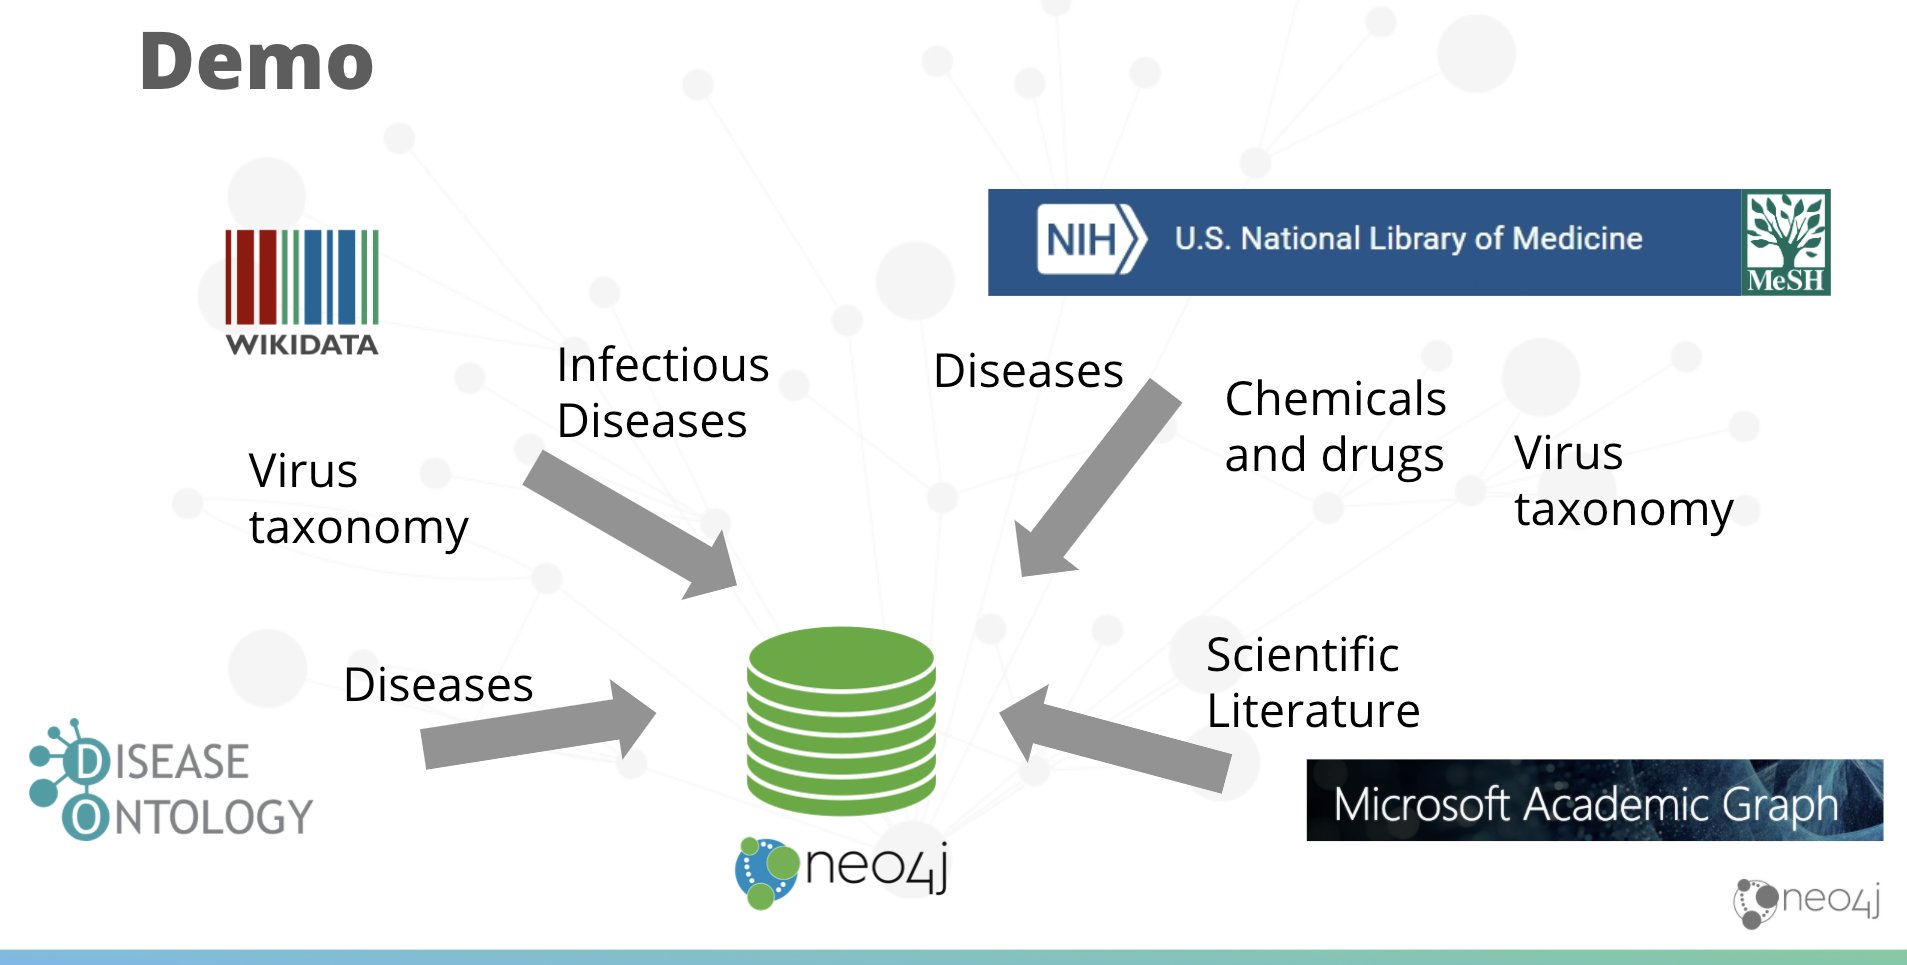
Jesús Barrasa speaks about life science data and demos importing various RDF sources into Neo4j. We get an intro into RDF data and the structure, then Jesús dives right into import to show us how it’s done. We get a live demonstration of importing infectious diseases, viruses, chemicals, and drugs with neosemantics and SPARQL. Jesús then ties the disparate sources together in Neo4j using Cypher, and runs queries real-time that navigate across the data sources in the graph!
Wrapping up, Jesús left us with some potential expansions on what we saw, including importing scientific literature to the data, running graph algorithms for deeper insights, or adding schema/ontology information. We also got some links to neosemantics for importing RDF data, as well as Jesús’s repository for this knowledge graph so that we can explore or build our own!
Adding frontend features with Next.js, Chakra UI, & Apollo Client
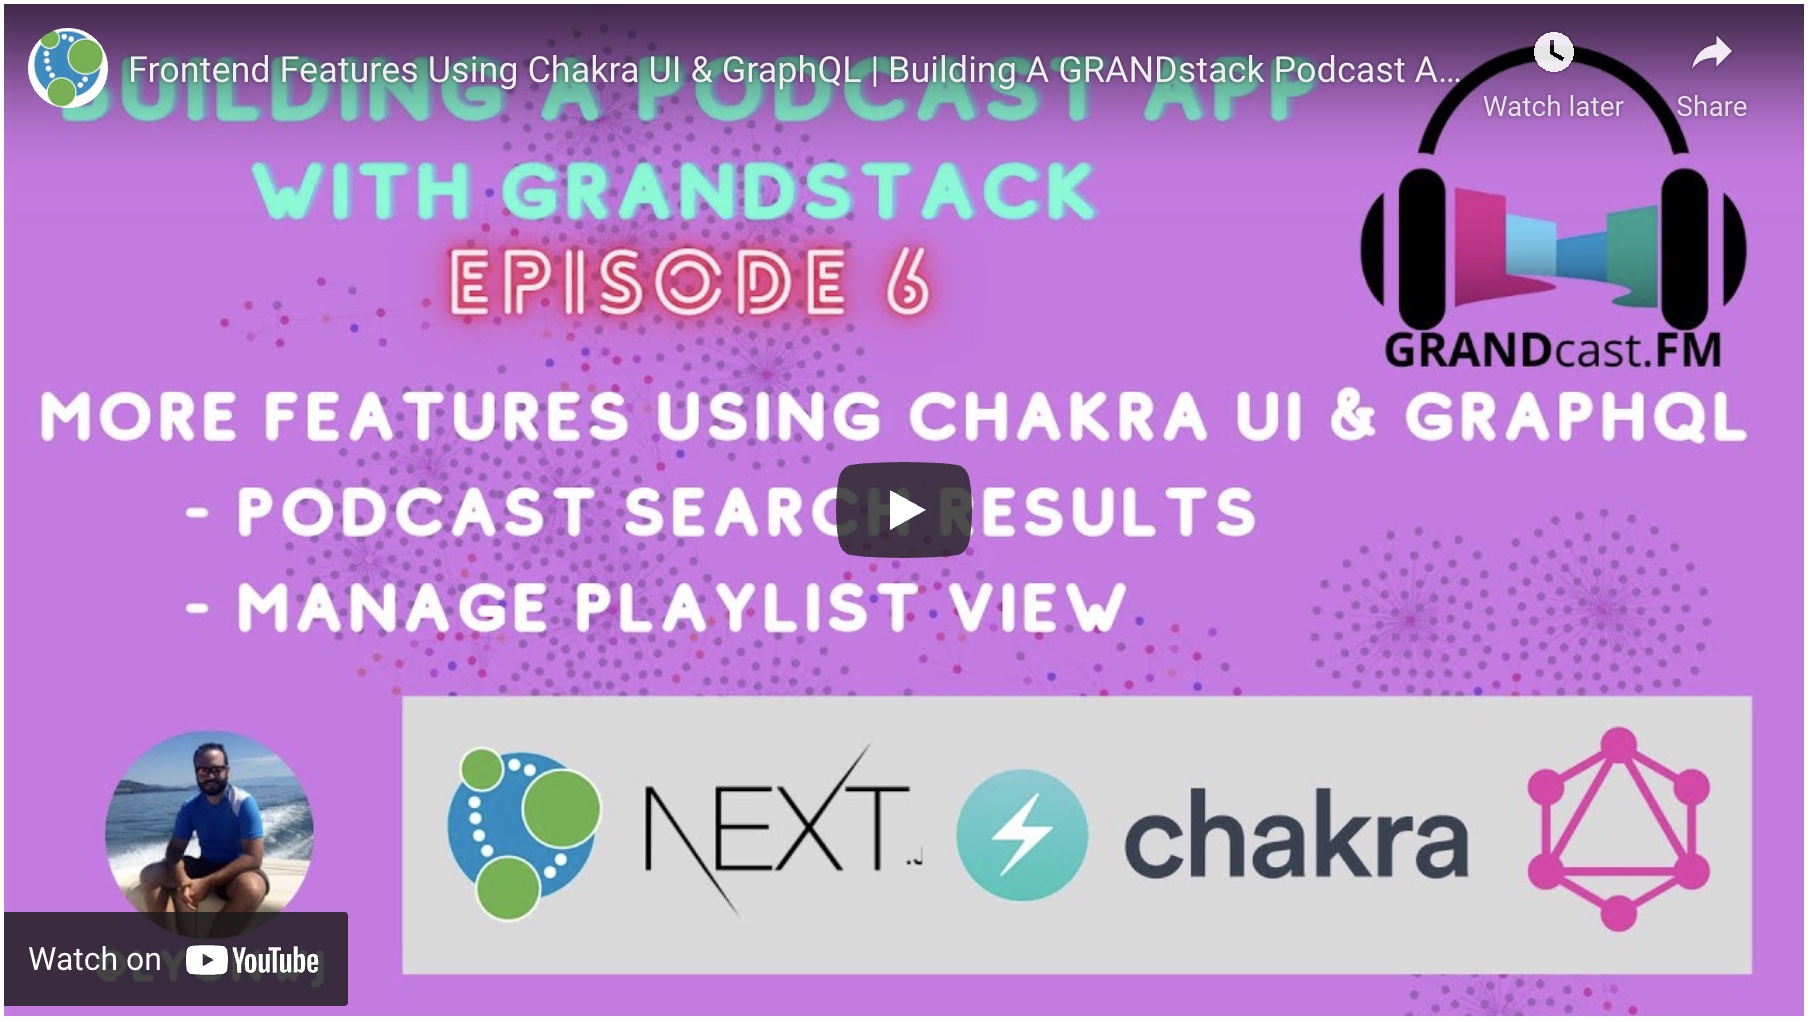
Will Lyon wrote another blog post in the GRANDstack podcast application series. The page also includes a livestream video you can watch and follow along. In the post, we see how to build the components so that users can view their playlists, see episodes in a specific playlist, and create a new playlist.
Will shows how to use a flex, popover, and vstack from the Chakra UI components, and then build GraphQL queries in order to populate the data to fill those components on the frontend. There’s even a teaser at the end for next week’s episode for building out search capabilities!
Using a graph database to explore your ArchiMate model
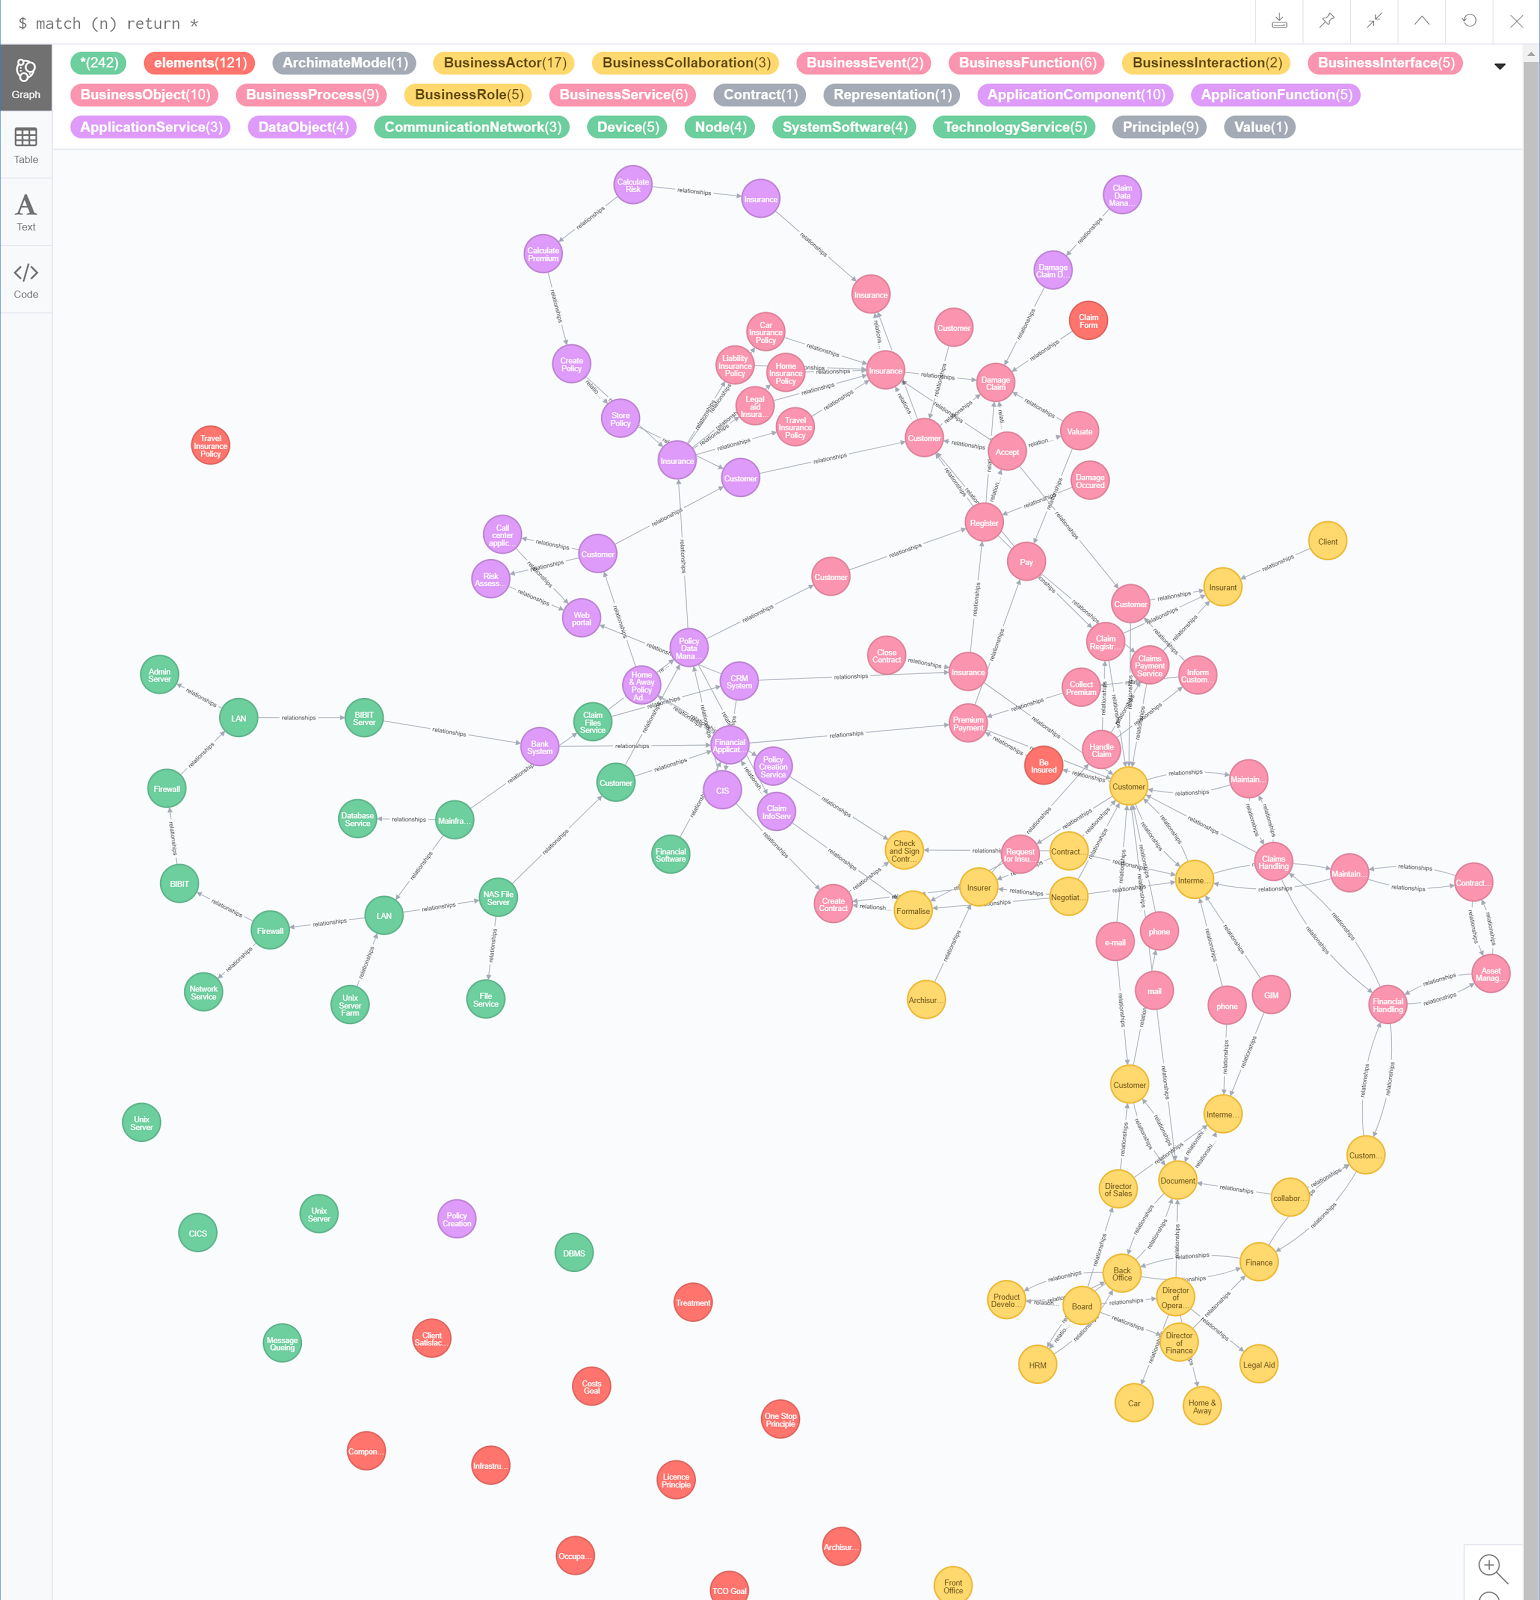
Lju Lazarevic updated her blog post on exploring enterprise architecture in Neo4j to include some analysis with graph algorithms. You can follow along with her steps using your own Neo4j instance or open a blank Neo4j Sandbox (no download)!
First, Lju walks through how to import an Archimate model using either a database plugin or Cypher queries. Then, we can tweak the data (with some caution) and see how to export it back out again. Finally, we start analyzing the data in the graph to find connections – or lack thereof – and to gain insight on network structure by using algorithms in the Graph Data Science library, like Pagerank.
Gaining insight from customer survey responses with graph databases
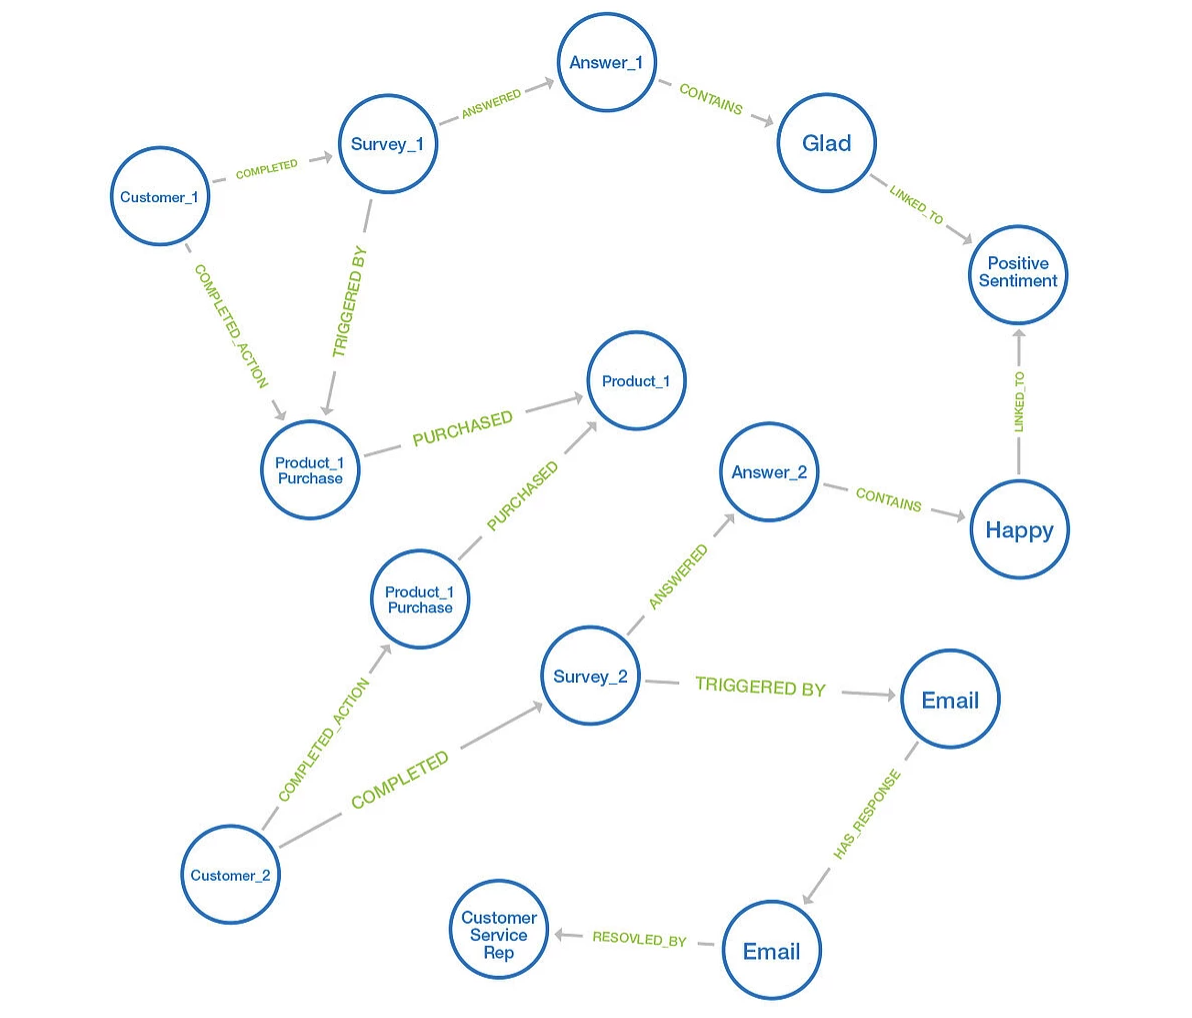
Sarah C Evans writes a blog post about the value of using graph databases to analyze survey response data. In a time of limited or no social interaction, customer experiences with virtual content, services, and products is even more vital. Yet, it is difficult for companies to find valuable data in their customer surveys.
Often, people view customer surveys as individual and siloed experiences, but Sarah shares that there are a variety of touchpoints that form the experience. A graph database helps forma a better picture of the total experience by using the collection of information bits. Sarah delves into each of the functionalities of a graph database and how those make an impact on customer survey analysis.
Visualize trust networks, Hack.Commit.Push announcement, and community forum opportunities

- Alex shows us how CirclesUBI uses Neo4j to visualize indirect trust networks between users for money transfers.
- @hackcommitpush announced the upcoming hack.commit.push event, and registrations are now open! You can join to contribute projects to the open source community.
- Looking for Opportunities? Neo4j Community Forum currently has a several available, including helping young creators from disadvantaged backgrounds, LGBT – LDS Suicide Prevention: developer to create new database system, and a permanent position: Data Scientists.
Tweet of the week
My favorite tweet this week was by Dragos:
I used @neo4j to build Archbee’s document backlinks and knowledge graph — a way to visualize which documents point to your current document & also visualize the whole knowledge graph in your team’s workspace.#knowledgegraph #neo4j #graphdatabases pic.twitter.com/ZIoZwVxMwb
— Dragos (@happydragos) March 1, 2021
Don’t forget to RT if you liked it too!
Share Article


Explore
Related Articles

This Week in Neo4j: GraphAware, Architecture, Knowledge Graph, AI Agents and more
This week in Neo4j: Community Edition, Aura Agents, Context Graph, Spring Data and more