
This Week in Neo4j – Cursed Movies, GraphKer, Hacking Hacker News, In-Memory Graphs, Power BI Integration, Graphalue

DevOps Engineer, Neo4j
4 min read

Hello, everyone, and happy Halloween!
I got my Squid Game costume yesterday and am getting ready to carve pumpkins for this year’s Halloween. Don’t forget to stock up on candy.
In this issue, we have a feature on cybersecurity and another on hacking hacker news content. Besides the “hacky” stuff, a Halloween special is brought to you by the lovely Ashleigh Faith and our data scientist advocate Clair. If you’re feeling the holiday spirit, definitely check it out.
We also get some insight on how you can combine Neo4j with Power Bi to visualize your analysis done in Neo4j. Also, another episode of bite-sized Neo4j and Graphaule is available this week.
Wishing you the best holiday spirit.
Max Andersson
Featured Community Member: Michela Ledwidge
This week’s featured community member is Michela Ledwidge.

Michela Ledwidge – This Week’s Featured Community Member
Michela Ledwidge is the co-founder of Sydney-based studio “Mod” that specializes in real-time and virtual production.
Especially known for investigating important topics like diversity and equity, the studio uses modern ways of telling stories through data and visualization like AR and VR.
For the “A Clever Label” production, Neo4j has been used as a backing database for correlating data of an investigative documentary for anti-LGBTQI interactions between Australian politicians, organizations, and lobbyists.
The entities and connections served by a Web API from Neo4j are visualized in VR using Unreal Engine and can be explored and navigated interactively.

The production was presented at SIGGRAPH 2019 and is now available as a Steam game title.
We are impressed by your creative work to make critically related information more accessible for people of all backgrounds, Michela.
If you are interested in exploring relevant (investigative) topics with this kind of technology, please check out the discussion thread on our Community Forum, and reach out to Michela.
Connect with Michela on LinkedIn
Can Graph Data Science Prove a Movie Is “Cursed”?
This Halloween episode is a step-by-step walk-through of how to make a base graph using Neosemantics in Neo4j to gather Wikidata. The mini graph that we will be creating is all about cursed movies – or at least what Hollywood deems a cursed movie. You will be challenged to take the apologetic base graph and morph it into a monopartite graph.
How to Have a Cybersecurity Graph Database on Your PC
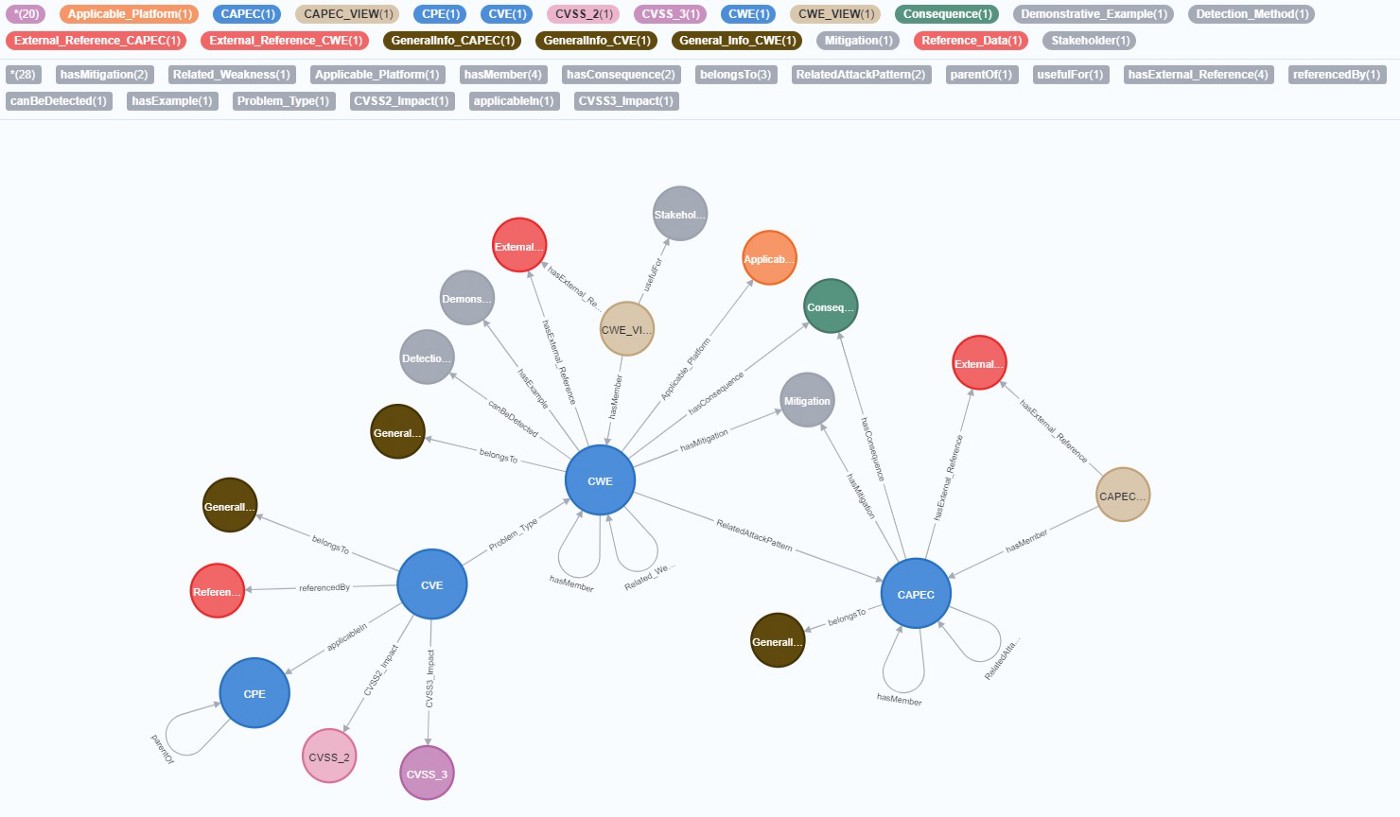
GraphKer represents every public record of CVE, CWE, CAPEC, and CPE provided by MITRE and NIST in a connected graph using Neo4j. The tool is free and open-source, providing a detailed and updated cybersecurity graph database. The most recent data feeds of CVEs and relevant CPEs – and all CWEs and CAPECs – will be re-run in about six to 15 minutes using the tool. In 2021, we have plenty of great software, hardware, and techniques to enrich our cyber defense.
Hacking Hacker News for Fun and Profit
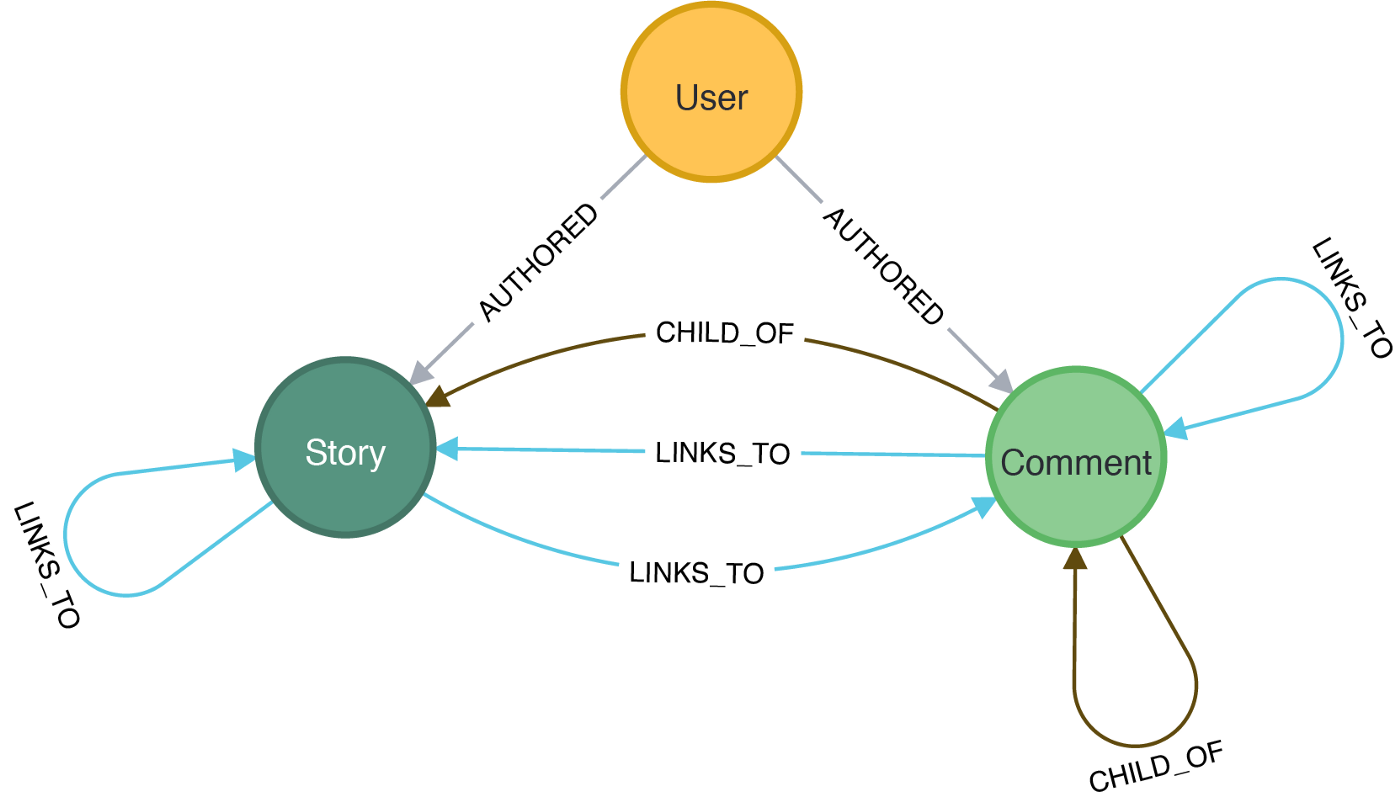
Arnica’s new research is based on the popularity of stories posted on Hacker News. Hacker News published a public API to make our job easy… to some extent. They decided to query a relatively small portion of the ~30M records and extracted 2,252,719 nodes and 4,028,273 relationships from the last six months into a graph database. The database is comprised of 110,801 users, 199,052 stories, and 1,942,866 comments. We found 13,126 links that helped us in this research. You get the biggest bang for your buck when posting stories on Tuesday and Thursday.
Construct a Biomedical Knowledge Graph with NLP
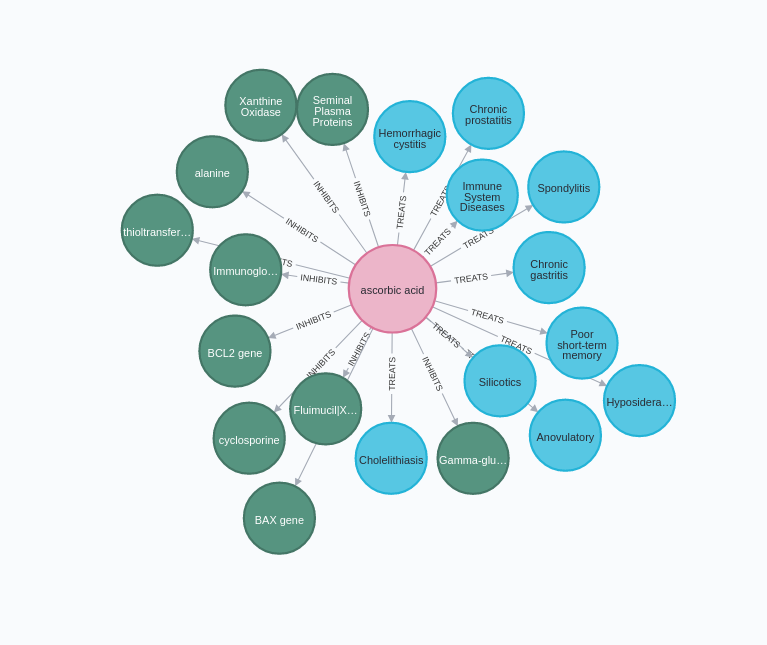
This article shows you how to construct a biomedical knowledge graph with NLP techniques. The biomedical field is a prime example where representing data as a graph makes sense. We will be using a single research paper in this blog post to walk you through all the steps required. We will use the Pytesseract library to extract text from the PDF. Each article can have one or more authors and uses NLP to extract both medical entities and their relationships.
Pattern-Driven Insight: Integrating Neo4j with Power BI

The session will show you how to use Neo4j to find hidden patterns in data and then explore those patterns and gain insights. Neo4j is designed around a simple yet powerful optimization. Each data record contains direct pointers to all the nodes that it’s connected to.
Creating In-Memory Graphs with Native Projections
Dr. Clair Sullivan is an advocate at Neo4j for data scientists. She explains how to create an in-memory generation graph with native projections. The graph data science library likes undirected graphs more than it likes directed graphs. We use a free sandbox instance and Game of Thrones to create a graph. We will talk about native projections, which can help data scientists get their work done faster. We’ll then use a different type of property to create these graphs.
Graphalue – Part 3: Building the Case for Graph Value
The “Why question” can be perceived as an intrusive, impolite, unnecessary ask. It’s super powerful, but uncomfortable. It’s a powerful technique, but it can easily be misused. We warn everyone that they will have to play along in this line of questioning to understand the value case better. The graph will have answered the question in real-time. It will enable us to follow a better process for XYZ because we will not lose as much time doing ABC.
Tweet of the Week
My favorite Tweet this week was by pokecoder:
CSS art is in the past, my coworker’s making Neo4J art ??? pic.twitter.com/m35iM7sYy1
— Ale ?✨ (@pokecoder) October 26, 2021
Don’t forget to RT if you liked it too!
Share Article


Explore
Related Articles

This Week in Neo4j: GraphRAG, GraphAcademy, Knowledge Graphs, Symfony and more

This Week in Neo4j: Certification, Developer Tools, GraphRAG, Knowledge Graphs and more

This Week in Neo4j: Certification, Graph Analytics, Agentic AI, Knowledge Graph and more


