This week in Neo4j – graphs in AI and ML, Graph Data Science Sandbox, COVID-19 analysis, GRANDstack access control, and more

Senior Product Manager
6 min read

Hi Graph Friends-
If you haven’t already heard GraphConnect 2020 in New York City has been postponed and the remainder of the GraphTour Europe events have been moved to online only. We have some great ideas for more online events going forward so stay tuned for more ways to connect with the Neo4j community from the comfort and safety of home. If you’re not a member of the Neo4j Online Meetup group now is a great time to join to take part in virtual meetups!
In the data science corner of this week’s edition of TWIN4j we have Alicia Frame’s NODES talk on using graphs in Artificial Intelligence and Machine learning, a walkthrough of the new Graph Data Science Neo4j Sandbox with Bloom and the Graph Data Science library, and a look at using the graph catalog feature of the Neo4j Graph Data Science library.
In the GRANDstack world we have a 5 (five!!) part blog series on GRANDstack access control, a blog post on using GraphQL for identity and access management and a new neo4j-graphql.js release.
We also have graph analysis of COVID-19 data, a new Visual Studio Code extension for Cypher and Neo4j, and a new Wikipedia page for the GQL graph query language.
Stay safe out there and we’ll see you next week!
Cheers,
Will and the Developer Relations team
Featured community member: Weidong Yang
Weidong Yang – This Week’s Featured Community Member
Our featured community member this week is Weidong Yang. Weidong is the founder and CEO of Kineviz. He holds a doctorate in Physics and a Masters in Computer and Information Science. After conducting theoretical and experimental research on quantum dots, he worked for 10 years as a product manager and R&D scientist in the Semiconductor industry. He has been awarded 11 US patents and contributed to 20+ peer review publications. Alongside Kineviz, Weidong co-founded Kinetech Arts, a non-profit organization that brings dancers and engineers together to explore the creative potential of new technologies in making art.
Weidong gave a talk at NODES 2019 on graph business intelligence analysis where he demonstrated how to use Neo4j along with Kineviz GraphXR.
Thanks so much Weidong for sharing your enthusiasm for graphs with the world!
NODES 2019: Graphs in AI and machine learning
In this week’s video from the NODES 2019 online conference, Alicia Frame talks about how to use graphs to improve machine learning models. Alicia covers building and querying knowledge graphs, using Cypher and graph algorithms for feature engineering, graph embeddings, and graph neural networks.
Hands-on with the Neo4j Graph Data Science Sandbox
This week we launched a new Neo4j Sandbox project for Graph Data Science.
If you’re not familiar with Neo4j Sandbox, it’s a great way to try out Neo4j in a hosted online environment with different datasets and a guided experience. The new Graph Data Science sandbox shows how to use the Neo4j Graph Data Science library to run graph algorithms such as PageRank, community detection, and node similarity. Also included is visualizing graph data with Neo4j Bloom, including results of the algorithms in the visualization. Just launch the new Neo4j Data Science sandbox to try it out.
If you’d prefer to read a blog post about using Neo4j Graph Data Science with Neo4j Bloom then this post “Hands-On With The Neo4j Graph Data Science Sandbox” will walk you through the process of starting a sandbox, running graph algorithms, and creating rule-based styles in Neo4j Bloom to style the visualization relative to the results of the graph algorithms.
Analyzing COVID-19 data in Neo4j
Understandably there’s a lot of interest around data related to the COVID-19 pandemic and the Neo4j community has been working with analyzing some of this data in Neo4j.
David Allen shared queries for importing data from Johns Hopkins into Neo4j to model COVID-19 infections throughout the world. You can combine this dataset with the Neomap Graph App to visualize infection data throughout the world in a heatmap.
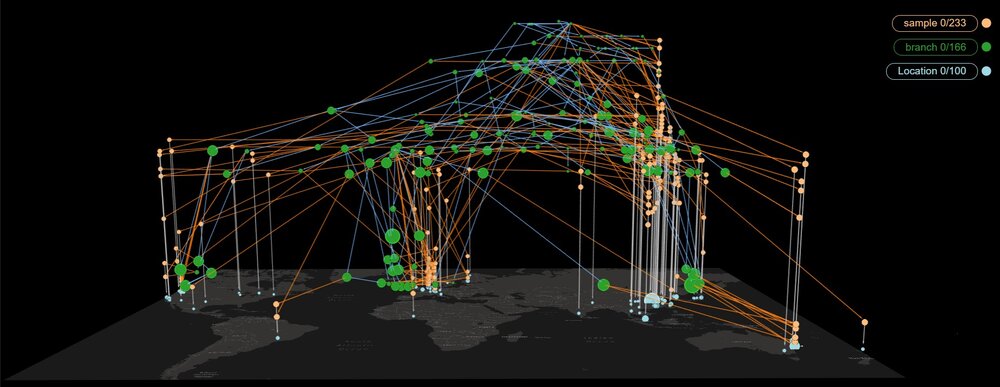
The folks at Kineviz have built an interactive graph visualization with data from Nextstrain and the Global Initiative on Sharing All Influenza Data (GISAID) that shows genetic mutations of the COVID-19 virus as it spreads across the globe.
From the Neo4j community in China is an example of using Neo4j to build a web application to find if you’ve been in a location with someone with the virus. Joshua Yu has kindly translated a blog post about this project and posted it to Neo4j Community Site.
Are you working on a project using public data with Neo4j? Please share it on the Neo4j Community Site to tell us what you’re working on.
5 quick links: VSCode extension, GQL on Wikipedia, GraphQL, Graph Data Science, and more GraphQL
- Trinity is a new Visual Studio Code extension for Cypher and Neo4j for previewing queries and database structure within Visual Studio Code.
- The GQL Graph Query Language gets a new Wikipedia page
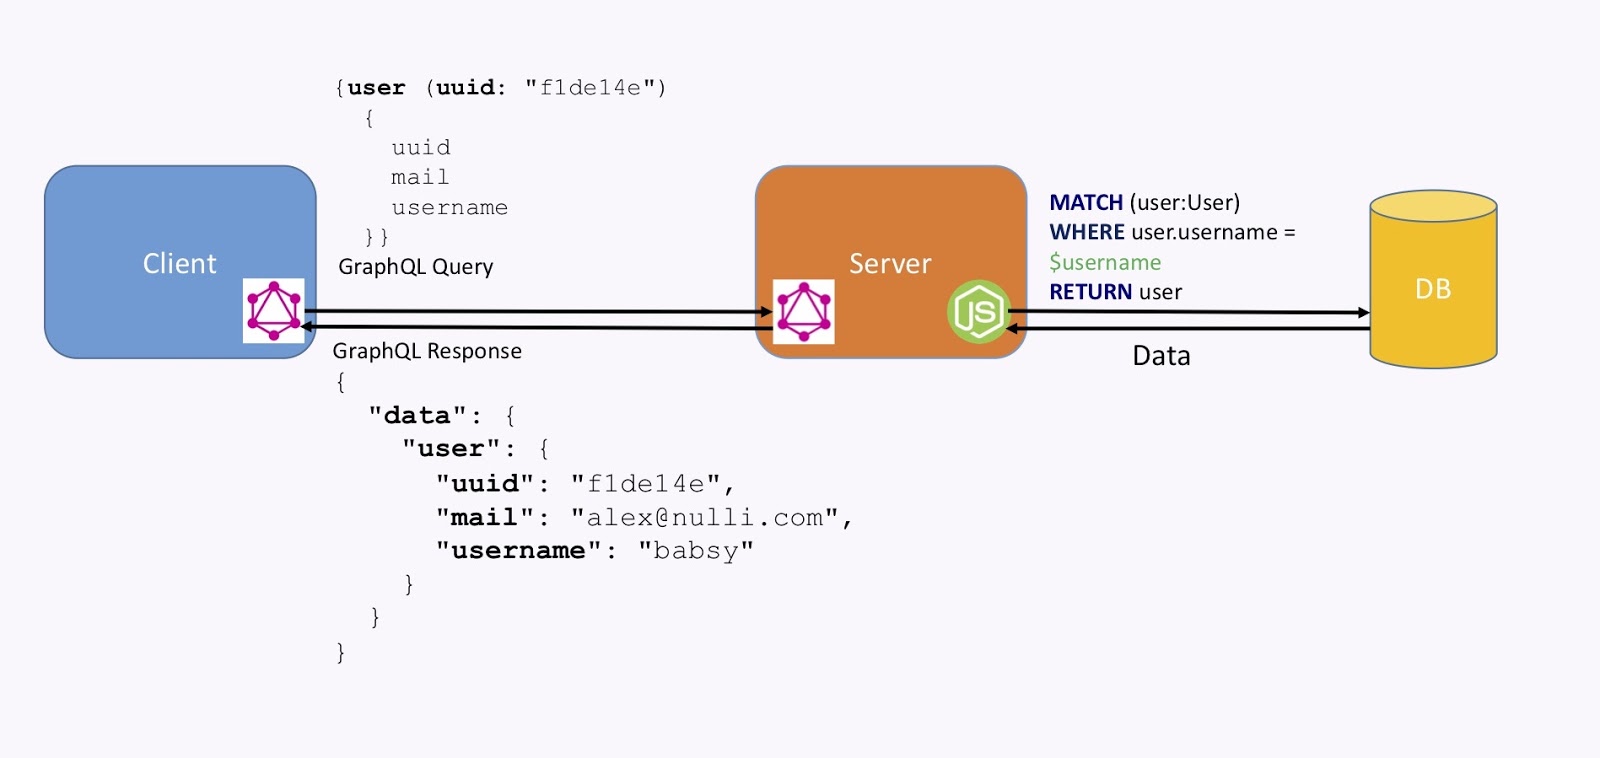
- Alex Babeanu published a blog post on using GraphQL for identity and access management
- Tomaz Bratanic wrote about using the graph catalog feature of the Neo4j Graph Data Science library.
- A new neo4j-graphql.js release with improved support for interface and union GraphQL types is now available.
GRANDstack access control
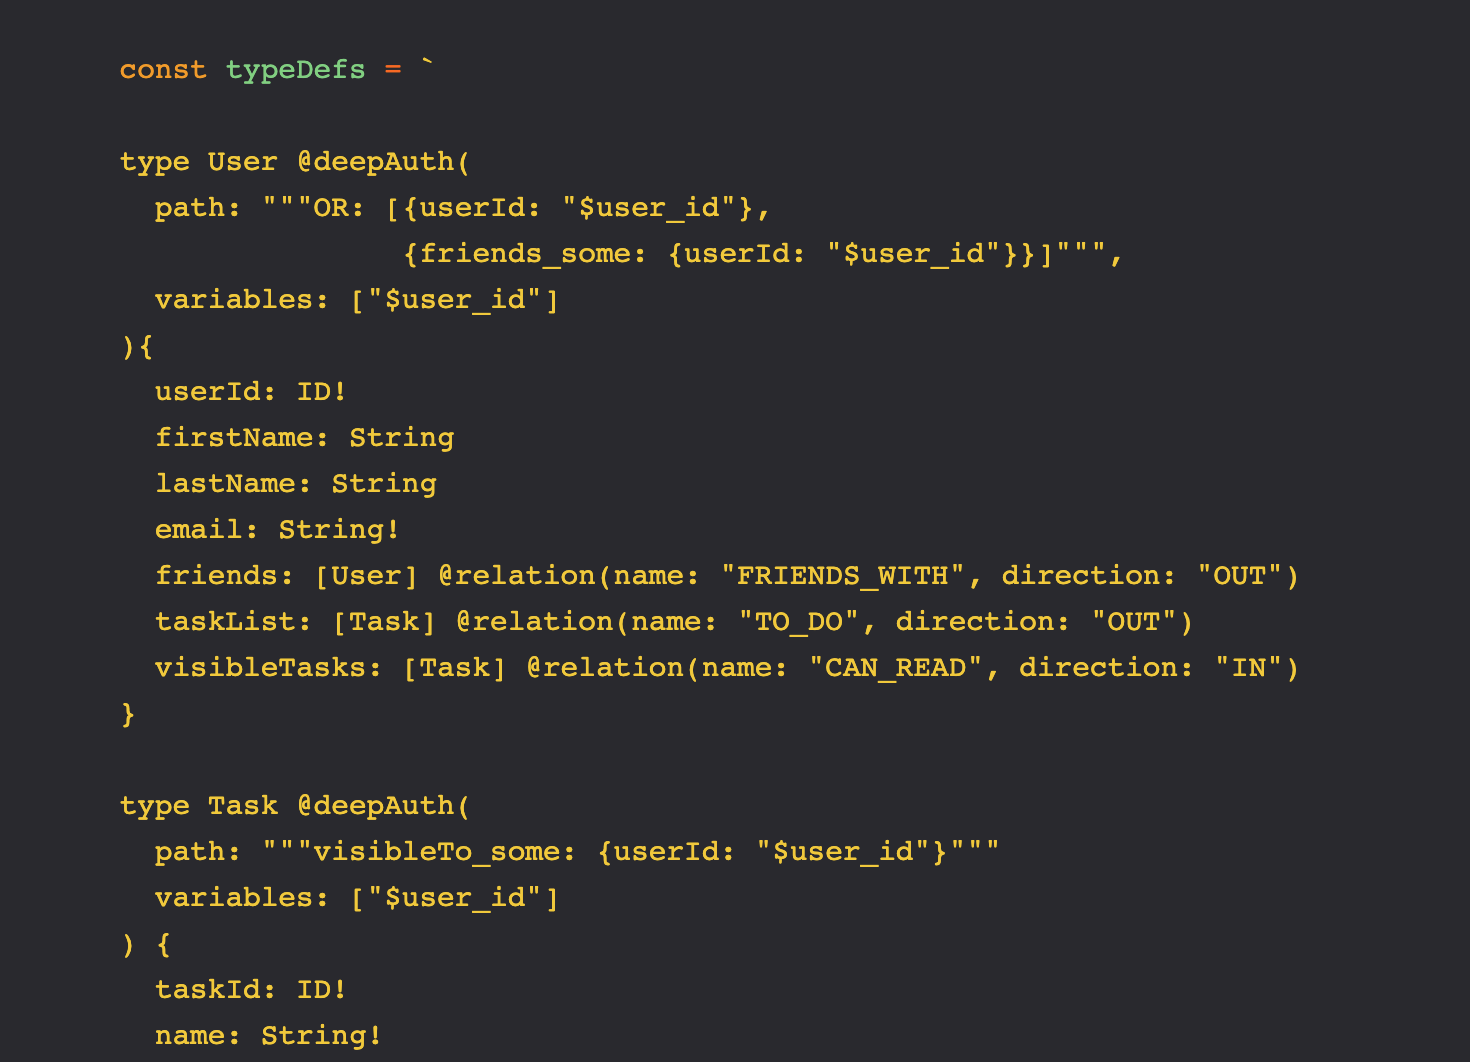
Ian Kleats published a 5 post blog series exploring access control in GraphQL APIs built with GRANDstack. He starts by building a GraphQL schema using neo4j-graphql.js then moves on to GraphQL query transformation, ultimately showing how to implement schema directives that can be used to add authorization rules that take advantage of the filtering functionality built into GRANDstack.
This is a great dive into the world of GraphQL tooling – along the way you’ll learn about ASTs, visitor functions, GraphQL schema directives, query transformation and GraphQL filter arguments.
Tweet of the week
Our tweet of the week is a reminder that there are some awesome job opportunities at Neo4j:
Looking for a fun job working with graphs and Neo4j?
Frontend / Core Database / Cloud ?
We got you covered, apply now to work with cool tech and great people!https://t.co/toHnqQRbSL
— Neo4j (@neo4j) March 12, 2020
You can head straight to the Neo4j jobs listing to learn more.
Share Article


Explore
Related Articles

This Week in Neo4j: Knowledge Graph, Life Sciences, GraphRAG, NODES, Startups and more

This Week in Neo4j: GraphAware, Architecture, Knowledge Graph, AI Agents and more