Analyzing Twitter Hashtag Impact using Neo4j, Python & JavaScript

Architect for Neo4j on IBM Power Systems
5 min read

This is the first demo I developed with Neo4j. The objective of the demo is to open the discussion about graph databases, Neo4j, big data, analytics and IBM Power Systems with our global customers.
I decided to use Twitter as a data source so that the demo leverages public data (on Twitter) and could be customized by loading the database with tweets related to a specific customer. Now, there are a lot of things you can show from the tweets, but for my first iteration of the demonstration, I decided to keep it simple and try to answer the following questions: “When people talk about topic ‘X,’ what else do they talk about?”
Translated into the language of Twitter: “For people who use hashtag #X, what other hashtag(s) do they use?”
In order to visualize the result in an interesting way, why not try to figure out the location of those people in order to plot the results on a world map, leveraging the location information Twitter provides from consenting users.
Step 1: Figuring out the Data Model
The first step was to figure out the data model: How do I represent the twitter data inside my Neo4j database? I picked the following:
Nodes:
Usernodes – represents a Twitter user (handle and number of followers)Tweetnodes – represent a tweet (text, number of likes)Hashtagnodes – represent a hashtagCountrynodes – represent a country (country name, country code)
Relationships:
TWEETEDrelationship – in between aUserand aTweet; indicates that this user is the author of the tweet; also indicates the date at which it was tweetedRETWEETEDrelationship – in between aUserand aTweet; indicates this user retweeted this tweet; also indicates the date at which it was retweetedHAS_HASHTAGrelationship – in between aTweetand aHashtagUSED_HASHTAGrelationship – in between aUserand aHashtagMENTIONEDrelationship – in between twoUsersFROMrelation – in between aUserand aCountry
Step 2: Data Import
Next, I needed to get some Twitter data inside Neo4j.
I decided to go with a Python Twitter Library: python-twitter. Coupled with the Neo4j Bolt Driver for Python I quickly was able to get my nodes and relationship in the database:
Step 3: Graph Visualization
For the visualization part, I stumbled upon a great JavaScript library: Datamaps, which makes it easy to display anything on a map.
A simple HTML page with some JavaScript, coupled with a Python backend script allowed me to quickly query the Neo4j database from the web front-end and get the data back, ready to display on the map:
The web page requires two steps from the user:
1. Input a hashtag, or select it from the top 20 hashtags already in the database.
This triggers a query to the Neo4j database which will look for all the users who used this hashtag, and then it looks at the tweets from those users, and finally the hashtags contained in those tweets. It will then sum up the number of times each hashtag has been used and then combine it with the number of followers of the users who used it and come up with the top eight hashtags.
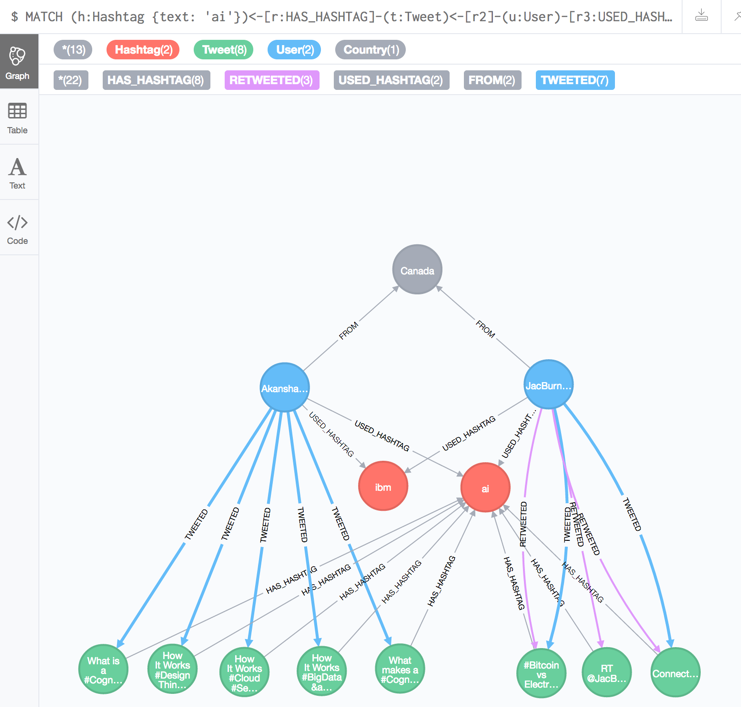
Here is what the Cypher query looks like:
MATCH (h:Hashtag)<-[r:HAS_HASHTAG]-(t:Tweet)<-[r2]-(u:User)-
      [r3:USED_HASHTAG]->(h2:Hashtag {text: $hashtag})
WHERE h <> h2
WITH sum(toInteger(u.followers)) AS number, h.text as hashtag
RETURN hashtag, number
ORDER by number DESC
LIMIT 8
2. Select one of the hashtags in the top eight that got returned by the database.
This will trigger another query to the database which will look for all users that tweeted or retweeted tweets that contain this hashtag and who also used the hashtag selected during step 1.
It will then figure out the country of those users are and aggregate the number of followers of those users per country to finally return a list of countries, and a number which represents how much “impact” this hashtag had in this country (with impact being how many potential people read the tweets).
The Cypher query looks like this:
MATCH (h:Hashtag {text: $hashtag2})<-[r:HAS_HASHTAG]-(t:Tweet)<-[r2]-
      (u:User)-[r3:USED_HASHTAG]->(h2:Hashtag {text: $hashtag})
MATCH (u)-[rf:FROM]->(c:Country)
WHERE h <> h2
WITH sum(toInteger(u.followers)) AS number, h.text AS hashtag,
     c.lat AS lat, c.lon AS lon, c.code AS country_code
RETURN country_code, lat, lon, hashtag, number
ORDER by number DESC
Once the second step is done and the Cypher query returns the data, a bit of JavaScript formats it for Datamaps to draws bubbles on the map. Each bubble is located over the country where users have been identified in the query, and the size of the bubble represents the “impact” of the hashtag selected in step 2.
What’s Next for the Twitter Demo
The demo is evolving and I plan to show it live in person at GraphConnect New York at the IBM booth.
I want to add in the possibility to select data from a given time frame, and while I store the @mentions of other users within the database the demo doesn’t yet leverage this information. I also know it would be interesting to use some machine learning algorithms to figure out more hidden patterns in the data and to find new ways to display those patterns.
I also started playing with some of the brand new Neo4j graph algorithms especially the Connected Components and Strongly Connected Components, and they both seem to work nicely with the MENTIONED relationship, so we’ll get to use that data soon.
At the start of this project, I had no experience using Neo4j as a developer. I was surprised how easy it was to connect to Neo4j and interact with the Neo4j database.
I expected I would spend most of the time trying to figure out how to connect, run queries and then read the results. It turned out to be one of the easiest part in the development of that demo, probably thanks to the great documentation available.
IBM is a Gold sponsor of GraphConnect New York. Use discount code IBMCD50 to get 50% off your tickets and trainings.
Get your ticket to GraphConnect New York and we’ll see you on October 24th at Pier 36 in Manhattan!
Share Article


Explore
Related Articles