Using a hybrid technique to detect illicit activities in shell companies

Certified Fraud Examiner and Certified Anti-Money Laundering Specialist
4 min read

Editor’s note: This presentation was given by Milind Tiwari at NODES 2021.
Shell companies are entities with low or no physical presence and economic values, used for legal purposes, such as reverse merger, to facilitate in foreign operations, or even to hold real estate properties. However, the ease of incorporation, disposability, and anonymity makes them an important vehicle for carrying out illicit activities.
Illegal arms dealers, drug cartels, corrupt politicians, terrorists and cyber-criminals have become some of the frequent users of shell companies for money laundering, sanction evasion, bribery, corruption, and even financing the acts of terrorism. For instance, a firm called Anglo-Leasing Incorporation laundered 24 million euros just for updating passports in Kenya. This study aims to develop a model for detecting illicit activities in shell companies using graph analytics in Neo4j.
My hypothesis, while undertaking my research, was that these entities can be identified if you have analyzed entities which have already been accused or identified in money laundering cases. And my geographical location, for conducting this research, was the United Kingdom.
Methodology
The UK was one of the first countries in the world to come up with a public register of ownership for companies. However, it was identified to be involved with incorporation of shell companies, which were used for laundering 80 billion pounds between 2010 to 2014, whereby a lot of entities, with owners from the former Soviet Union, were used to launder funds from Russia to the UK. So there was a dichotomy between the theoretical standards and the observable activity, which made it a very interesting choice to carry out my research work.
For this research, I was helped by Transparency International UK who provided me with a list of 800 shell companies, which were identified in different cases of corruption. These entities were used for a lot of illicit activities, but laundering of funds was the central theme.
Amongst these 800 companies, I chose to consider the limited company type because there was a lot of information available related to them. The information about these entities was collected from OpenRefine, a privately held corporate database. Other information was extended using sources such as EveryPolitician, Open Sanctions, and UK Companies House (a UK corporate registry, which was used to extend information about the appointment of directors in the companies).
Using graph database and Graph Data Science for my research
Given that my background is not in data science, this was something new to me. I got started with graphs in 2020, and it was something really challenging, but what helped me was one of the reports by the International Consortium of Investigative Journalists (ICIJ) that showcased the use of Neo4j. That’s where I was inspired to use Neo4j for my research.
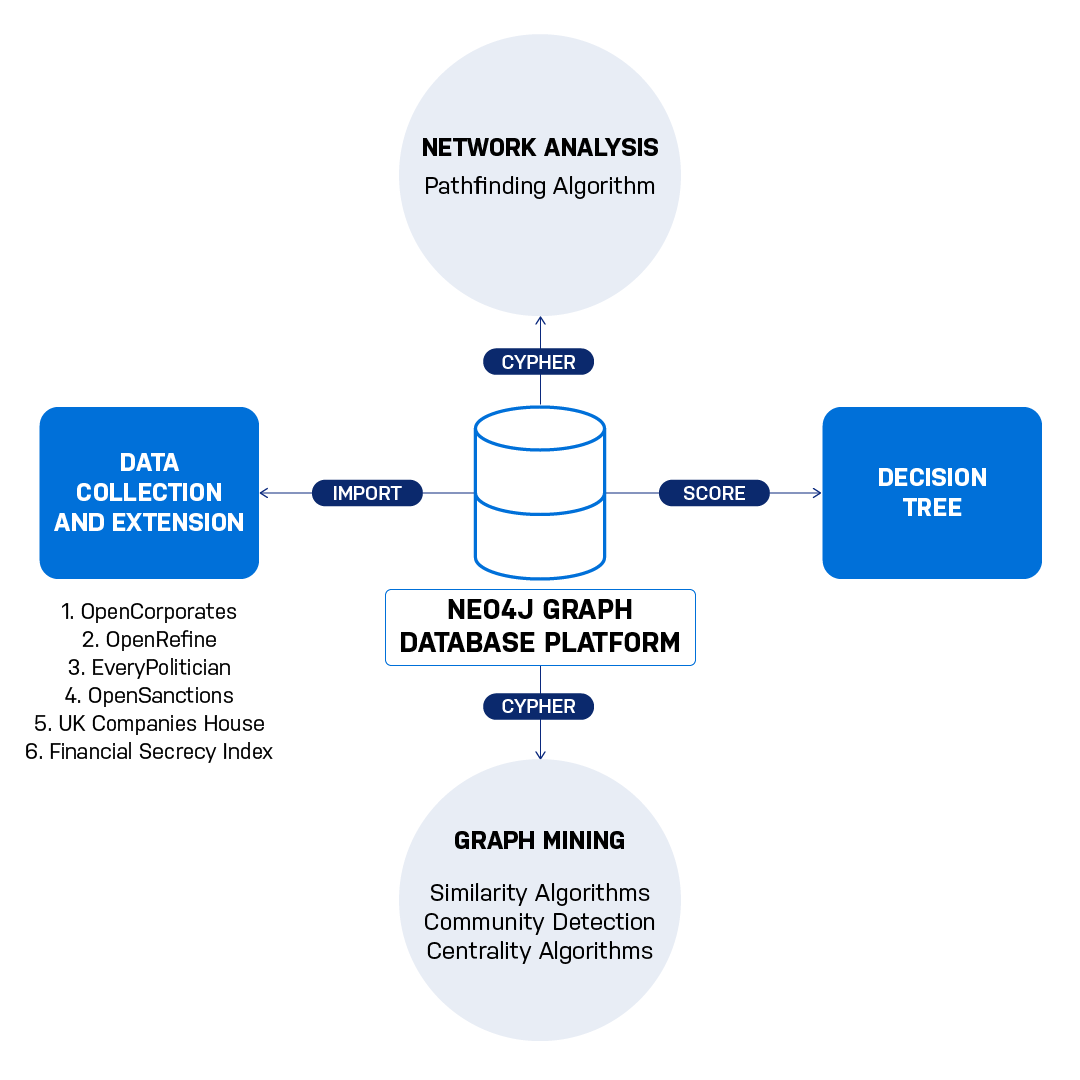
I imported the information that I had collected into the Neo4j graph database. The graph topology or the database schema that I adopted for my particular research looked like this.
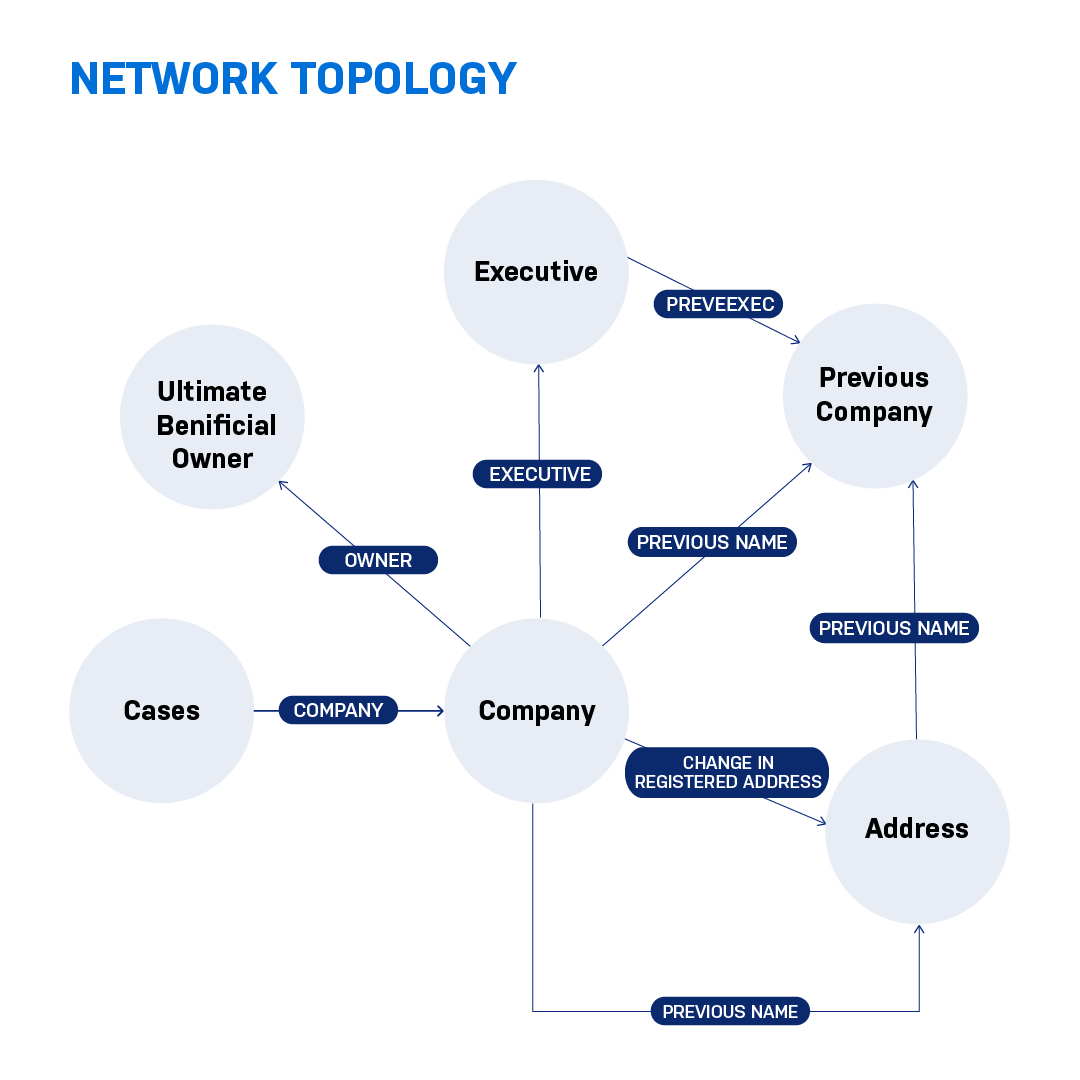
The cases for which the companies were identified with the root node and the companies were linked. Each company has executives, registered addresses, as well as previous addresses. As part of the properties, I also incorporated additional information about nationality of directors, their tenure of operation, and so forth.
Once the data was in Neo4j, I ran some search queries and got some valuable insights. I found that there was an individual who was found to have an executive appointment in 139 entities at the same time, which is a huge red flag.
I was quite intrigued to investigate more. And I found that out of my entire dataset, only 51 companies had an official owner and the rest did not have any owners associated with them. It showed the gap that was there between the theoretical standards and the observable activity, at least in the UK.
Moving forward, I ran a pathfinding algorithm, just to check how the companies are related to each other, which was really insightful.

Upon using the data science and graph algorithm app on the Neo4j platform called Euler, I ran a combination of graph algorithms related to similarity, community detection, and centrality. Since there was nothing in the literature that specified the combination of algorithms that I could use, I just tried a bunch of algorithms and came up with certain scores.
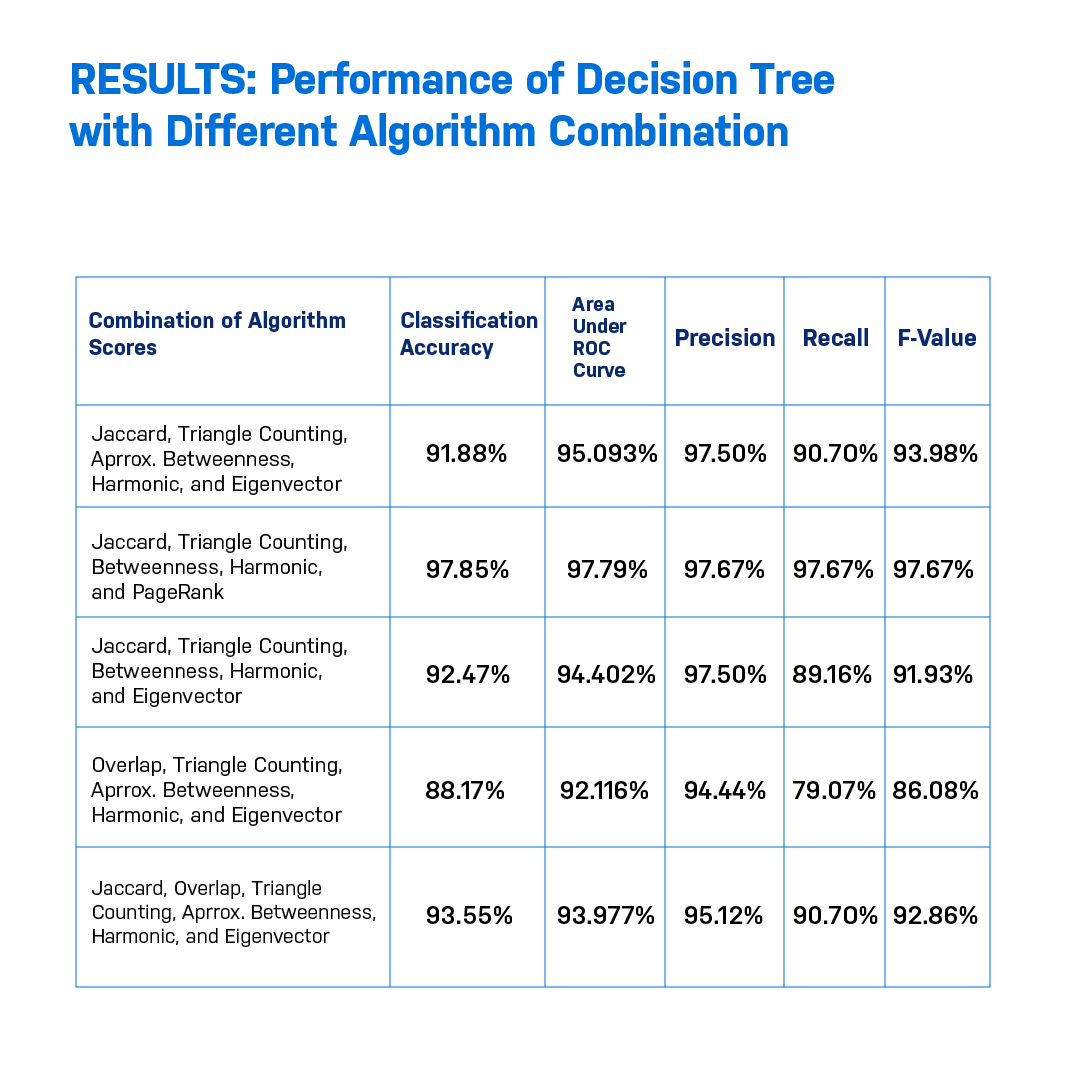
I imported these scores on another platform, which is for running decision trees, and I got my performance metrics, which was within the range of 87% to 97%. This sets a base for future research work.
Conclusion
I’m still learning, but it’s a base where my future research could incorporate hybrid techniques with graph algorithms and supervised learning.
For me, the most important outcome of this was learning how to use graphs and incorporating that into my research. For future research, one could benefit from using information related to these entities’ banking transactions and incorporating that information into the information that I’ve used.
Share Article


Explore
Related Articles
Fraud rings hide in the connections: Graph-Enriched Detection for Databricks Genie with Neo4j

SumoDB in Neo4j: Chaining Multiple Graph Algorithms in Snowflake — Part 3


Why machines need embeddings: Turning graph structure into features