Visual Cypher: Presenting Tools That Create, Visualize and Parse Cypher

Solutions Engineer, Neo4j
8 min read

Editor’s Note: This presentation was given by Eric Monk at GraphConnect 2018
Presentation Summary
Eric Monk is a Neo4j consultant. He implements solutions around Neo4j for customers. He has been working on a tool that helps users create, visualize and parse Cypher.
The first step in building any graph is to start with a question. When you model that question you get business concepts. From there, you import data and will be able to build your query.
Next, it is vital to have a thorough understanding of your tools. Arrows, db.schema, Neo4j ET, Bloom and LOAD CSV all exist to help users on their graph journey.
Cypher plays an important role in graph building and analysis. After importing Cypher to your create statements, you will merge the statements and then pull data from your data sources. All of this information will be put into your graph.
For someone like a consultant, who often is viewing a work-in-progress rather than a finished product, users are able to share their Cypher without even touching the graph. Consultants, such as Monk, are able see what the customer is trying to do and if it’s being done well.
Cypher is used in the Hero’s Journey example, also used in Hollywood screenplays, Monk’s NASA example video and within a graph built around the Tour de France.
From parsing Cypher, users can post their statements and results are instantly populated. From there, it is obvious whether the work was a success or a failure. Not only that, highlighting a portion of the data model being used shows the analysis side and how much of the data model a query takes up. The value of visualizing data with Cypher is truly unmatched.
Full Presentation
My name is Eric Monk and I’m a Neo4j Consultant. I help customers implement solutions around Neo4j. I’ll be showing you a tool I’ve been working on that helps you create, visualize and parse Cypher.
To set the context for why a tool like this could be useful, I want to show you this slide.
I took this slide from the Innovation Lab. The Neo4j Innovation Lab is a Neo4j offering. Essentially, they come on site, and in three to five days, walk you through the complete process of building a graph from scratch with a use case centered around your business.
Start with a Question
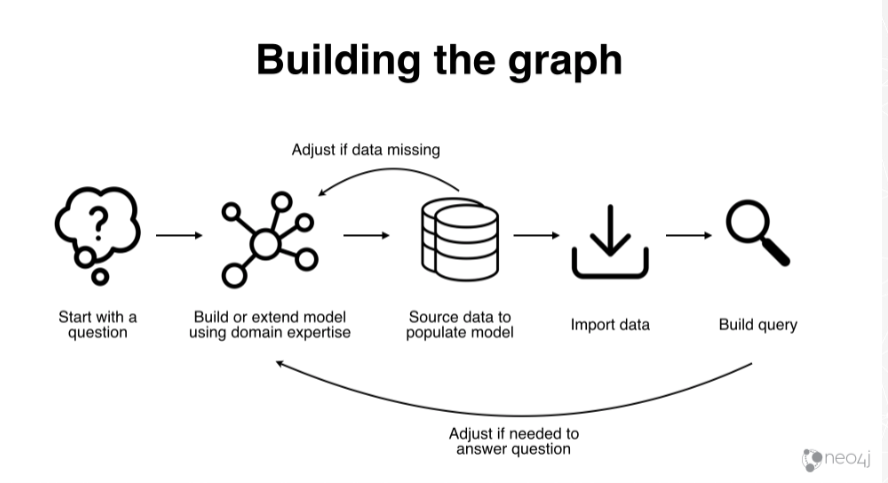
This is the process of building a graph from scratch. First, we start with a question.
Once you start modeling that question, you will have your business concepts. These are the things that are important to solve the question. You source that data model with existing data you have. Then you import the data and build your query. At the end, you have a real working graph that answers the question.
You have this interplay between, what do I want and then what do I have? In the middle of this you have this model. I’m going to point out that the model is iterative. The first time you do it, you’re probably not going to get it right. It usually takes a few times to get it right.
Then, you go through this process to enhance the data model as well.
Tools
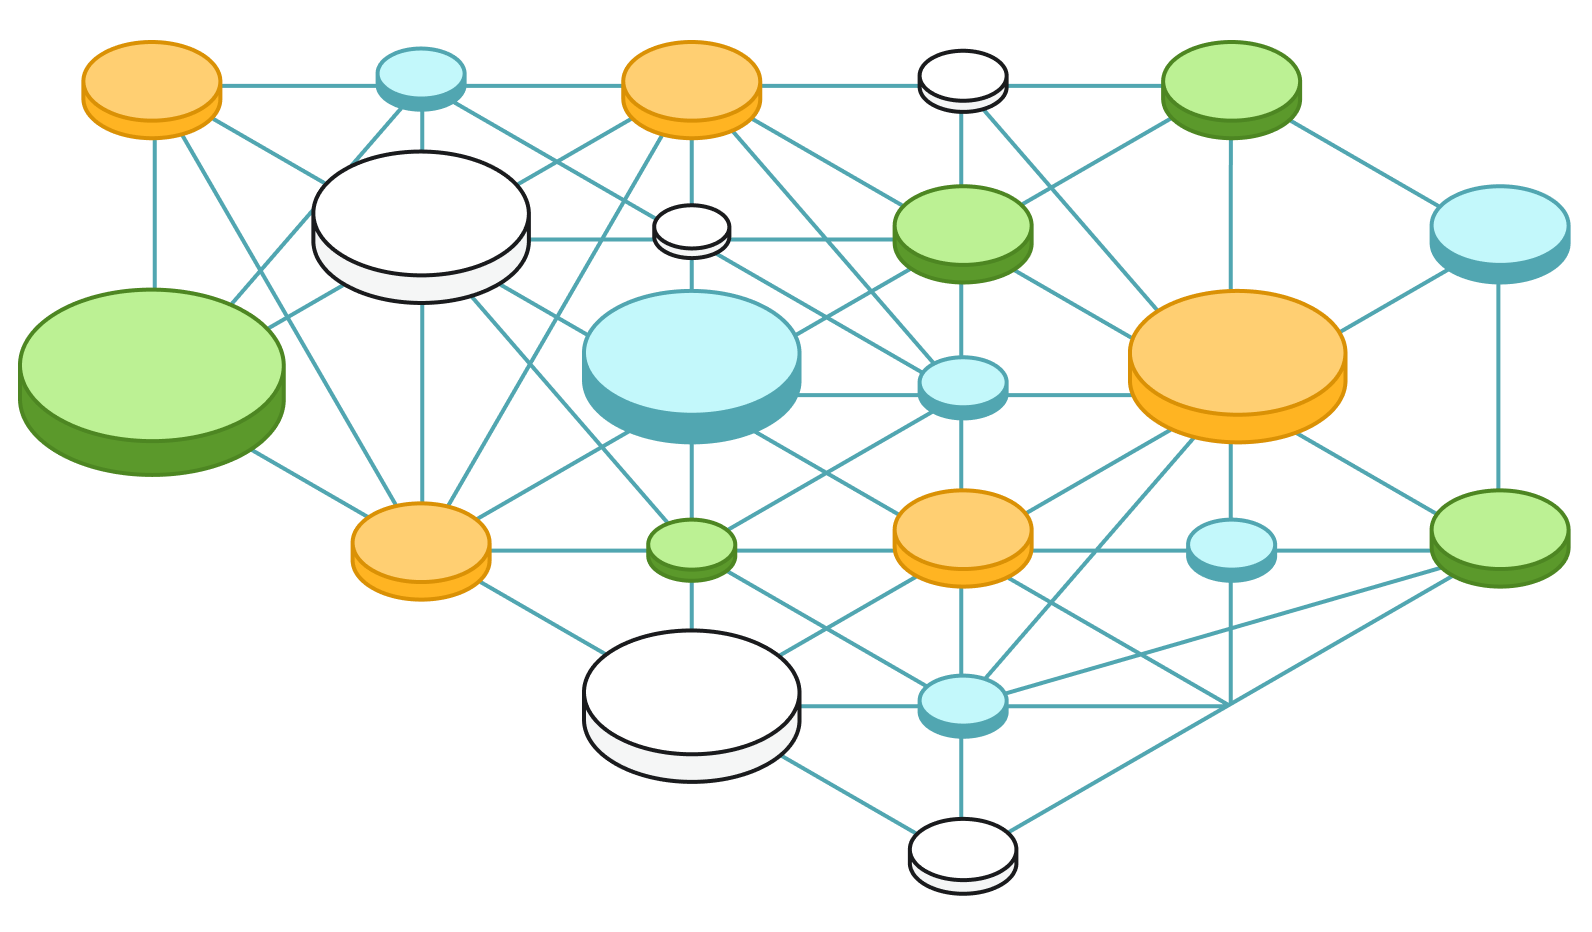
This slide shows you a few of the tools in the ecosystem to help you out with this process.
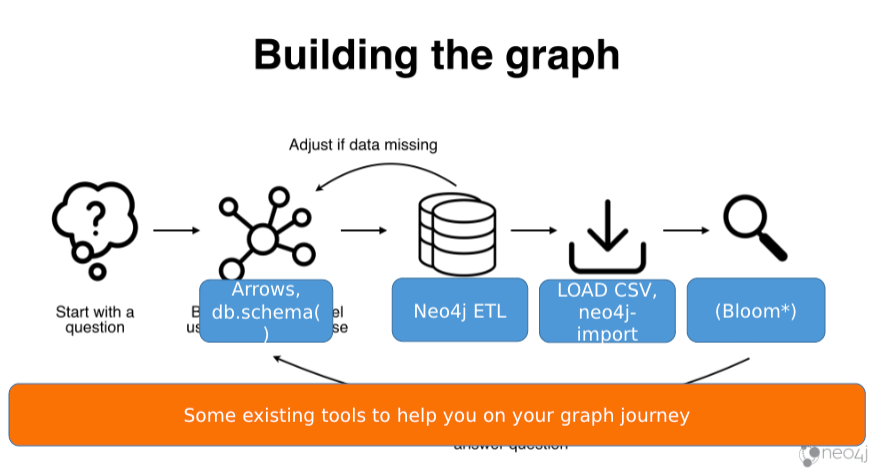
One of those tools is Arrows. Arrows has been around for a number of years. You may have used it already, or you may have seen its output in one of Max De Marzi’s blog posts. He has a lot of Arrow generated models.
DbSchema shows you the model that exists if you have an existing graph database.
LOAD CSV is the workhorse if you’re importing data into the graph. This is where you’re going to use stick data from your source systems into your graph.
Before I get into the demo, here is a quick note on data modeling. Neo4j is a label property graph. We have node labels, relationship types and property keys.
Below is a simple example, we have a person, company and an event. Person works for company, person attends event.
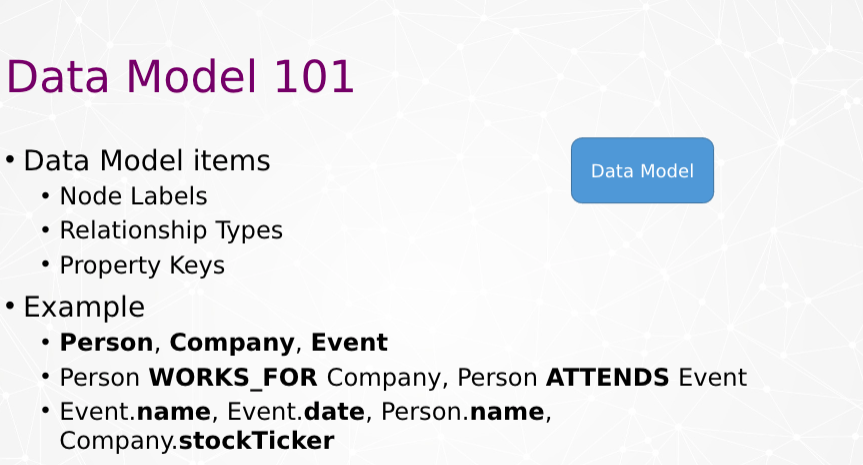
If you’ve used Neo4j for a while then this is old to you. If you’re new to Neo4j, these are the important concepts to understand.
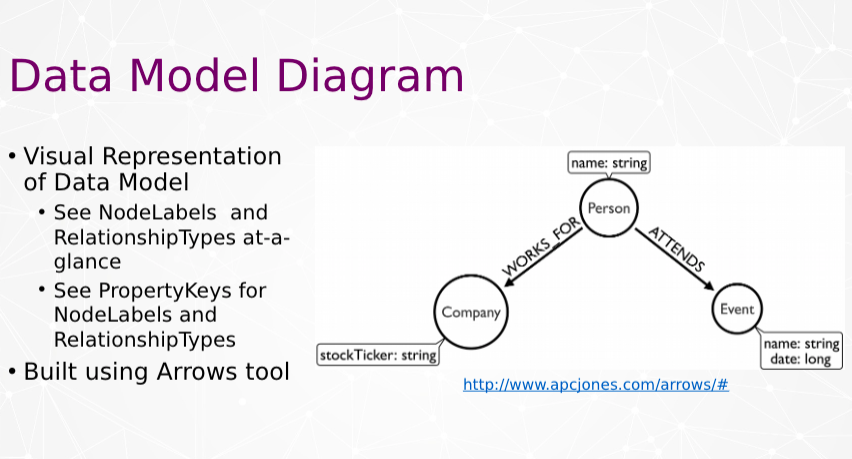
Below is a visual model of that same simple model. This is the same simple data model done in Arrows.
Cypher in Graph Building and Analysis
How does Cypher play into this concept of data modeling?
When you’re going through the process of building a graph, you start with your data sources seen on the below left.
You’re going to import Cypher to your create statements. Then you are going to merge statements. You will pull data from your data sources, and put it in your graph.
When you’re answering questions, you’re going to use Cypher to construct analysis Cypher. You are going to get answers out of your graph. If you had a data model, using Arrows, or through like a partner tool, you could constrain the Cypher, using those node labels or the relationship types. Then you would know how to write your Cypher appropriately to both import and then analyze the graph.
The tool I’ve been working on lets you go the other way around.
For me, as a consultant, I come on site and I don’t know what’s going on. People are able to just give me their Cypher without even touching the graph. It is fine if you already had the graph populated. However, if they’re in the process of building the graph, I am able to take a tool like this and see right away what they’re trying to do and if they’re doing it well.
Here is an example of import and the analysis Cypher.

We have import Cypher. This is where I’m importing myself as a node. Everything above that is in bold is part of the Cypher statement, which is appropriate to the data model.
Eric is a person, I have a property name. Graph Connect is an event. Eric attends Graph Connect. These are the things from the data model that are important. At the end, when I want to pull data back out, I’m using those same things: person attends event and the name properties.
Hero’s Journey
This example is called the Hero’s Journey. If you’re familiar with Joseph Campbell, he did some research and wrote a book about this concept of the Hero’s Journey. This is based on Greek myths.
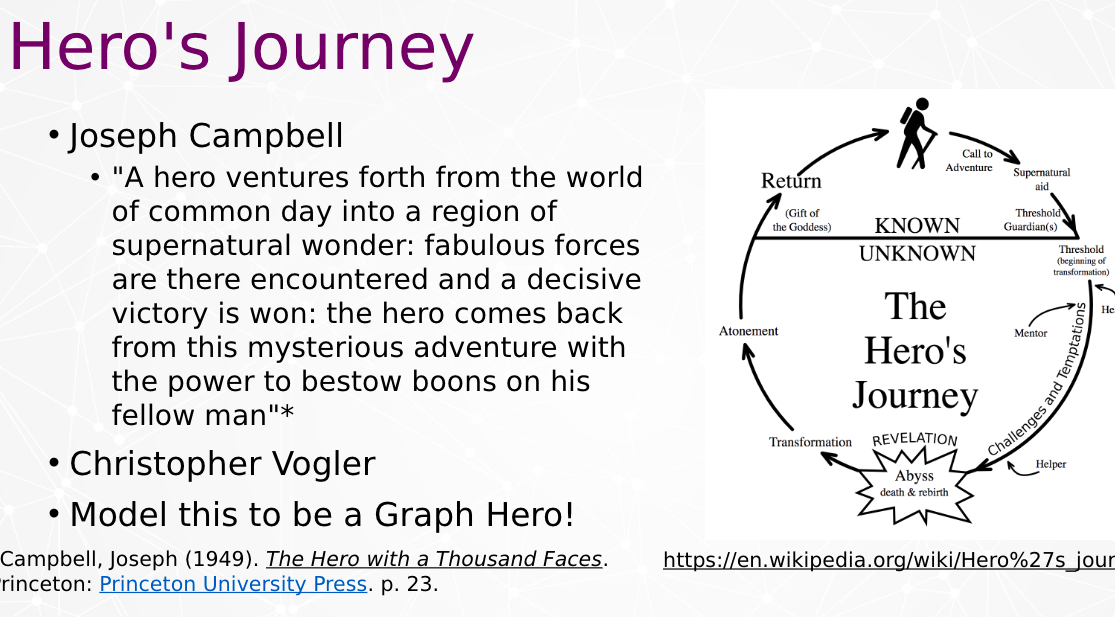
There’s a hero, living in an ordinary world, and they get this call to adventure. Typically they’re scared, they don’t understand and they refuse the call. They meet some mentor, some wise person on the way, and the mentor convinces them to go on the journey.
From there, they embark on their journey, they overcome obstacles they make friends, get some magical elixir and then they come through full circle. They return to the ordinary world as a changed person. Christopher Vogler has updated this concept for Hollywood screenplays.
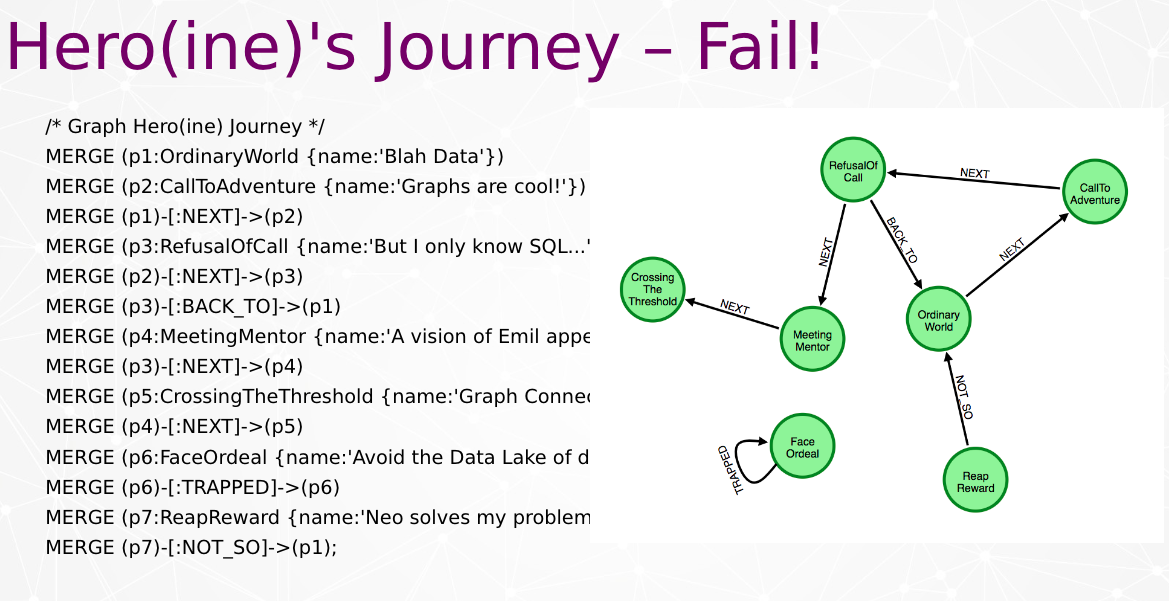
The model I’m going to have should look like a circle. I’ll parse Cypher and see our result.

Alas! It’s not a circle because I made mistakes in my Cypher. It may be difficult, just by looking at the Cypher. You may not be able to tell when you’re looking at long statements, if there’s a problem.
What happened is I started my ordinary world, went to the call to adventure and refused the call. Instead of meeting the mentor, I went back to the ordinary world.
Right away you see this is a visual way to determine if Cypher is working on the import or analysis side.
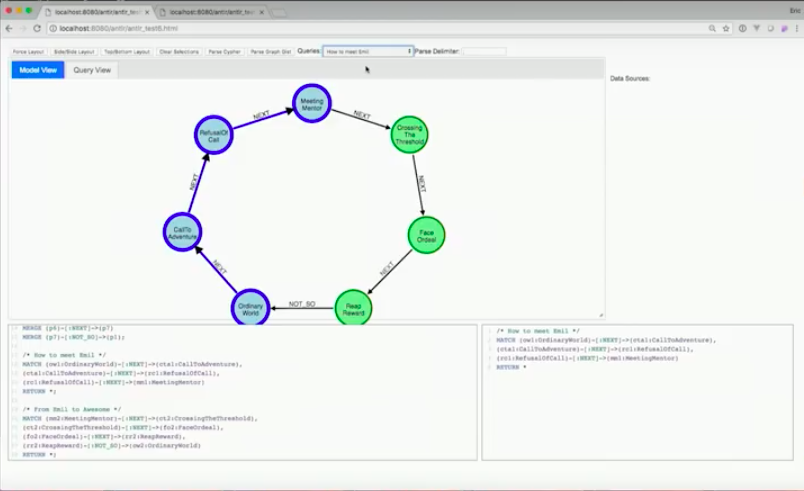
In order to fix that, you need to modify the Cypher. I’ve got the correct version below.

Now the Hero’s Journey looks like a circle, as it should. You see as I reap my reward, I return to my not-so-ordinary world at the bottom.
The fun thing is this is showing you the import Cypher. I’ll also say, “Hey, I want to write a query that shows me the quickest way to meet my mentor, Emil. “
I’m going to do the same thing. I will parse Cypher, the same exact model. There’s nothing new here from a data modeling perspective. However, for every Cypher statement, it’s going to show up on this little drop-down box.
If I click on “How do I meet Emil,” it’s going to highlight the portion of the data model that’s being used. I see from the analysis side, this particular query is using half the data model.
The data models I have showed you were ones where there’s a single view of a node label. However, this example shows the structure of airports and a flight between two airports.
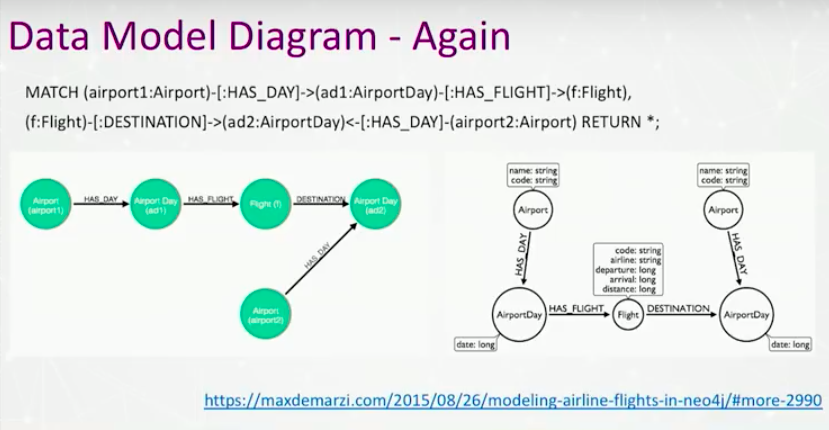
I have airport listed twice, and I have airport day listed twice. I’m showing the model with some structure. I wrote a Cypher statement that essentially mirrors that model and stuck on my tool.
NASA Example
NASA is running a contest. If applicants can take carbon dioxide, water and other elements commonly found on Mars. If you can create glucose, then you will win a sum of money.
There is a tool that is able to pick up Cypher wherever it is laying around. In Neo4j, there are a number of things called GraphGists. All of them have embedded Cypher.
Tour de France Example
This tool will go through and rip all the Cypher out and then it will show you. This is from the Tour de France.
There’s a Tour de France which has riders, a race, stages, cites and more. GraphGists will rip through all the Cypher, create a data model and you can look at it right away.
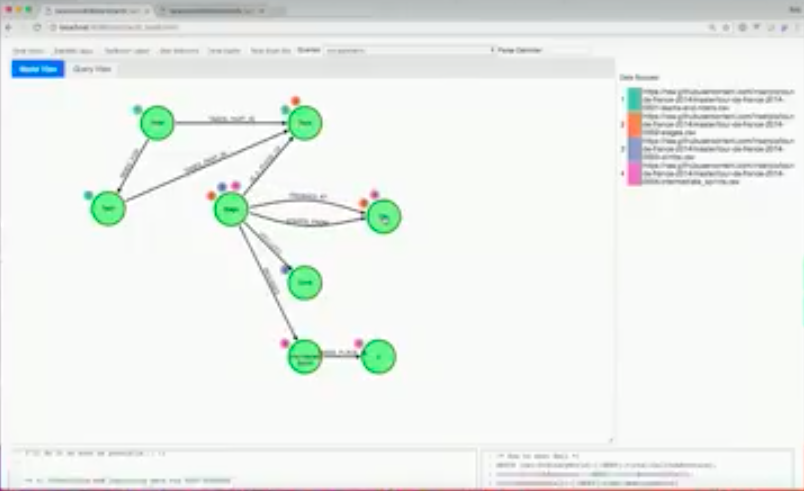
This one is a little bit more detailed because some of the nodes are annotated with little circles.
Stage has circles 2, 3 and 4 around it. If you look at the far right, there’s color codes that reference the actual data sources it came from. This means that stage, itself, has data that exists in three different files out of the four they’re using to construct the data set. This is important because stage is a central player that correlates the data amongst the different data sources.
This lets you start down the path of data lineage, and look at how is your graphing is sourced.
Conclusion
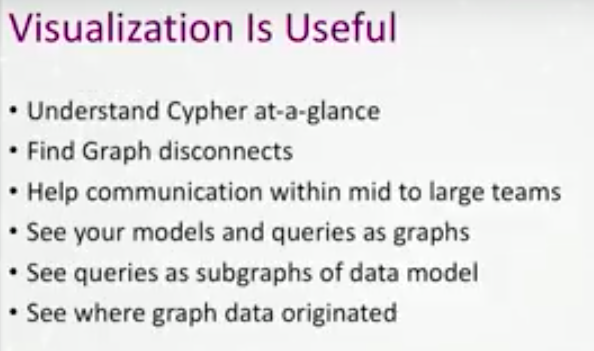
Visualization is useful, you can understand Cypher at a glance.
Visualization helps find graph disconnects, it helps with communications in mid to large teams. If you have teams that are split between doing import and analysis, it helps them coordinate with one another.
You also see the context, queries and the subgraphs of your data model. You see and think of your models or your Cypher queries as graphs themselves. You also see where your graph data originated.
Share Article


Explore
Related Articles

Hey LLM, you’re using OPTIONAL MATCH wrong. Here’s the Cypher that actually works.