
Webinar Spotlight: Knowledge Graphs Are Hot!

Senior Manager, Global Marketing Programs
3 min read
Originally coined in 1972, at 50 years old, the term “knowledge graph” is nothing new, but using them to derive business value is hot, hot, hot! About a decade ago, Google introduced their use of knowledge graphs and they’ve been on a roll ever since – and they’re just getting hotter.
In fact, in a 2020 Pulse Survey, 88 percent of CXOs polled believe that knowledge graphs will significantly improve their organization’s bottom line, and here at Neo4j, two-thirds of our customers (wow) have implemented a knowledge graph. Okay, so knowledge graphs are hot – but what are they?
A knowledge graph is an interconnected dataset enriched with meaning so we can reason about the underlying data and use it confidently for complex decision-making. There you go, I’m sure this statement clears it up for you! For those of you who might be thinking, “Hmm, okay, I’m still not quite sure” – I’ve got some great news for you.
Neo4j recently hosted a webinar on knowledge graphs that I think will really show you why they’re so hot (and what they can do for your organization). This webinar has it all – knowledge graphs, IoT, digital twins, and supply chain management. Read below for a quick abstract and then watch the recording – it’s really quite something!
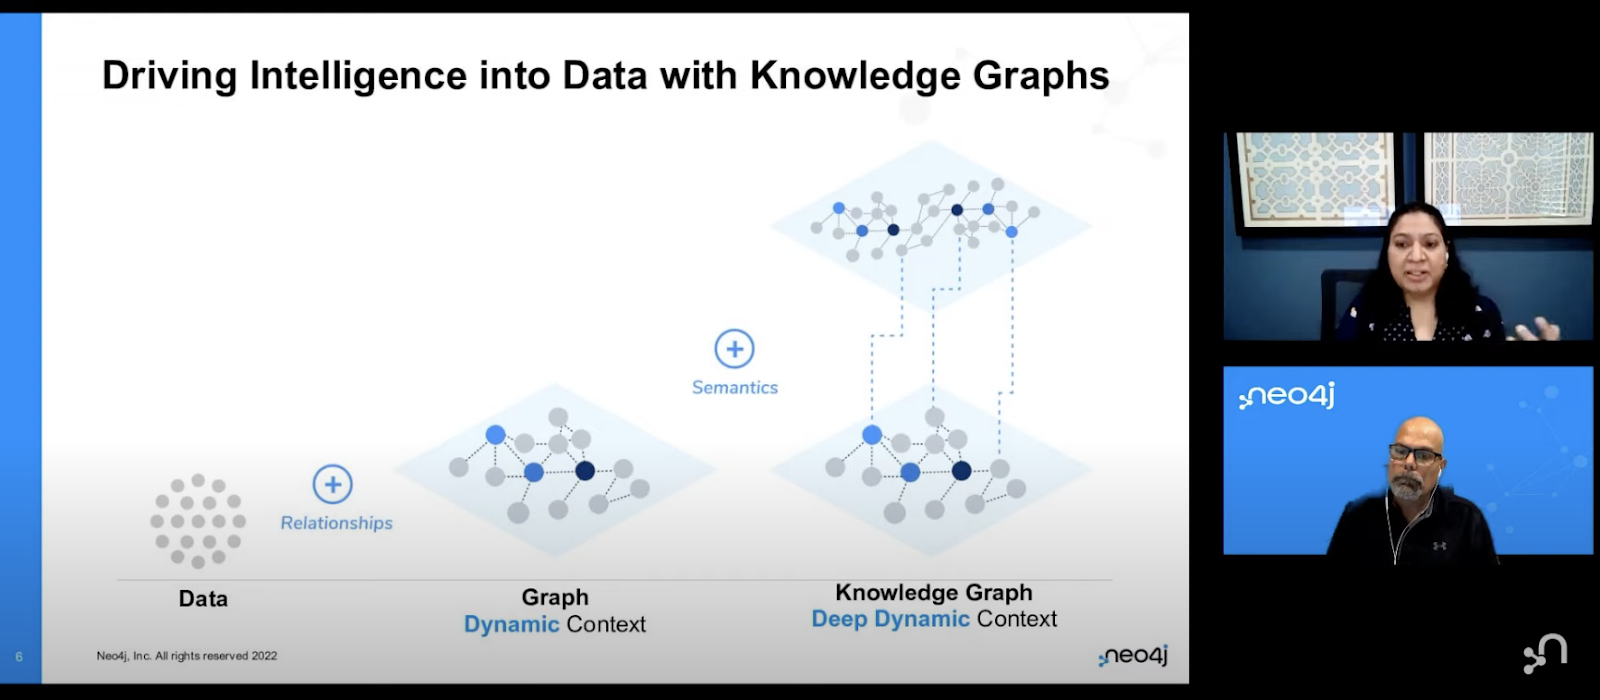
Optimize Your Supply Chain with Knowledge Graphs, IoT, and Digital Twins
Knowledge graphs are adept at mapping complex, interconnected data and maintaining high performance with vast volumes of data. Their relationship-centric approach makes them the perfect technology for building a digital twin.
In this webinar, you’ll learn how to apply this technology to supply chain management. Companies that use knowledge graphs for their digital twin can reap substantial benefits, including an end-to-end view of processes, agile problem resolution, and improved operational efficiency. Join us to find out:
- What a knowledge graph is and how to use it for your digital twin
- How to identify bottlenecks and perform “what if” scenarios in the knowledge graph
- Examples of digital twins being used for data discovery, bill of materials, and predictive maintenance in the supply chain
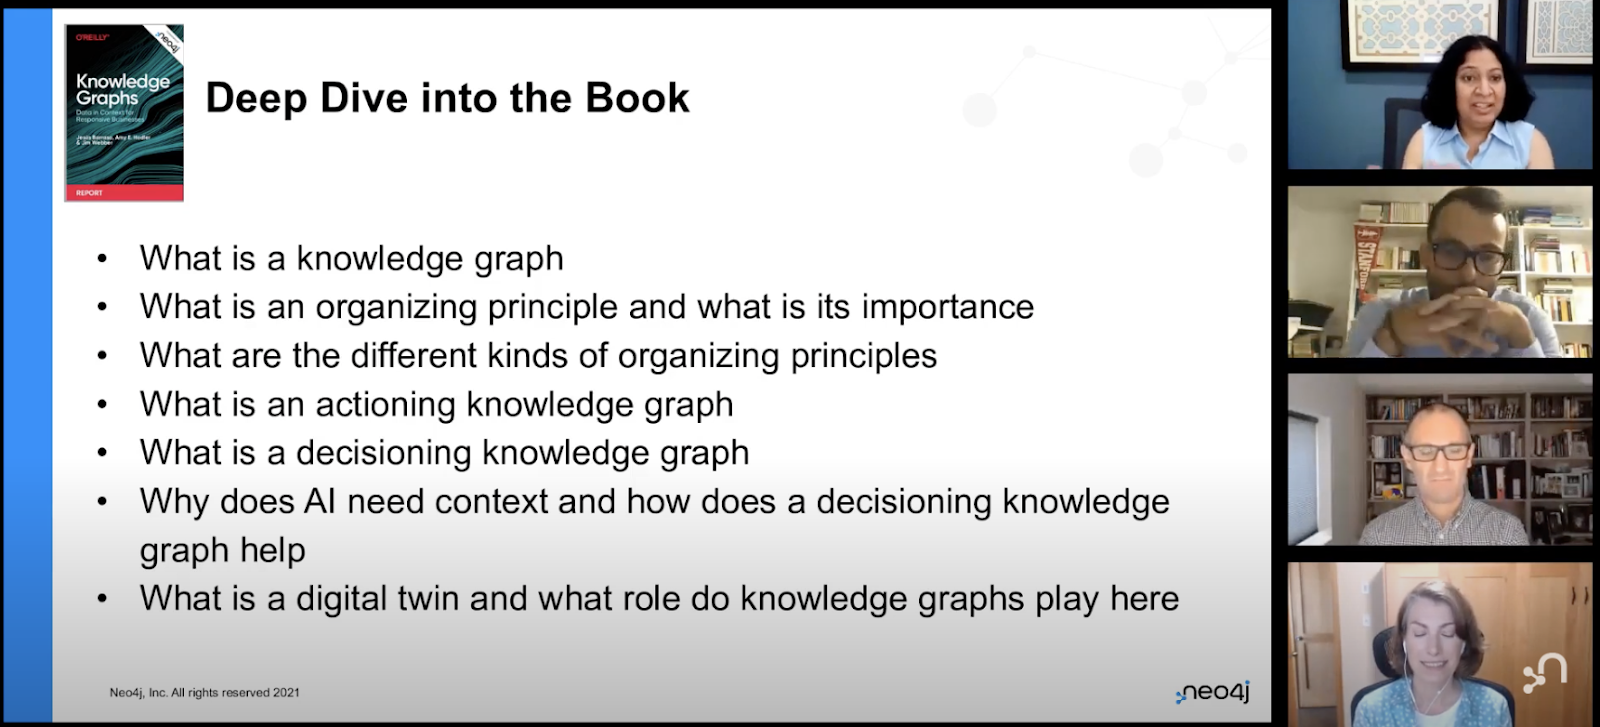
Meet the Authors – Knowledge Graphs: Data in Context for Responsive Businesses
I’d also recommend this webinar we hosted with the authors of the book Knowledge Graphs: Data in Context for Responsive Businesses. Moderated by subject matter expert Maya Natarajan, this 45-minute webinar features an interview with authors Jesús Barrasa, Amy Hodler, and Jim Webber where they discuss how to drive key business decisions using the contextual knowledge derived from a knowledge graph.
But don’t just take my word for it. Industry leaders like NASA, AstraZeneca, UBS, Lyft, Lockheed Martin, and Allianz are already deploying knowledge graphs for use cases like skills discovery, patient journey analytics, data governance and compliance, product 360, and risk management.
But wait, there’s more! In celebration of International Women’s Month, on March 22 we’re hosting an amazing webinar on knowledge graphs, with even more amazing women – Meet the Women Leading Innovation with Knowledge Graphs. Here’s a bit about what to expect:
Knowledge graphs take the power of connected data to the next level in modern data analytics, offering deep insights to inform critical enterprise decisions. Women across a range of industries are leading innovation with knowledge graphs, shaping the data landscape for years to come.
Join us for 60 minutes to hear how women are using knowledge graphs at top companies including Deloitte, EBSCO, Myraa Technologies, and DXC Technology. At this must-attend event, you’ll learn:
- What knowledge graphs are and when they work well
- How these women leaders entered the field of knowledge graphs
- Why knowledge graphs became the right solution for specific business problems
Share Article


Explore
Related Articles

How to Improve Multi-Hop Reasoning With Knowledge Graphs and LLMs


