How to generate deeply interconnected mock datasets

Suppose you’re a journalist on a crusade to unmask a particular super-powered vigilante. Your fiery publisher suspects a list of sightings, addresses, and witnesses will help crack this amazing story but
A) you don’t have this information yet and
B) aren’t even sure it actually contains headline-making clues.
How could this hypothesis be tested?
There are a lot of excellent mock data libraries and services for creating a spreadsheet of imaginary people and super-powered identities. Creating a list of fake sightings, addresses, and witnesses is also fairly easy. But all this data is independent of each other so sticking it all into a database to do experimental analysis on would be pointless.
None of this fictitious data would contextually link, not like actual data.
In swings, a new mock data generation tool that can do exactly this — create deeply interwoven synthetic data to test out new ideas.
The Mock Graph Data Generator is currently available on streamlit cloud via this short link: https://dev.neo4j.com/mock-graph-data-generator.
Designing the Web
The first step in creating such data is deciding how all the information interrelates. Writing down concepts or drawing them on a whiteboard and connecting them with lines is a super easy way to start.

People intuitively do this when white boarding ideas or when trying to solve conspiracies in movies.

These types of diagrams are known as networks or graphs. There’s a great tool by Varun Shenoy called GraphGPT, which uses ChatGPT to convert any written text, such as a description of an idea, into a graph.
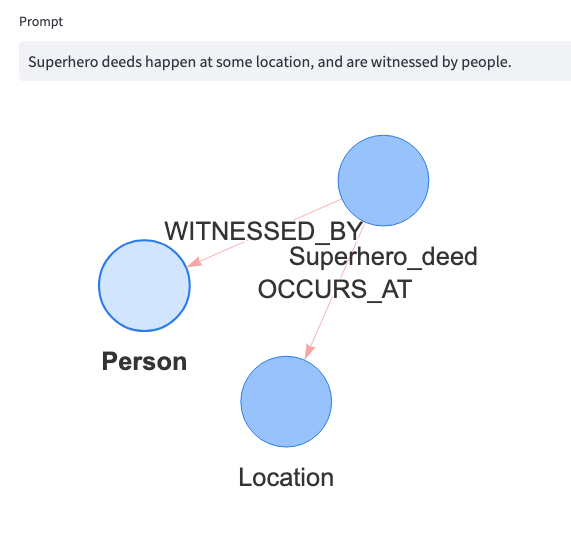
A version of this approach is in the Mock Data Generator’s Ideate Tab. With an OpenAI API key you can quickly draft up graphs from prompts.
“A superhero is a person who does heroic deeds and has the ability to do them in a way that a normal person couldn’t.” — Stan Lee
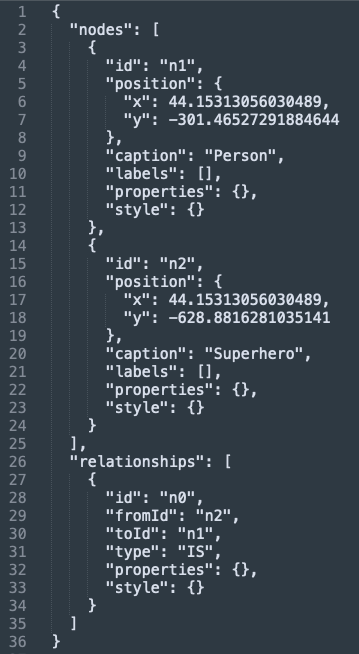
The Mock Graph Data Generator version adds the ability to export a JSON file of the model.
This can then be uploaded into a free online tool called arrows.app. It’s a lightweight UI tool for creating and editing graphs to generate shareable images. The Mock Data Generator has this embedded in it’s Design Tab.
Using arrows, we can modify the initial GPT-generated graph (or create it if you skipped the GraphGPT option). The Superhero_deed node can be broken out to individual Superhero and Deed nodes, this expanded graph nicely represents the hypothetical data we want.
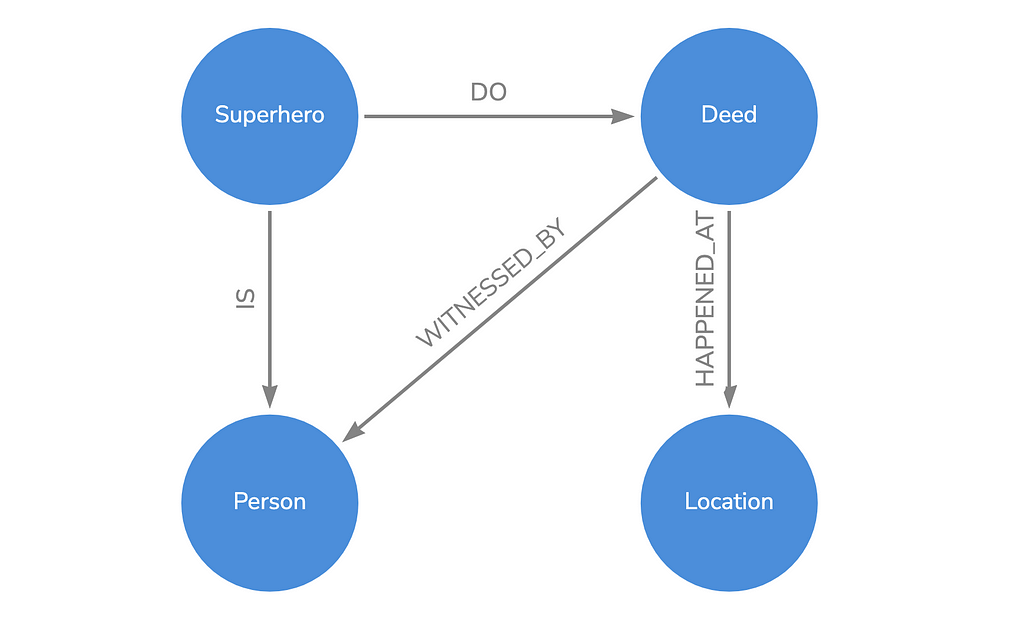
Note that each node here represents a category of data. So the Person node represents ALL the people in the dataset, both those who witnessed deeds and our mystery hero.
The arrows.app can also output a .json file of this updated graph.
Uploaded this into the Mock Graph Data Generator’s Generate Tab — several functions will automatically kick-off to create a random number of nodes and relationships using the node caption and relationship type properties.
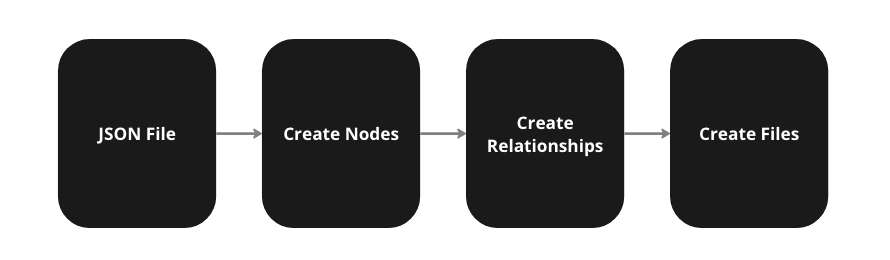
The output of the tool is a collection of CSV files and a JSON file that maps everything together.
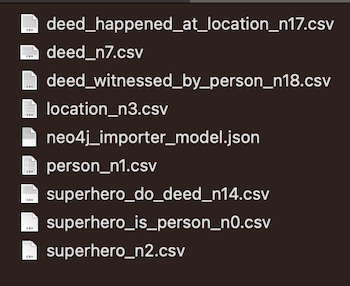
CSV files can be imported into any spreadsheet or database to do some analysis. But before trying this, the data could be more realistic. Person nodes could use some name properties, Locations latitude-longitude info, and date-time for when Deeds happened.
Creating a Better Web
The arrows.app supports the ability to notate property information on nodes and relationships. So by clicking on the Person node, and then on the + Property button. A first_name property can be added.
Arrows doesn’t strictly enforce value types so any string value works.
The Mock Graph Data Generator though is on the lookout for particular keywords to decide what type of pseudo-property data to generate.
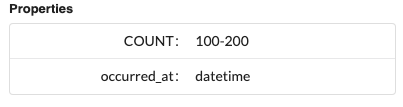
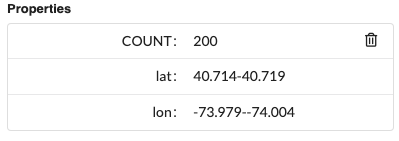
The first thing we can do is specify the number of node and relationship records to generate. We can do this by adding COUNT as a property key with any number as a value.
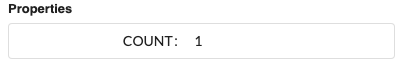
If a little randomness is preferred, use a range of whole numbers in the value (ie 100–200).
For adding date information, the word datetime is a special property value keyword and will prompt the generator to create a random UTC ISO 8901 datetime between Jan 1st, 1970, and today.
For adding random lat-long data, we can also use literal float values. To make the data more realistic, we’ll use a range of numbers that would reasonably cover a part of New York City, which is located around 40.714° latitude and -74.002° longitude.
For adding in first and last_name properties, we’ll use a special configuration value that explicitly tells the Mock Graph Data Generator to use specific fake value generators.
A list of these generators can be found on the Design Tab in the right-hand column. Arrows.app is embedded in the left 3 quarters of the page to make it easier to go between them.
Selecting any generator in the dropdown list will expose additional information, sample output, and the property value code to use. These code values are always in the form of a stringified JSON object (ie {“catch_phrase”:[]}):
Once all the nodes and relationships have been notated to our liking, download the files again using arrow’s Download/Export button.

Upload this in the Mock Data Generator tool’s Generate tab like before. This will automatically create a new custom sample dataset. This time with the specified number and properties for the node and relationship records.
Crawling the Imaginary Web
Great. We can now proceed to the second part of the hypothesis — could data like this hold newsworthy clues?
There are many different types of database technologies that could use the generated CSV files, but this Mock Data Generator was designed specifically for one kind — a graph database.
As the name mostly implies, a graph database stores information in a way similar to our earlier network diagrams. Relationships, which are normally not stored as first-class structures in other types of databases, are permanent parts of the data store. In a property graph database specifically, both nodes and relationships also have properties associated with them.
The storage of this type of data is optimized so that information from any given node can be quickly traversed to any other connected node. These types of databases are especially good for solving questions involving many-to-many relationships.
The ZIP file generated by the Mock Data Generator is compatible with Neo4j’s Data Importer tool. This tool can independently load arbitrary CSV files and map them using a variation of the arrows app.
To use the Data Importer you’ll need a running Neo4j instance, cloud or local, and will need to use the database’s specific URI, username, and password (which are provided when you first create a database).
Within the Data-Importer, import the data by selecting the Data Importer’s > … > Open Model (with data) option, the mock data generator .zip can be loaded and immediately imported.
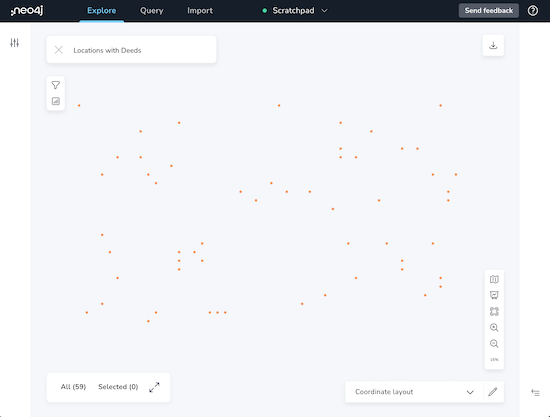
Once loaded, a no-code data exploration tool called Bloom (or Query in Workspace) can be used to visualize the data for analysis, exploration, and editing.
It also includes a coordinate-based layout option for nodes that have x and y type properties, like latitude and longitude.
For those wanting to dive deeper, a special graph-centric query language called Cypher can be used. It’s similar to other database query languages except it uses ASCII-art-like shorthands to denote patterns.
So if you wanted a sorted list of Witnessed Deeds, based on the number of witnesses, it would be like this —
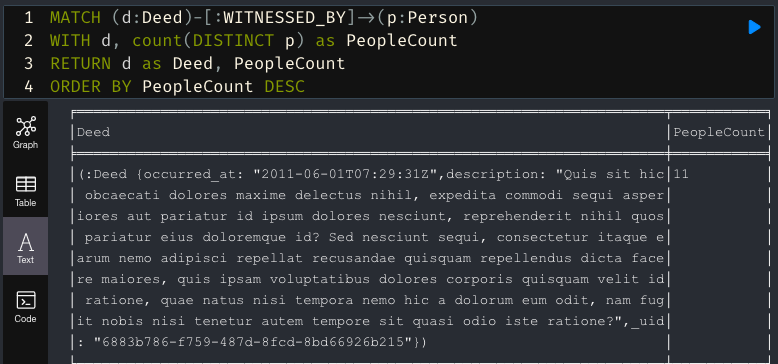
And for those wanting to really leverage the power of graphs, there’s a Graph Data Science library that can also be enabled. This library makes it relatively easy to run a wide range of Data Science algorithms like page ranking, community, or link prediction. One can even extract features, and train and run machine learning models with it.
With Great Data…
After experimenting with this synthetic data, “real” versions of it should contain some promising leads. But it‘s also very apparent that more types of information are needed to definitively identify an anonymous neighbor performing a bunch of deeds, friendly or otherwise.
Adding people’s locations throughout the day and their network of friends could be enough. But would less intrusive data types also work? I don’t know, but you can easily make sample data sets to find out.
The Mock Graph Data Generator is currently available on streamlit cloud via this short link: https://dev.neo4j.com/mock-graph-data-generator.
If you‘re a fellow Pythonista, the messy code for this tool is located at https://github.com/jalakoo/mock-graph-data-generator. Suggestions are always welcome.
Creating a Web of Synthetic Data was originally published in Neo4j Developer Blog on Medium, where people are continuing the conversation by highlighting and responding to this story.
Share Article


Explore
Related Articles

Text2Cypher Across Languages: Evaluating Foundational Models Beyond English