Exploring fraud detection with Neo4j & Graph Data Science – Part 1

AI Research Engineer, Neo4j
6 min read
In the first part of this fraud detection series, we will introduce the sample graph dataset we are using and begin exploring the graph for potential fraud patterns.
The technical resources to reproduce this analysis and the analysis in all subsequent parts of this series are contained in this GitHub repository, which includes an iPython notebook and link to the dataset.
Learn how to build more accurate, sophisticated fraud detection applications with graph databases. Download the free ebook, Accelerate fraud detection with graph databases.
Dataset introduction
We will be using an anonymized sample of user accounts and transactions from a real-world peer-to-peer (P2P) platform.
Prior to ingesting the data into graph, the original identification numbers were removed and categorical values were masked. Each user account has a unique 128-bit identifier, while the other nodes — representing unique credit cards, devices, and IP addresses — have been assigned random UUIDs. These identifiers are stored as the guid property in the graph schema.
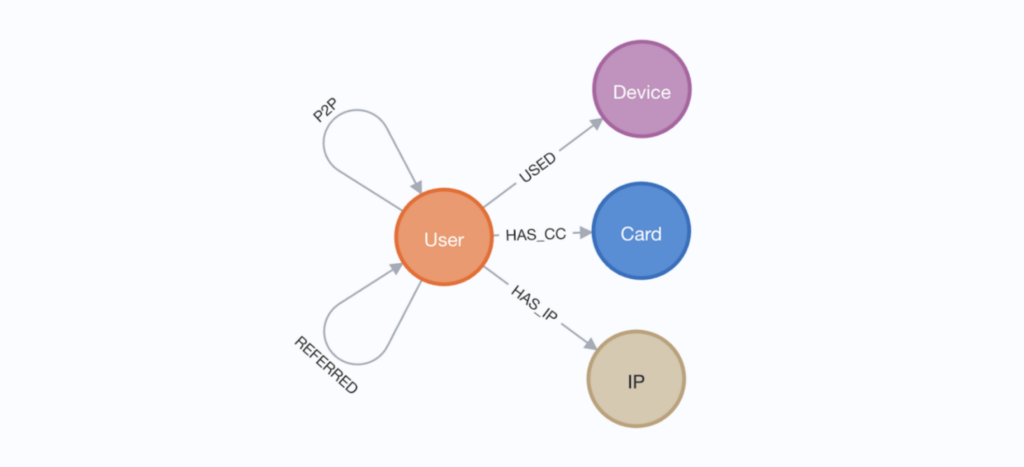
Below is a visualization of the graph schema:
In this anonymized version of the dataset, P2P transactions are represented by relationships going from the sender to recipient user accounts. We are disclosing 3 identifier nodes for users: credit cards, devices, and IP addresses. Users can also refer other users onto the platform and there is a relationship representing this, though this is sparsely present in the dataset and not leveraged in our analysis.
Each user node has an indicator variable for money transfer fraud (named MoneyTransferFraud) that is 1 for known fraud and 0 otherwise. This indicator is determined by a combination of credit card chargeback events and manual review. A chargeback is an action taken by a bank to reverse electronic payments. It involves reversing a payment and triggering a dispute resolution process, often for billing errors and unauthorized credit use. In short, a user must have at least one chargeback to be considered fraudulent. Only a small proportion of the user accounts, roughly 0.7 percent, are flagged for fraud.
A closer look at cards and devices
Upon an initial investigation of aggregate statistics, the labeled fraud accounts do not look well connected, which would naturally incite skepticism of a graph-based approach. This is exemplified well by the lack of discrimination in key identifiers.
As a first step, I broke out the ratio of fraud vs non-fraud users connected to credit cards and devices (full code in this notebook) to find that very few cards or devices are centered well around flagged accounts. This is a bit surprising for me. If a card or device is used by an account flagged for fraud, I would expect the other accounts that use the card/device to also be flagged for fraud a significant portion of the time.


Exploring potential fraud patterns with community detection
In this example, it is unclear to me what exactly is taking place, and I have a hunch that the fraud activity is not completely labeled given the lack of connectivity and the limited chargeback logic used to flag fraud.
At the same time, I do not want to simply label every user that shares a card or device with another flagged account, since it is possible that a benign user’s device and or card was used fraudulently by another. Since fraudsters are actively avoiding being identified, actors committing fraud are often not just represented by a single user account, but rather by multiple accounts and identifiers which, hopefully for us, share some connections and similarities.
In a graph, we can attempt to roughly identify these fragmented identities with Community Detection, a large set of methods that attempt to partition graphs into well connected groups, a.k.a. Communities, where the connectivity in the communities is significantly higher than outside the community. There are multiple forms of community detection. We will use a couple in this post, starting with Louvain.
Using Louvain community detection
Louvain is useful for exploratory analysis of communities because it uses a form of modularity scoring to split up the graph into hierarchical clusters. This means that your theories around fraud patterns and graph structure don’t need to be exact for it to provide informative communities and insights.
I will leverage P2P transactions, cards, and devices for Louvain. We will leave out IP addresses for now since they have some super node issues (we will leverage IP addresses in subsequent parts of this series). Below are the queries for running louvain in Neo4j GDS and aggregating community statistics. The last query below orders communities by the count of flagged users so we can further examine some of the more concentrated flagged communities.
# create graph projection
g, _ = gds.graph.project('comm-projection', ['User','Card', 'Device'], {
    'HAS_CC': {'orientation': 'UNDIRECTED'},
    'USED': {'orientation': 'UNDIRECTED'},
    'P2P': {'orientation': 'NATURAL', 'aggregation': 'SINGLE'}
})

# run louvain
_ = gds.louvain.write(g, writeProperty='louvainCommunityId')

# aggregate Results
gds.run_cypher('''
    MATCH (u:User)
    WITH u.louvainCommunityId AS community,
        count(u) AS cnt,
        sum(u.fraudMoneyTransfer) as flaggedCount
    RETURN community,
        cnt,
        flaggedCount,
        toFloat(flaggedCount)/toFloat(cnt) AS flaggedRatio
    ORDER BY flaggedCount DESC LIMIT 100
''')
We can take the community ids from the above table and examine their users and connecting identifiers in Neo4j Bloom with queries of the below form:
MATCH (u1:User{louvainCommunityId: $id})
    -[r1:HAS_CC|HAS_IP|USED]->(n)<-[r2:HAS_CC|HAS_IP|USED]
    -(u2:User{louvainCommunityId: $id})
WITH *
OPTIONAL MATCH (u1)-[:P2P]-(u2)
RETURN
Below are a couple examples of these communities. Flagged users are colored red with caption=1 with other users colored orange and caption=0. We will see an interesting pattern of flagged users sending money to non-flagged users with which they share devices, cards, and IPs.
This behavior is suspicious because it suggests that the same individual or group of individuals may be using multiple accounts to withdraw cash from credit transactions prior to a chargeback being executed on the cards. The shared credit card examples (such as example 2 below) are some of the most indicative.


This pattern indicates that the receiving user accounts are fraud risks.
Next steps
Despite having little knowledge of the data beforehand, we were able to use some pretty simple graph algorithms and exploratory analysis to quickly and easily uncover suspicious patterns that may be indicative of fraud. In part 2, we will use these patterns to inform the resolution of fraud communities and the labeling of additional fraud risk accounts.
Here’s your key to the whole series:
- Part 1: Exploring Connected Fraud Data
- Part 2: Resolving Fraud Communities Using Entity Resolution & Community Detection
- Part 3: Recommending Suspicious Accounts With Centrality & Node Similarity
- Part 4: Predicting Fraud Risk Accounts With Machine Learning
Learn how to build more accurate, sophisticated fraud detection applications with graph databases. Download the free ebook, Accelerate fraud detection with graph databases.
Share Article


Explore
Related Articles
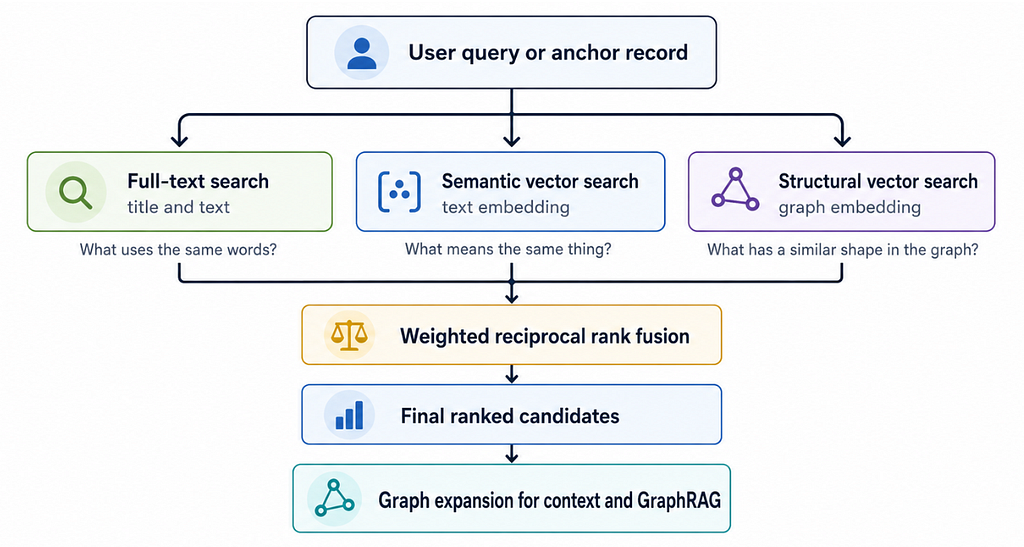
Hybrid Search in Neo4j: Full-Text, Vectors, and Graph Topology with Cypher