What Is Graph Embedding? How to Solve Bigger Problems at Scale

Head of Developer Organic Marketing, Neo4j AuraDB
15 min read


Cover image of how lasers generate an artificial reference star for the ESO Paranal Observatory in Chile, licensed under Wikimedia Commons.
See “Node to Knowledge Graph Embeddings” with author Tomaž Bratanič, live during Neo4j’s NODES 2022 live streaming webcast at 1500 GMT / 11:00 am ET Thursday, November 17. Registration for the 24-hour live, worldwide event is free.
It’s not a commonly used phrase yet, at least not in the information technology space: graph embedding. For now, it’s more of a data science phrase, borrowed from the playbook of mathematicians. (Stanford University professors prefer the phrase “representation learnings.”) As a technique in itself, it isn’t particularly innovative. You could argue that the moment the Greek architect Isidore of Miletus discovered, around the fifth century B.C., the geometric parameters behind Archimedes’ designs, and re-created them in new buildings at different scales elsewhere, graph embedding in some form was born.
It’s the idea that, in some form, when solutions can be represented visually as graphs, the key geometric components of those solutions can be mapped to a smaller-scale, more compact matrix — or even another graph — without significant loss of precision. For our purposes, graph embedding accomplishes this: With an extremely large and dense matrix of values whose arrangement has some organization to them, enabling them to be plotted as a graph, the components with which those values are organized can be mapped to a smaller number of values, or vectors, that could enable us to achieve essentially the same results.
Put another way: We go through a lot of trouble consuming vast tracts of storage to project matrices for such applications as machine learning and predictive analytics. We even build colossal “data lakes” whose inlets are streams of live, raw, unprocessed data, collected in singular, virtual volumes in hopes that we find the means (or even the time) to discover the patterns behind them.
If we were employing graph embedding to begin with, we might not need these monolithic data stores. Instead, we could build a few ponds here and there, swapping out a few points of accuracy (that, for some applications, users may not even notice) in exchange for quite a lot of our time back, along with maybe several thousand dollars in monthly S3 storage fees.
“Everybody wants to avoid manual feature engineering,” remarked Tomaž Bratanič, author of Manning Publications’ Graph Algorithms for Data Science. “A lot of work needs to go into it — it’s very labor-intensive. Instead, people design algorithms that auto-magically construct those vectors. You don’t have to do a lot of thinking and say, ‘So should we encode the number of two-hop neighbors, or the friends of friends? Should we encode clustering coefficients?’ No. You just say, ‘Do your magic,’ without much input. It’s an unsupervised algorithm.”
Discover More about Graph Embeddings
- Graph Embeddings: AI that Learns from Your Data to Solve Problems by Alicia Frame
- An examination of node embedding algorithms from the Neo4j Graph Data Science Library Manual
- A complete, free course on Graph Data Science Fundamentals from Neo4j GraphAcademy
The Gist of Things
“What if, using fancy math, we could crunch 10 million numbers down into a more manageable list of numbers — say, just 2?” remarked David Allen, Neo4j’s Senior Director of Developer Relations. “Well, then, we could turn any node into an (x, y) coordinate on a plot! This is what graph visualization does. It takes an n-dimensional graph and plots it as a flat picture. Now, we know that can get messy, and many graphs are so rich that two dimensions are not enough. What if we had a way of crunching those 10 million numbers down into a vector of any length we chose? Perhaps 64 would be enough to capture the richness of those relationships. That’s graph embedding.”
At its most general level, an embedding is a way of using a lower-order mathematical model to represent, even if only by approximation, a higher-order function. What graph embedding promises is a method of minimizing huge data tables and expediting results — a method lucrative enough to convince organizations that use their data to solve big problems, to switch from typical tables or unstructured data pools to graph database.
Embedding could present your organization with a clever way to incorporate vast amounts of information in patterns that require far fewer digits to represent. You can’t continue relying on supercomputers, or massive storage arrays in colossal, networked data centers, to solve every big problem facing us as a species: climate change, epidemiology, social unrest, carbon emissions, saving the coral reefs. You need to be more clever in how you use the tools presently at your disposal. In order for you to learn how to do more with less, you’ll need to adapt your machine learning techniques, your simulations, and your world modeling, enabling them to do more with less at the outset.
“The fancy way to say it,” remarked Allen, “is that we are projecting an n-dimensional graph into lower dimensional space. The not-fancy way of saying it is this: We’re taking a row of 10 million numbers and turning it into a row of 64 numbers. We’re willing to lose some information in the name of simplification.”
When would such a technique ever become vitally necessary? Allen tells us, it already is: “You can’t visualize 64 dimensions. Yet machine learning algorithms can.
“The whole point of ML pipelines,” Allen continued, “is to take these massive data plots — just like x, y plots — and find patterns in them. The computer won’t be worried about 64 dimensions, or even 128. Today, you could find patterns in 10,000 data points. Yet without graphs, there would be certain topological patterns you could never see. Graph embeddings encode topological patterns in a way an ML algorithm can understand. They boil down the complexity of graphs into far more manageable vectors.”
The Galaxy in Your Pocket
Here is one way to think about graph embedding — a kind of thought experiment: Suppose you could write all the possible solutions to a mathematical formula on a giant scroll, in a particular and exact sequence. And you could paste those solutions like wallpaper to the inside of a hollow sphere. Next, imagine that you could point to any single solution with a laser in the center of that sphere, like a laser-guided telescope in an observatory. The angle the laser was pointed would tell you where the solution is. If the X and Y angles of the laser were incorporated into the original formula, they would not only tell you where the solution was, but once calculated backwards, what the solution was.
So you could cheat: You actually wouldn’t need to write or paste anything to any sphere anywhere. Your X and Y angles would form a vector, and you could use that vector as your index. Work that index backwards, and you have the solution.
What we’ve just explained, in a rather rudimentary way, is a method for representing a finite list of solutions to a known formula using two floating-point values representing two dimensions in space. Now, you’d be right to interject that the precision levels of these X and Y coordinate variables would have to be off-the-charts. For any reasonably complex formula, you’d need far more than 128 digits to pull this off.
However, if we imagined the “laser pointer” vector in a space with greater than 3 dimensions — call it “n-dimensional space” — then you could use (n – 1) floating-point values of somewhat lesser precision to achieve the same index in a way that consumes just a few more bytes, although easier for math to resolve.
“Graph embedding is usually used,” explained Prof. David A. Bader, founder of New Jersey Institute of Technology’s Department of Data Science, “when we’re doing graph representation learning, or trying to do a machine learning technique to learn patterns within graphs. If we have patterns, then embedding is a great solution. I do work with a number of organizations that are accelerating their graph embeddings, and using them for learning features within a graph.”
The act of graph embedding has to do with representing higher quantities of information with geometric patterns. The types of information that Neo4j typically represents with a vast graph of connected notes, can be encapsulated into a smaller, denser graph.
Why? Today, traditional database models — even those that exist in so-called Big Data constructs — have yet to acquire a fraction of the capacity they would need to simulate real-world scenarios for scientific purposes, accurately and reliably. Sure, it’s feasible for traditional databases to model certain economic conditions and circumstances, or highly interconnected logistics and supply chains, or patterns of human behavior. But molecules of air currents in hurricanes? Cancer cells in a living organism? Human brainwave activity? Not yet.
“Graphs are powerful,” explained Neo4j’s Allen, “because they capture complex system dynamics in the form of networks. Graph embeddings are a kind of gateway, where all of that network complexity can be boiled back down into little more than long lists of numeric values. Those embeddings can then be poured into any kind of machine learning algorithm — even one that isn’t graph-native — so it can see and understand key bits of the graph’s topology, and learn lessons from it. Topological lessons, like who is close to whom in a social network.”
Discover More about Graph Embeddings
- Understanding graph embeddings with Neo4j and Emblaze by Nathan Smith, Towards Data Science
- Bridging traditional ML to your Neo4j Graph with node2vec by Dave Voutila
- Graph Embeddings in Neo4j with GraphSAGE by Sefik Ilkin Serengil
Sparring Match
>Here’s how the problem first came to light sometime around 1970. At that time, a fellow named Wayne Zachary first began considering whether a mathematical model could be created to represent two bickering factions among members of a university karate club.
Just as in the broader scope of human society, where wars, diseases, and famine threaten the existences of large swaths of the population, this skirmish centered around inflation. One faction was fiercely loyal to the club’s founder, dedicating themselves to his service despite his wishes to raise membership fees. The other faction supported the club’s president, who had pledged to keep prices stable, and was unwilling to renege. Zachary wondered, could a graph depict the interactions between members of the club over several years’ time, in such a way that a formula could predict which members would join what factions?
For the next seven years, Zachary would construct candidate models, some appearing to have employed nails and yarn, for representing relationships between all 34 club members in an easily relatable way. His first iteration appears below. At first, his Mark I graph seemed rational enough.
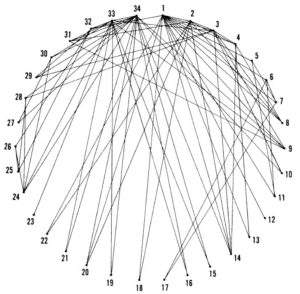
But it wasn’t as practical as it could have been. For one thing, a member’s location in the circle was completely arbitrary. As a result, the lengths of lines representing associations, were meaningless. For example, member #31 was connected with #2 and #9. But far more yarn was required to string together #9 with #31, than was needed for #2 and #31. Neither those length values, nor the distance between them, was informational — had Zachary arranged his members in a square rather than a circle, the graph would have conveyed just as much information, yet the data representing his associations would have appeared quite different.
Zachary tried various approaches. At last, he hit upon a system that could be implemented by a computer algorithm: an adjacency matrix.
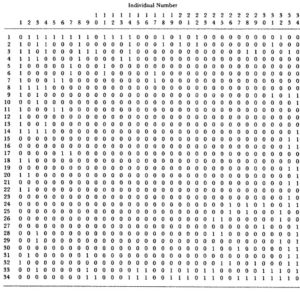
Here, a table of binary digits depicts the presence or absence of associations between each pair of club members. An adjacency matrix is a concept that was informational, and that could be encoded.
The 1985 edition of the textbook Data Structures by Daniel F. Stubbs and Neil W. Webre — published three decades prior to the Neo4j era — had a few words to say about adjacency matrices. Suppose the members of a dataset, like the members of the karate club, were declared as nodes, and defined using an atomic data type (Stubbs and Webre used the Pascal language). The adjacency matrix could be defined within a two-dimensional array variable, whose values could be declared as Boolean. Webre and Stubbs wrote:
The chief drawback to this approach is that it is impossible to insert or delete nodes. Storing descriptive information about a node is also difficult, as is traversing the set of nodes. . . The array nodes are used to store information associated with each node. This approach permits nodes to be deleted and inserted (up to [the size of the graph]), but it requires that elements be shifted around in array nodes in order to correspond to the index value in an array graph.
So you couldn’t evolve a graph without a sophisticated, and perhaps tedious, method of shuffling its contents back to where they belonged in the first place. The authors spent the next few dozen pages demonstrating how this could be accomplished in Pascal. Yet their graphs were confined to placing nodes within semi-arbitrary rows and columns, so that Pascal would know what to shuffle and when.
Zachary’s 1977 treatise on modeling his social network stuck with the adjacency matrix as the best approach for representing connections between nodes. It would take the work of academic researchers following in Zachary’s wake (or perhaps, in this case, his kata steps) to hit upon the optimum solution — more to the point, an approach more applicable to a social network of far greater than 34 people. It begins with the generation of a network graph, just like the kind Neo4j uses for representing graph databases. It then proceeds to use algorithms to generate embeddings — graphs whose information is packed more concisely onto a multiple-axis geometric space.

A demonstration of low-level embeddings using Wayne Zachary’s 1977 social network representation of his local karate club. Produced by the Stanford Network Analysis Project.
In a typical visualization of the karate club graph, explained Neo4j’s Allen, “each person in the graph is represented by a vector in that matrix of 34 numbers. But what if, instead of 34 nodes, we have 34 million nodes? We can’t afford a 34-million-by-34-million matrix.”

Image of Niagara Falls, October 2022 by Scott Fulton
Cascade Effects
Tomaž Bratanič offered this further detail: “Think of the input to the embedding algorithm as the adjacency matrix, which is a square matrix whose numbers of columns and rows are equal to the number of nodes in the graph. [Say] you’re working with a square matrix with one million rows and one million columns. If you want to input that into the most basic machine learning algorithm — for example, Random Forest — one million rows is not a big deal. But building machine learning models with one million features might not be the most efficient way.”
The simple act of adding one row to a one-million node adjacency matrix, or paring one row from that matrix, becomes a Herculean task for a table-oriented database. In addition to the record-keeping chores, for a machine learning model, Bratanič noted, the entire system may need to be retrained.
There are two schools of thought among data scientists around embeddings, added Bratanič: One group is most interested in arranging graphs based on sameness or homophily — the similarities of characteristics between nodes. For a social network, for example, nodes may be clustered or neighbored when the people they represent share greater numbers of perceived properties. An embedding for such a group, he explained, may leverage cosine similarity and Euclidean distance functions to help encode levels of homophily. The closer the nodes’ positioning in the graph, the smaller the cosine similarity variable.
The second group is more interested in the density of adjacent nodes around certain other nodes. These “super-nodes” which appear to have greater affinity to others may denote characteristics that should be followed (for example, celebrities who are members of social networks), even when these super-nodes tend not to follow each other. They also tend to form “bridges” between smaller clusters or communities within the network. “Without them,” said Bratanič, “some parts of the network would be disconnected. When you’re using embeddings to code those nodes in the embedding space, you want those bridges to have similar embeddings as their outputs.”
“Here’s the thing: Normally, machine learning algorithms are looking for patterns in the data you give it,” remarked Neo4j’s David Allen. “Maybe it’s your customers’ ZIP codes, their birthdates, and their spending summaries. ML algos can’t learn about topological patterns for your customers, if you don’t tell them what those patterns are.
“Graph embeddings are a way of feeding an entirely new class of information about the complex system dynamics, into computers,” he continued. “The way the database learns existing patterns and predicts new ones, is actually no different than it’s ever been. Yet it’s improved, because you gave it better info.”
Anti-money-laundering
Take the case of an anti-money-laundering (AML) detection system, which is what JPMorgan Chase is developing. Typical systems utilizing relational, transactional databases are only capable of performing transactional analyses. They can examine particular characteristics of individual records, such as the sizes of money transfers, the IDs of account holders, and the times transfers were initiated. Even the best algorithms, applied against those transactions, have difficulty isolating patterns of concern. Even when they do, it isn’t always clear what that concern is, or should be. Essentially the only way to establish what a pattern of fraud looks like, for a transactional system, is to train the model using pre-established instance of “suspicious behavior” — which is what one team from Oslo’s Norwegian Computing Center have been doing [PDF]. In a recent paper, the Norway team writes:
Supervised learning is generally preferable when data with known outcome/labels are available. For AML that is problematic as, in contrast to other types of financial fraud, a financial institution rarely finds out if a money laundering suspect is actually guilty of crime. We can, however, get around this issue by modelling “suspicious” behaviour instead of actual money laundering.
By “suspicious” in this context, the NCC team is referring to behavior that has been red-flagged before, for one reason or another. Supervised learning requires these principles and patterns to be pre-established. As MedoidAI’s Christina Chrysouli and Antonis Markou wrote for their company blog in October 2021, “Most machine learning algorithms can only operate when all the necessary entity’s characteristics are provided.”
Graph embedding, by contrast, enables an AML to adopt a less supervised or unsupervised approach, where algorithms are capable of detecting patterns that no person has seen heretofore — patterns that show up in the topology of the embedding, and that might have easily appeared in the NCC model had embedding been tried.
For example: “Did five transfers effectively make a bunch of money go in a big circle among a number of accounts? That’s what the embedding could offer,” remarked Allen.
Systemic risk
One other class of functionality brought into the realm of feasibility by graph embedding is systemic risk. As Neo4j sales consultant Joe Depeau explained, at the height of the pandemic, a surprisingly high number of customers came to Neo4j seeking insight on what they called the “supply chain use case.”
“When you dug into that, what it really meant is, they wanted to understand systemic risk in their customer networks,” said Depeau. “As an example, let’s say there’s a travel agency — a big-package travel company. Everyone knew those companies were going to suffer during COVID, because no one could take holidays.”
Knowing the general risk levels for travel and leisure companies would reach historic highs, endangering their very existences, financial and logistics firms reasoned, financial transactions from those companies to other organizations, would subsequently disappear. “Is it a caterer? A cleaning company? A legal firm? An estate agent? Where does their money go?”
Suddenly, visibility became a key virtue. During that time, the UN’s World Tourism Organization projected the global tourism industry could lose as much as one-third of its regular revenue, placing at least 15 percent of tourism jobs at immediate risk of termination. The only data many organizations had to work with, was transactional data managed by relational frameworks. But on a global scale, they would need supercomputers to render projections and forecasts using that data, in enough time to reapportion resources to help financial customers protect themselves from those risks.
“They really wanted to make decisions about how this was going to affect their network,” Depeau told us, “and if they had resources with which they could help some of these companies? Where would they be best applied? In that space, the data science space was really exciting — to start running models, creating embeddings, and predicting whether a particular company was at risk, and how much at risk they were, because of the networks around them.”
As a whole society, as well as a blue rock floating in space, the world faces a multitude of systemic risks. When just one of these crises erupted, organizations realized the tools they were using to model this risk, were inappropriate for any circumstances other than one where the risk level was relatively low — for instance, the 17th century. Now that one risk is subsiding, others are rising, including the tendency for social groups and societies to split themselves apart, over matters that may not be much more complex than that argument at the karate club.
Graph embedding is not, if we’re being honest, artificial intelligence. It’s applied science. It’s up to us intelligent people now, to start applying it.
Discover More about Graph Embeddings
- Graph Embedding for Deep Learning by Flawnson Tong, Towards Data Science
- Watch Your Step: Learning Node Embeddings via Graph Attention [PDF] by researchers from the University of Southern California, in association with Google AI
- Using Graph Embedding Techniques in Process-Oriented Case-Based Reasoning by Maximillian Hoffman and Ralph Bergmann, University of Trier, Germany
Share Article


Explore
Related Articles

SumoDB in Neo4j: Chaining Multiple Graph Algorithms in Snowflake — Part 3