
NODES 2022: Tomaz Bratanic and the Rise of Knowledge Graph Embedding

Head of Developer Organic Marketing, Neo4j AuraDB
7 min read

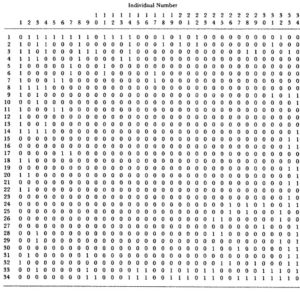
See “Node to Knowledge Graph Embeddings” with author Tomaž Bratanič, live during Neo4j’s NODES 2022 live streaming webcast at 1500 GMT / 11:00 am ET Thursday, November 17. Registration for the 24-hour live, worldwide event is free.
“The special sauce that Neo4j brings,” explained long-time data analyst Tomaž Bratanič, “is how easy it is to construct a graph and transform it in the Neo4j database. Once you have your graph, it takes two lines of Cypher code to produce embeddings.”

A representation of the relationships between data elements constituting Slack messages in a workplace, as conceived by Neo4j’s Niels de Jong and Adam Cowley.
A knowledge graph, as many Neo4j users will be aware, is a representation of concepts and their relationships together in a single visual form. A typical graph may represent the relationships between elements in a data set, in a way that cannot be inferred from mere relations in a database schema. A knowledge graph goes at least one step further: demonstrating the relationships that enable the elements to collectively form a kind of context, whose value exceeds that of the relationships unto themselves. Collectively, you understand something about the information conveyed by a knowledge graph. Because of that, you can represent the types of information that produce knowledge when shared amongst humans, using a knowledge graph.
Graph embedding, meanwhile, is a concept that predates modern databases: the ability to effectively encode much of the information conveyed in complex graphs, by means of a simpler stack of high-precision values, or vectors.
Knowledge graph embedding pairs these two concepts together. This way, extremely complex relationships that encompass multiple collective contexts, may be represented geometrically using a coordinate system, consuming considerably less storage, memory, and most importantly of all, time.
“The most important part is the learning part,” explained Bratanič. “Everybody else wants to avoid manual feature engineering.” Machine learning systems are trained to recognize patterns among various classes of data — in the case of knowledge graphs, to recognize the existence of facts. In supervised learning systems, he told us, that requires a level of manual labor that’s more often defined in dollars than in hours.
“Instead, people designed algorithms that auto-magically construct those vectors.” Those algorithms, he said, take care of many of the hard-labor tasks that supervised learning managers would have to perform manually, such as encoding the values of connections to connections (“two-hop neighbors”), and whether to account for such factors as clustering coefficients. These are measures of the relative density of graphs in given areas, determined by the number of “triples” (three-node connections, or triangles) in those areas.
“You just say, ‘Do your magic,’ without much input,” Bratanič said.
Method Behind the Magic
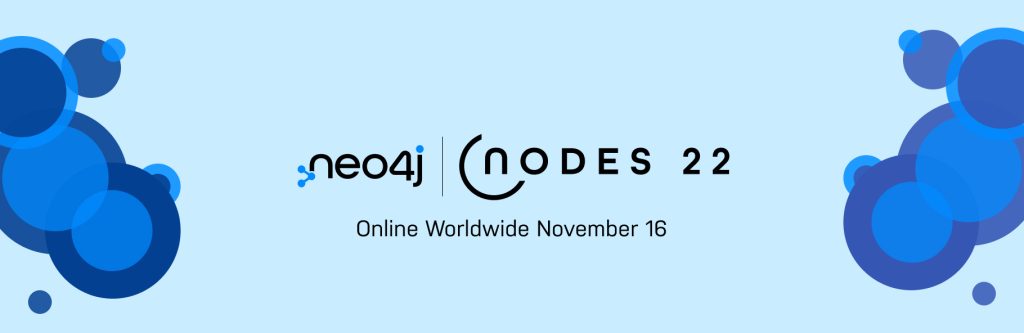
The upshot of graph embedding, including for knowledge graphs, is supposed to be the encoding of information that takes the place of huge adjacency tables. Normally, the sizes of such a table in memory or in storage would equal the number of elements in that table, raised to its own power. The 34-node matrix at left, for example, has 1,156 elements. So you can imagine a million-node matrix would be functionally impossible to navigate, without the aid of a technique such as graph embedding.
But how does a system obtain the vector values for the embedding space, without first creating at least one functionally non-navigable table first?
“Well, sometimes you don’t,” Bratanič admitted. “Sometimes you have to create them, because basically, an adjacency matrix is just a representation of the network. There are many representations of a network. Just by having a graph in your database, you can have an adjacency matrix. It’s not stored that way, but it can be exposed as an adjacency matrix.”
One of the most common algorithms used by Neo4j and others to generate graph embedding vectors from graph adjacency matrices, is Node2vec. Its forebear, created in 2013 and called Word2vec, was created by Google researchers ironically for the purpose that folks today attribute as a derivative of graph embedding: namely, knowledge graphs. As one might easily imagine, Google needs to be capable of inferring relationships between words in a scanned text, without any time being spent in the training supervision process. Google could have used standardized techniques already adapted for neural networking, but it would always be playing catch-up in obtaining values useful enough to be applied in its PageRank algorithm.
In their introductory paper for Word2vec [PDF], the Google team wrote:
We observed that it is possible to train high quality word vectors using very simple model architectures, compared to the popular neural network models (both feedforward and recurrent). Because of the much lower computational complexity, it is possible to compute very accurate high dimensional word vectors from a much larger data set.
As the number of words and word meaning data sets increased linearly, in the Google team’s trials, the difficulty levels for training models on both semantic and syntactic relationships increased only marginally. This continued to be the case even for word sets eclipsing one trillion entries. By contrast, neural network models became exponentially more difficult to train, as the numbers of words increased, largely because of the adjacency matrix traversability problem.
“You can think of text as a simple line graph,” Bratanič told us, “a word followed by another word, followed by another word. A nice, simple line graph. Word2vec knows how to produce embeddings on a line graph. Six years ago, some people at Stanford University came up with Node2vec — a variant of Word2vec that can be used on any types of networks, [which] can have all types of shapes and sizes.”
With both Word2vec and its Node2vec derivative, training involves a graph model that’s treated as a network. A “random walk” process records possible, navigable paths through that network.
“Let’s say you start at node A, and you do six hops (traversals) across the network,” Bratanič continued. “Now you’ve got a sequence of six nodes. You can say this is not a sequence of six nodes, but of six words, like a sentence. Essentially, you start from a network, and you do a couple of random walks across the networks. Those random walks produce those so-called ‘sentences,’ and each sentence consists of a sequence of nodes in the random walk. You just enter that into the original Word2vec algorithm, and you’ve got yourself node embeddings.”
Even though it seems like the applicability of such a process would be limited to purely semantic functions, the data engineer explained, the same process can be applied to any kind of a network where the objective would be to locate and isolate a particular type of relationship. For example, applied to an electrical power grid, the same algorithms used to find similarities between search terms and searched text, could locate stressed power lines and potential points of failure.
“This is where downstream machine learning models come into play,” he continued. “You can take those vector embeddings, and put them into your model to predict whatever you want. It’s not only identifying, but also encoding. That makes it really powerful.”
NODES 2022 is a free, online graph tech conference that will take place live, for over 24 straight hours, beginning November 16. The agenda includes content for time zones around the globe, and is packed full of beginner, intermediate, and advanced content for technologists and graph aficionados. Register for the event now at neo4j.com/nodes-2022.
Share Article


Explore
Related Articles
Mastering Fraud Detection With Temporal Graph Modeling


Text2Cypher Across Languages: Evaluating Foundational Models Beyond English

