📣 Update! Support for MySQL and SQL Server has now been added. It’s now also possible to import into Free, Professional, and Business Critical Instances.
We’re pleased to announce the launch of a significant new import capability in Neo4j Aura. Our new import service allows you to connect to existing data sources, define a graph data model, and initiate a corresponding import job. Getting data into a Neo4j graph and creating the initial data model is often the first step to using knowledge graphs for analysis or developing an application. This new import capability makes it possible to get started with your data very easily, without requiring code to move data into Neo4j.
We’re initially launching with connectivity to PostgreSQL with more RDBMS and cloud data warehouse integrations to follow. Our eventual goal is to allow you to import data from a broad range of data sources. Look for more blog posts covering future sources and read on to take a hands-on look at turning the Chinook dataset from PostgreSQL into a queryable graph.
If you haven’t already, sign into the latest console preview. To follow along with your own data source, all you need is a PostgreSQL database accessible via a public IP address.
Let’s dive in!
Set Up the Data Source
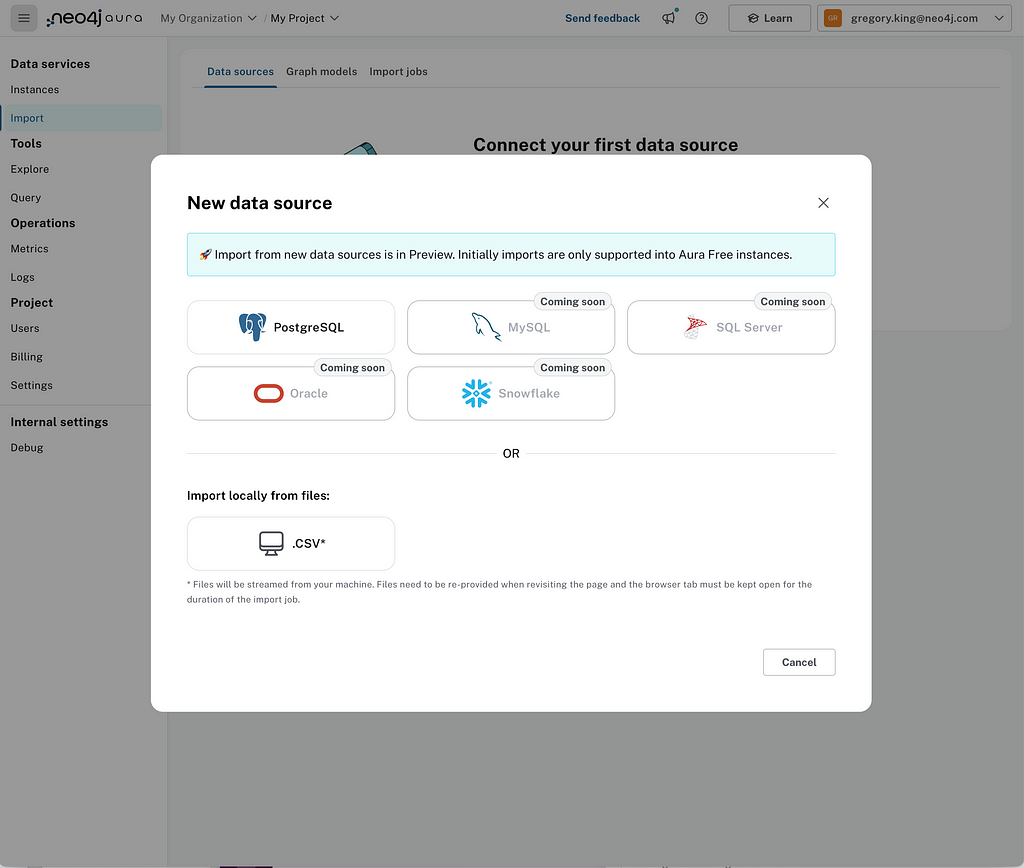
If you’re familiar with the existing import capability in console or its predecessor, Workspace, you’ll be familiar with the ability to import from CSV. This functionality remains, but you’ll now see new data source options, too. We’ll start by selecting PostgreSQL.
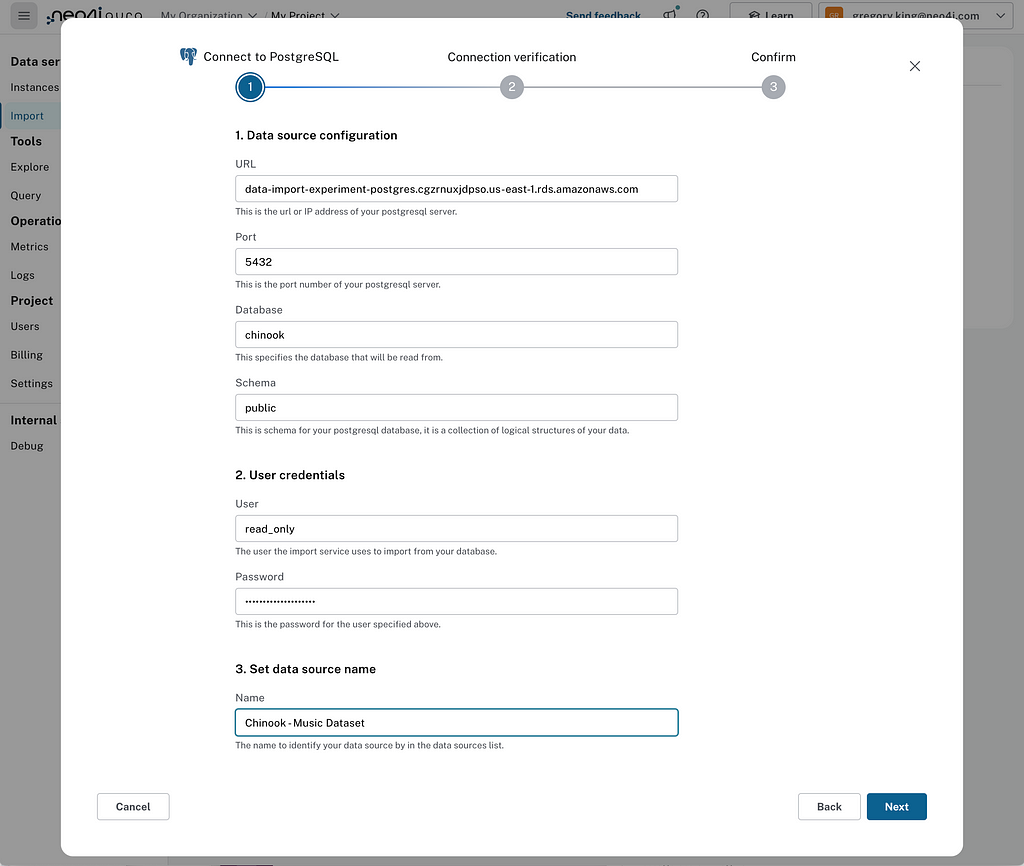
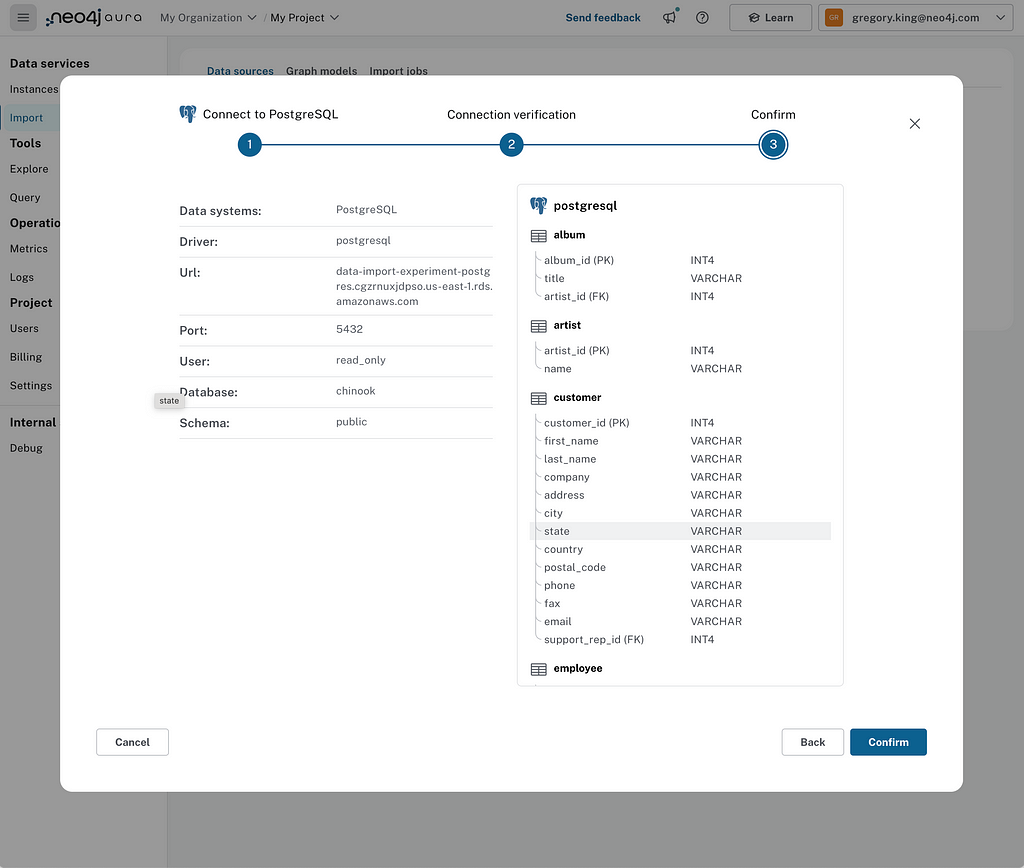
We complete the connection details for the source and give it a name — the data source will be saved for reuse. We’re going to take a look at the Chinook music dataset representing a digital media store. 🎶
Once we’re able to successfully connect to the source, we see a summary of the table schema, allowing us to validate that it’s the data source we intended.
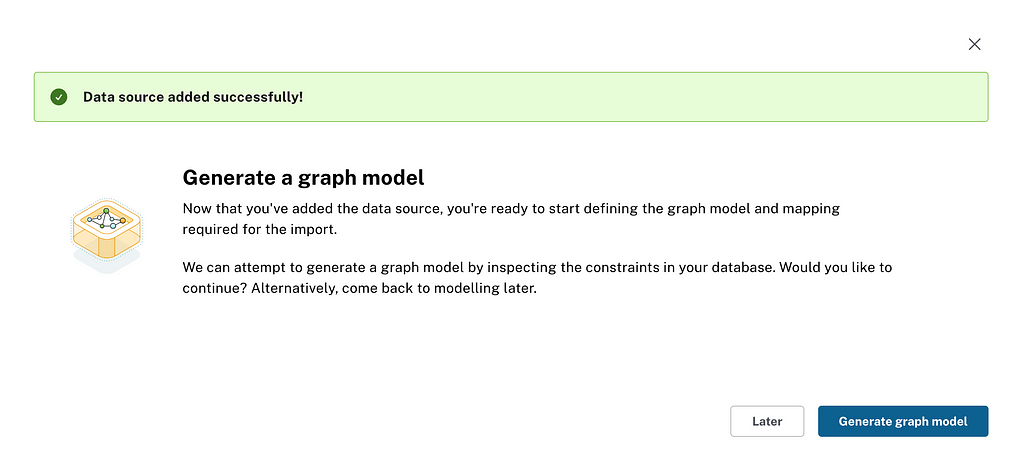
Clicking Confirm saves the data source. At this stage, you’ll be given the recommended option of generating a graph model from the data source. Before loading data into a graph database, you must decide on the graph model and map your data to it accordingly. Here, if available, we use the primary and foreign key constraints in your database to create a starter graph model. Let’s give it a shot.
Generating a Graph Model
The Chinook database is pretty well set up regarding keys, so we get a good starting point. You can see a track towards the model’s center with a linked album and, in turn, the artist. At the top, you’ll also see a “self-relationship” for the employee table, which most likely refers to employee reporting lines. If you look at the panel to the right of the graph model, you can see the reports_to column of the employee table is being used to define this relationship.
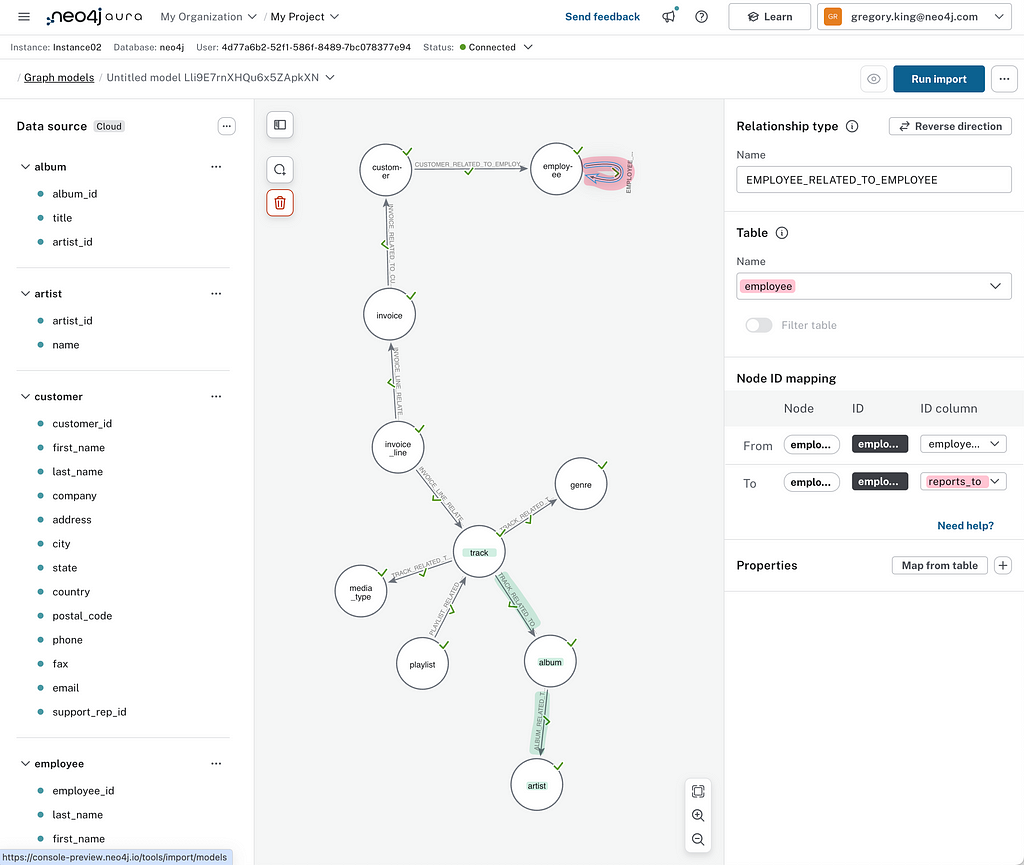
It’s always a good idea to review this candidate graph model to ensure that everything is as expected. On the left, you can see the table schema from the source database, with the blue dots indicating table columns successfully mapped to the graph model. Some items may be unmapped depending on the completeness of key information in the underlying database. Most types that have clear Neo4j type mapping are supported, but custom data types won’t be available. It’s worth reviewing this list and updating the model and mappings as necessary.
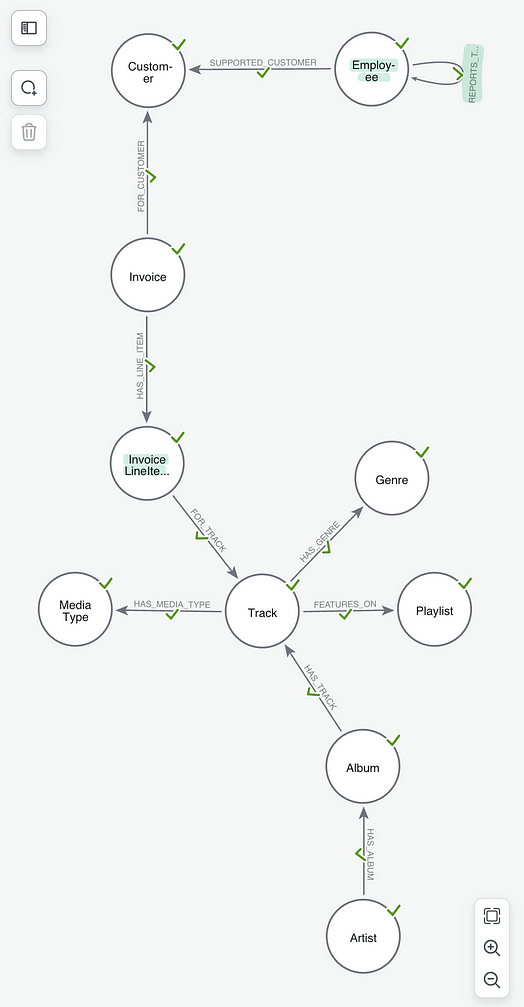
The names assigned to the nodes and relationships are based on the table names; we can tidy these up to make them more meaningful and intuitive in a graph. In Neo4j, we use the following convention:
- NodeLabel: Camel case, beginning with an uppercase character
- RELATIONSHIP_TYPE: Uppercase, using an underscore to separate words
In our model, we’ve changed a node to have the labelInvoiceLineItem and created a REPORTS_TO relationship between Employee nodes. This makes it easier to understand things later when it comes to querying.
Import
With that complete, we’re now ready to run the import job. If you haven’t done so already, create an Aura Free instance to load your data into. Take note of the credentials downloaded on instance creation — you’ll need these to perform the load.
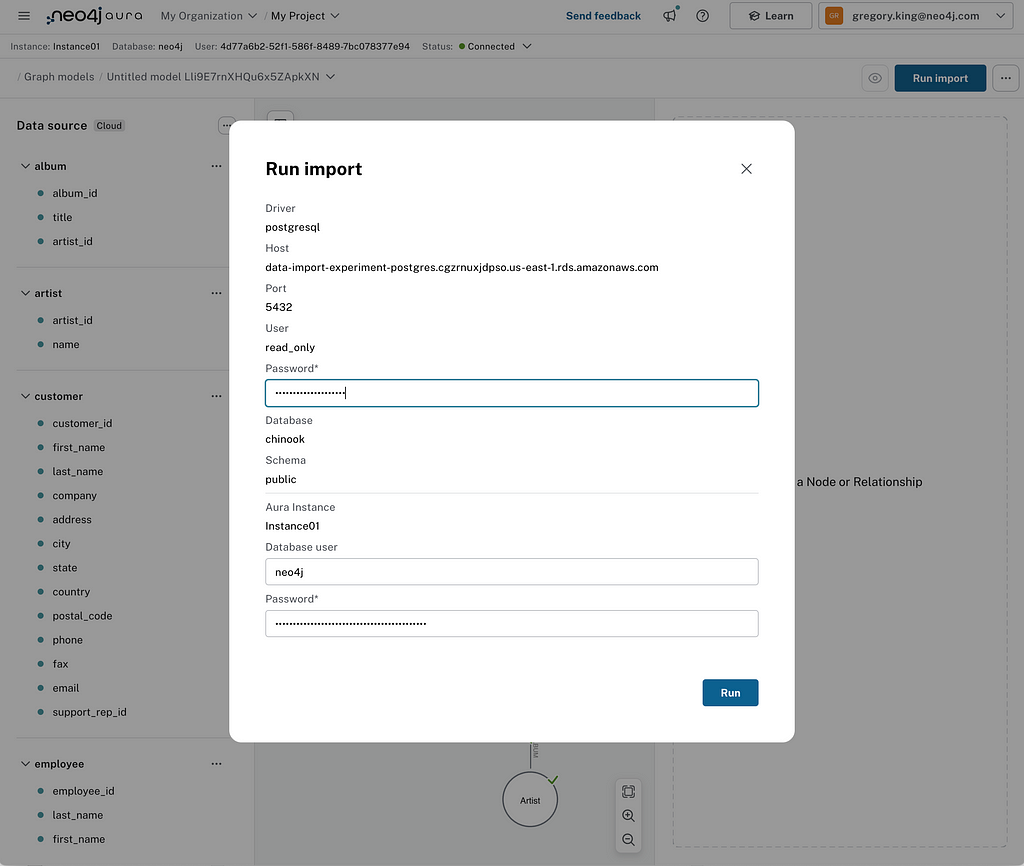
After clicking Run Import, you’ll be prompted to connect to the instance if you aren’t already connected. Then you’ll need to provide the password for your PostgreSQL database and the password for your target Neo4j instance.
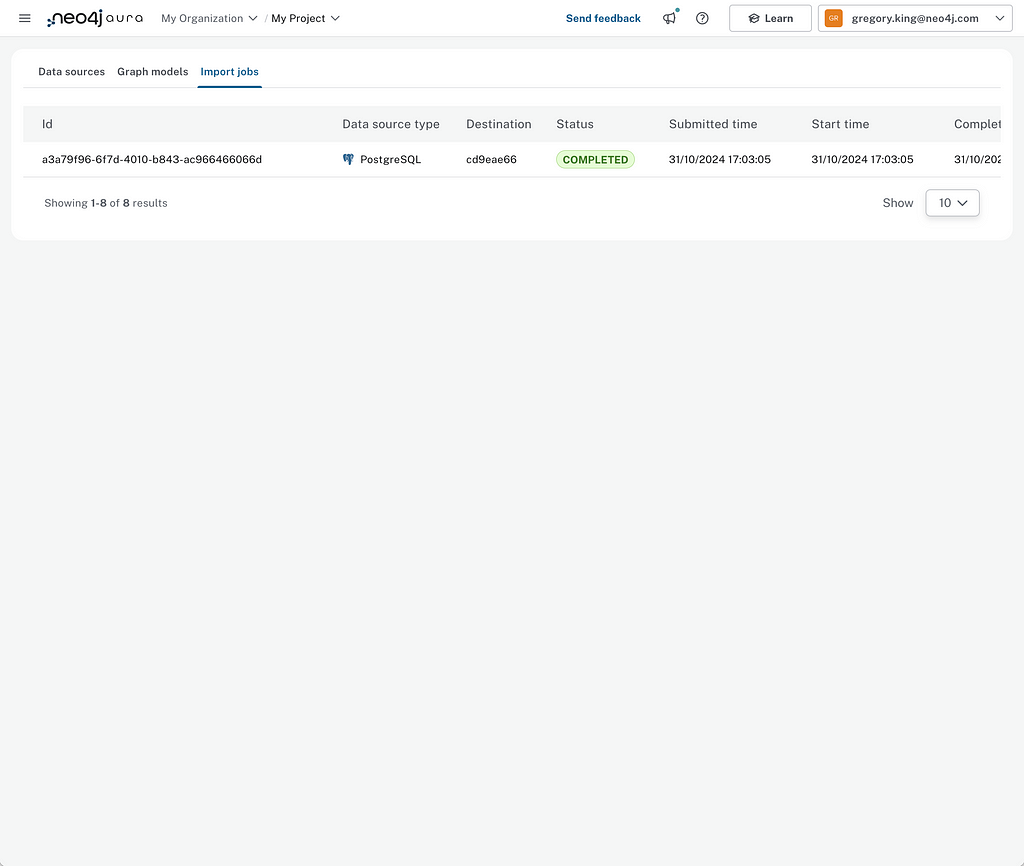
When that’s done, you’ll be sent to the Import Jobs status page to see the status of the import job.
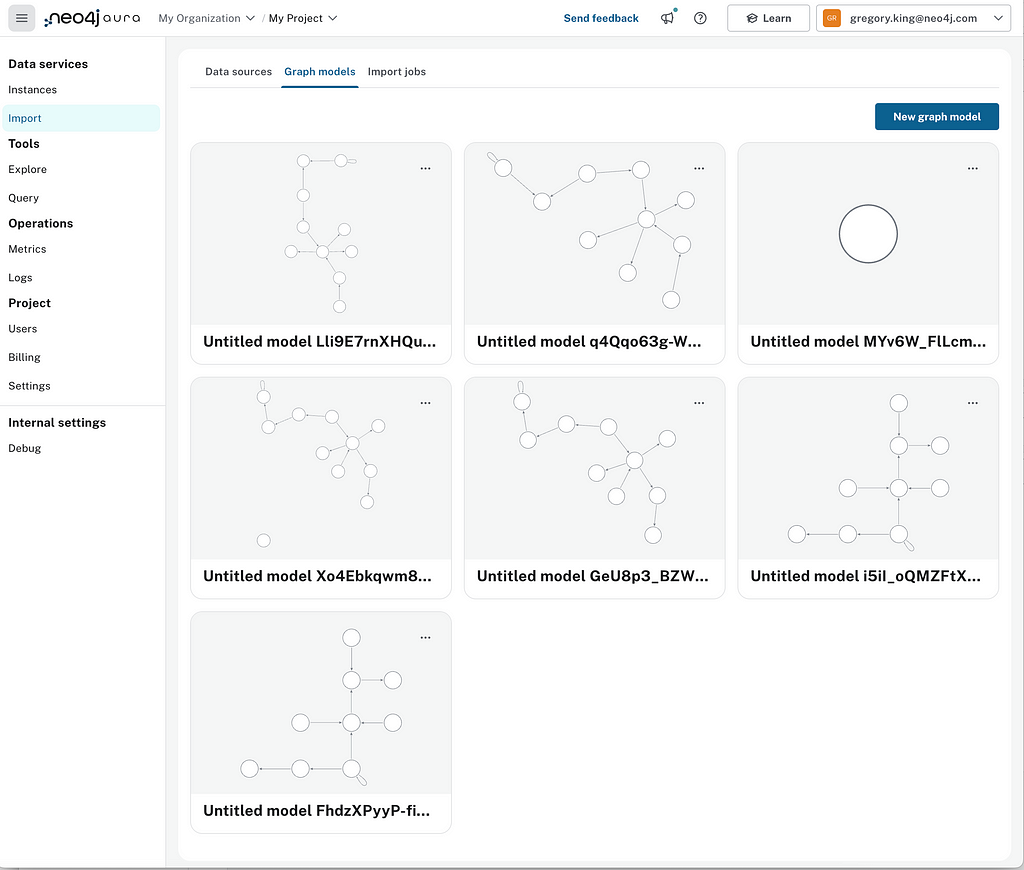
To return to the graph model and mapping created — to rerun an import job, for example — you can find it listed under the Graph Models tab.
Exploration With Co-Pilot
When the import job has been completed (or even while it’s in progress), you can go to the Explore or Query tabs to start interacting with your graph.
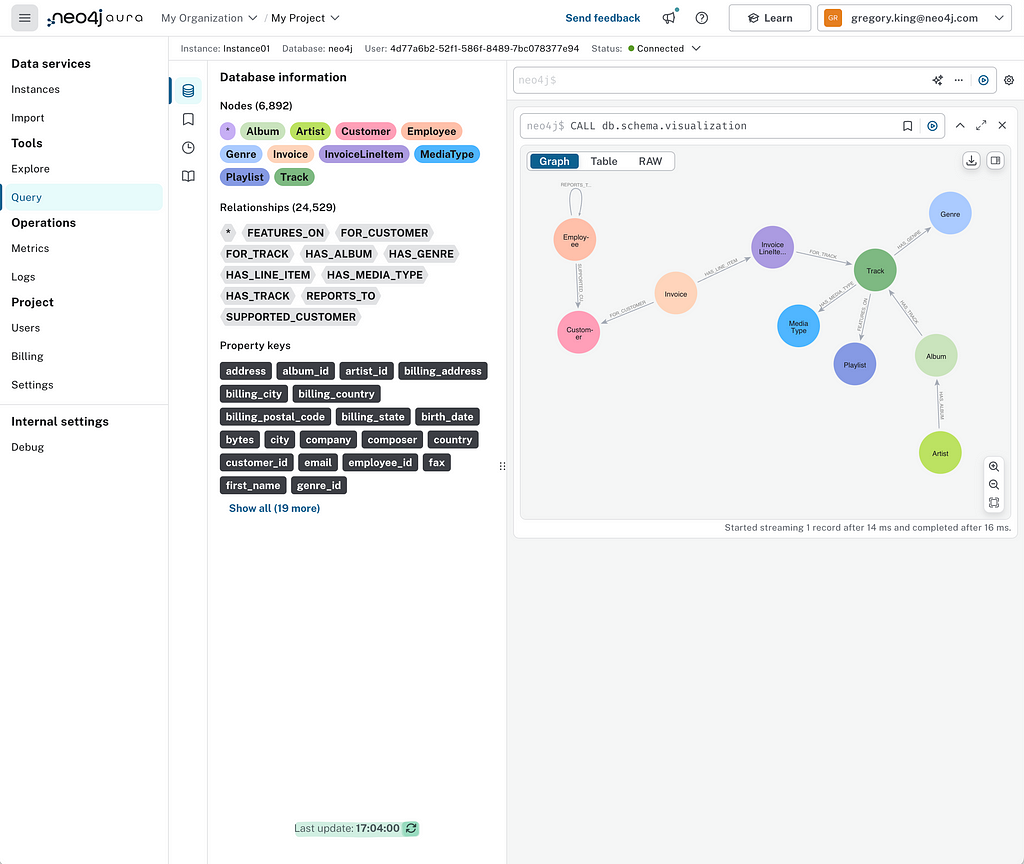
We’ll head over to Query. Clicking the refresh icon at the bottom of the Database Information drawer will give you the latest information about the number of nodes and relationships in your database.
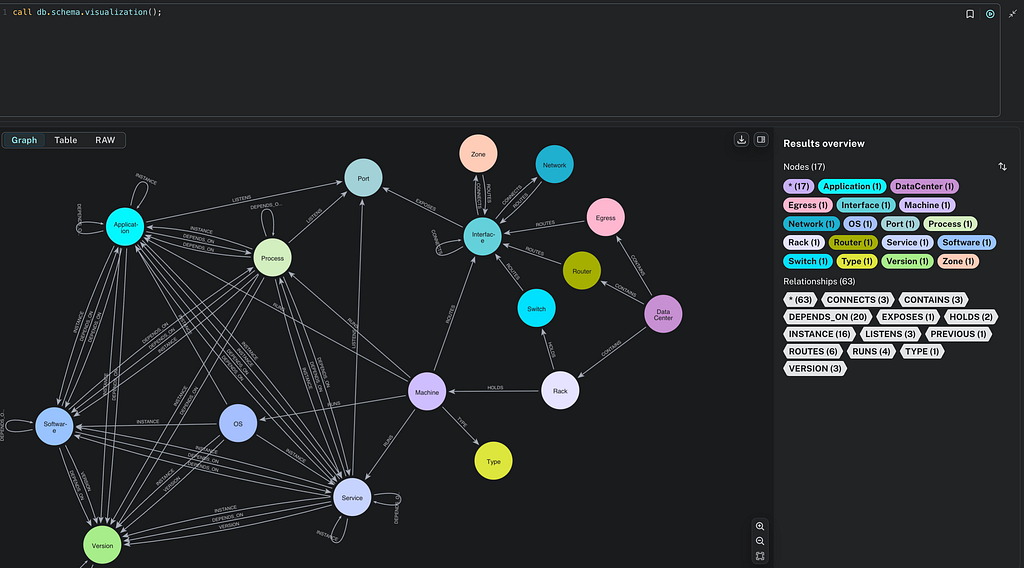
Running the schema visualization procedure, as shown below, shows we’ve successfully loaded data according to the model we created in the import step.
With that done, let’s use the Query co-pilot to see what we can learn about the digital media store in the Chinook dataset.
Which artist has the album with the most tracks?
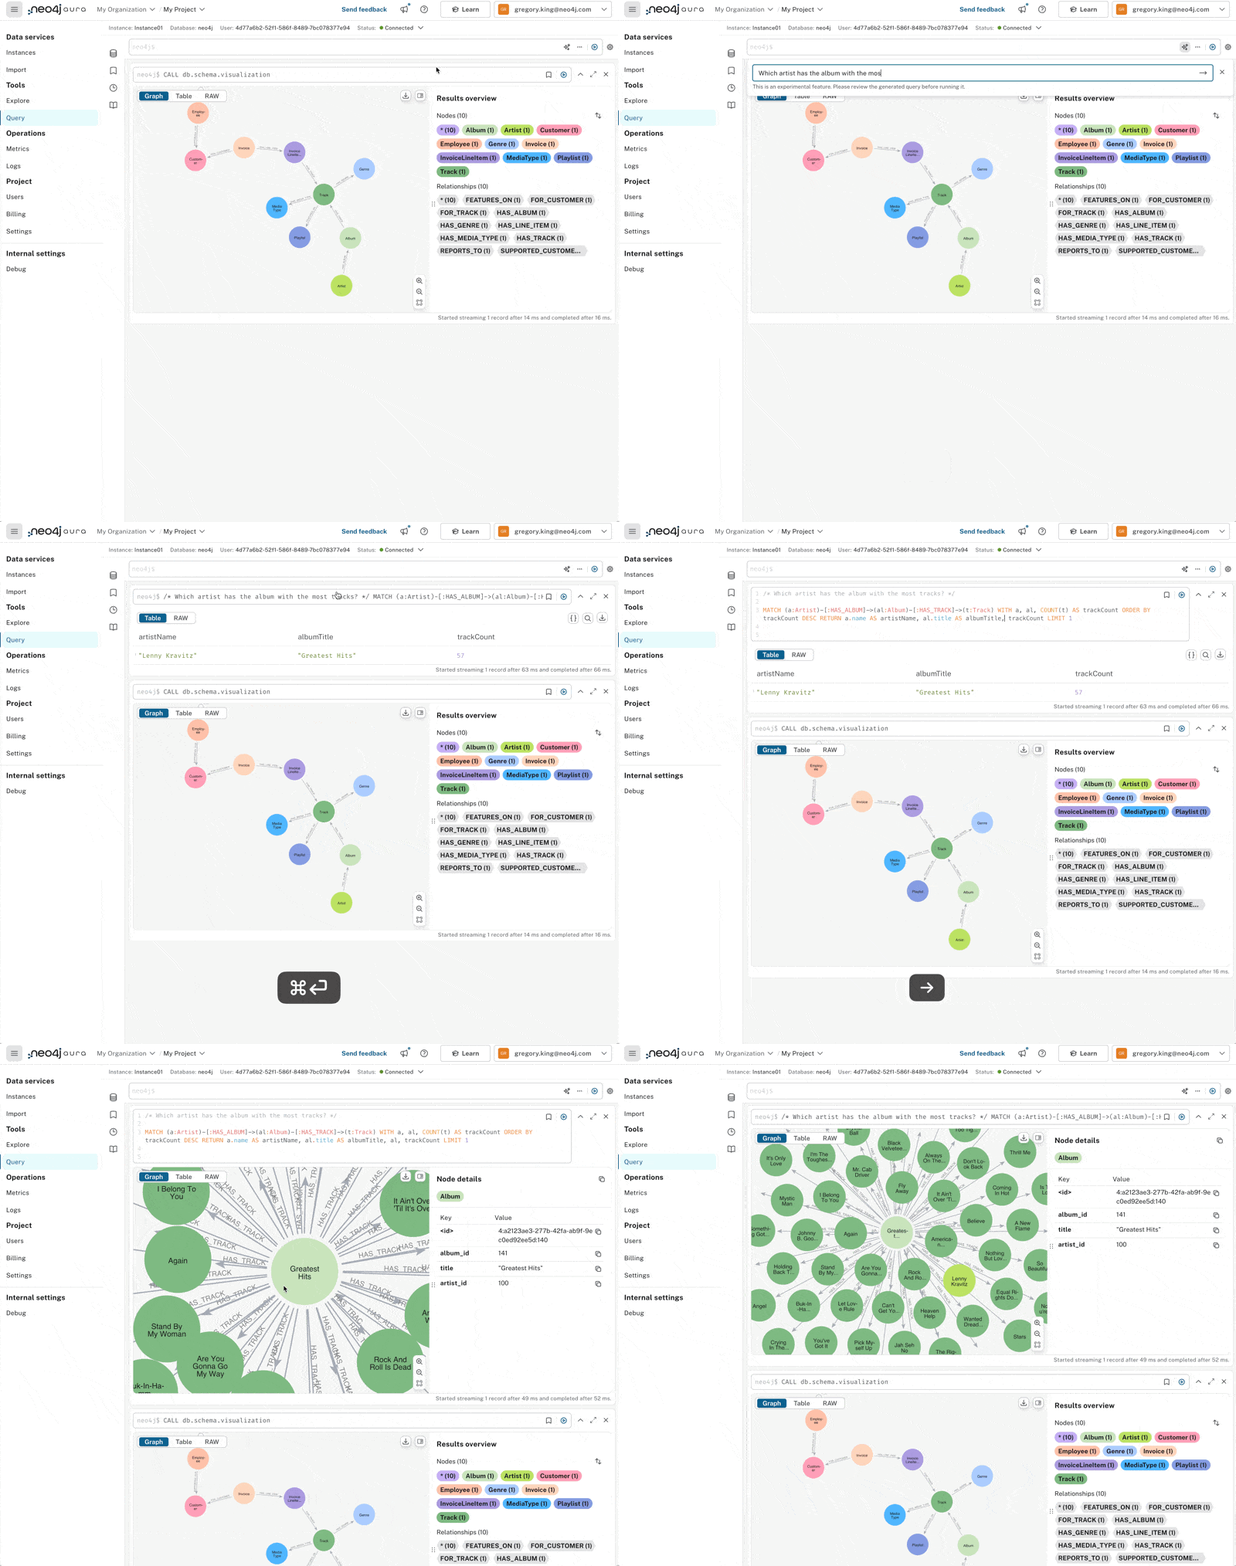
It looks like Lenny Kravitz thinks quite highly of his back catalog, with his “Best of” album featuring a pretty comprehensive 57 tracks! The query helpfully returns the artist’s name, album title, and track count. If we modify it a little, we can return the album node and expand from it to see all the tracks in a graph.
Let’s try something a little more complicated that’ll require stepping through quite a few hops in the graph and doing some aggregation.
Who is the greatest grossing artist by invoice value?
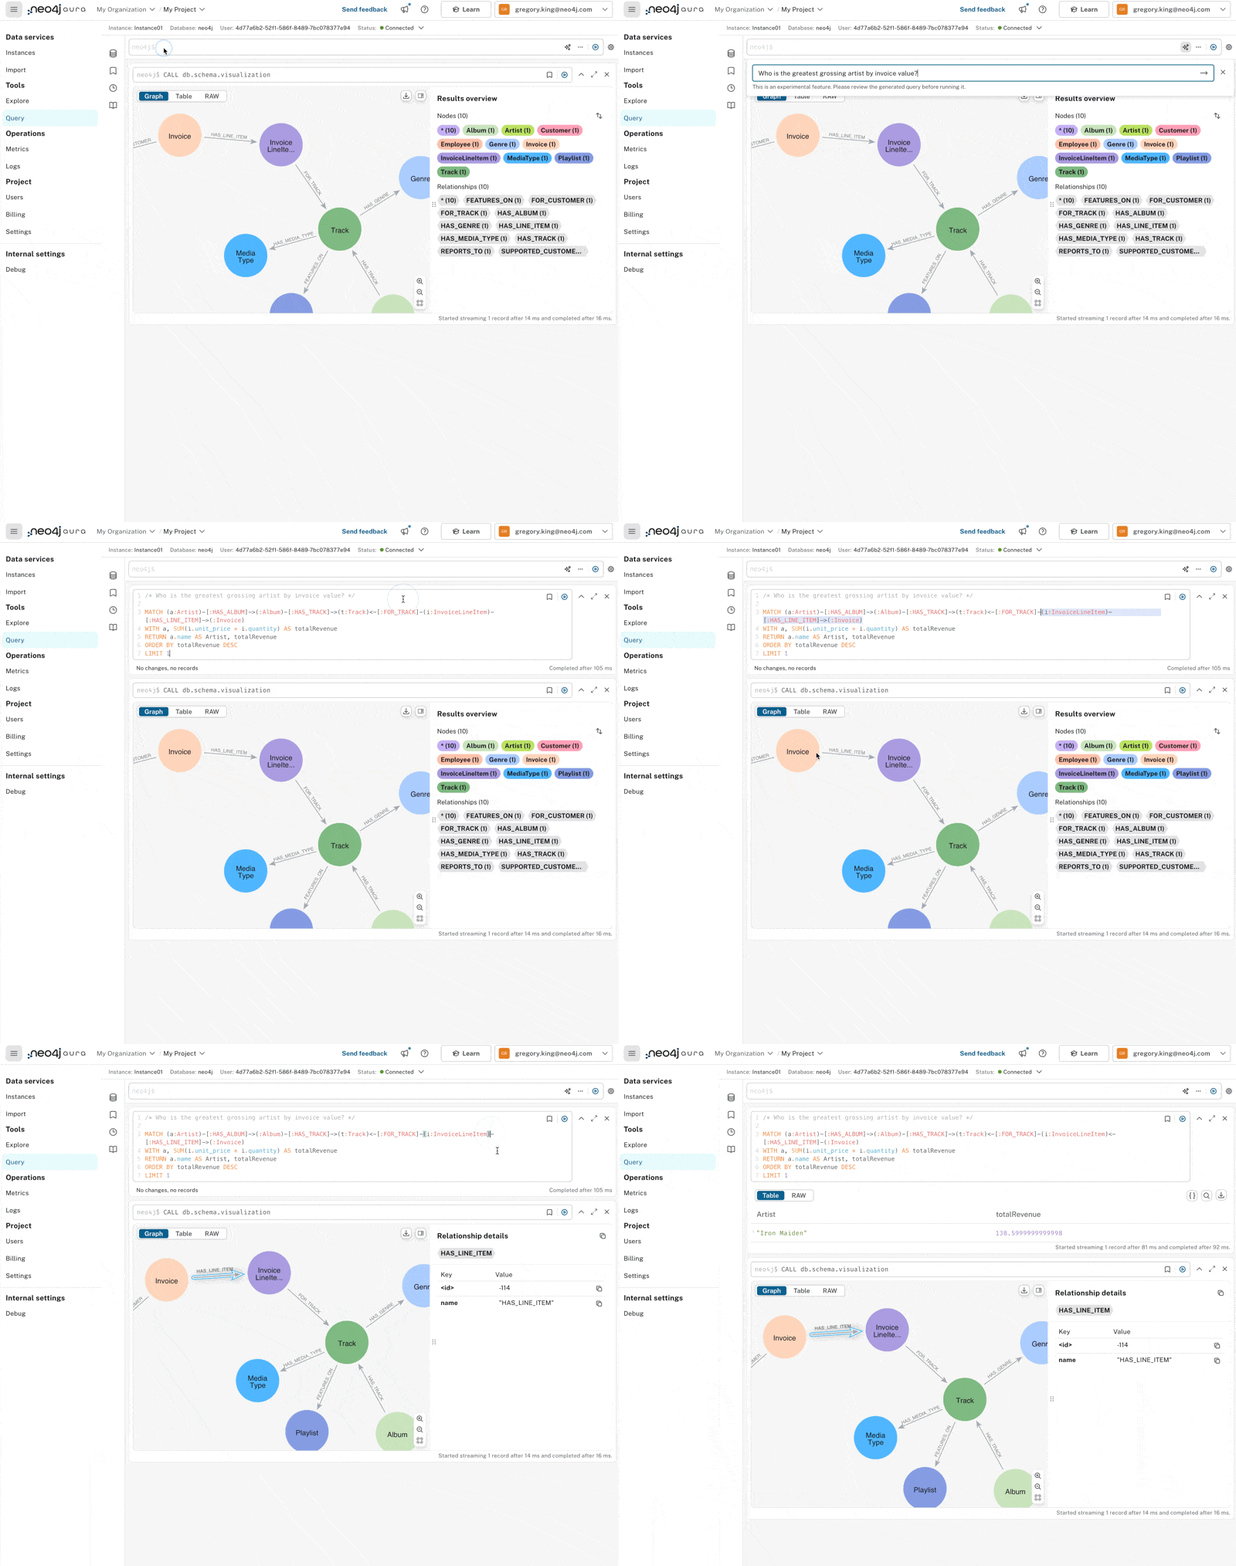
Initially, we don’t get any results; co-pilot generations aren’t always perfect. If we compare the graph pattern with the schema, one of the relationship directions has simply been switched around. Correcting that, we can quickly see that Iron Maiden generates the most revenue.
Let’s see if we can get a bit more color on that.
Show me all the Iron Maiden albums, tracks, invoices and invoice line items
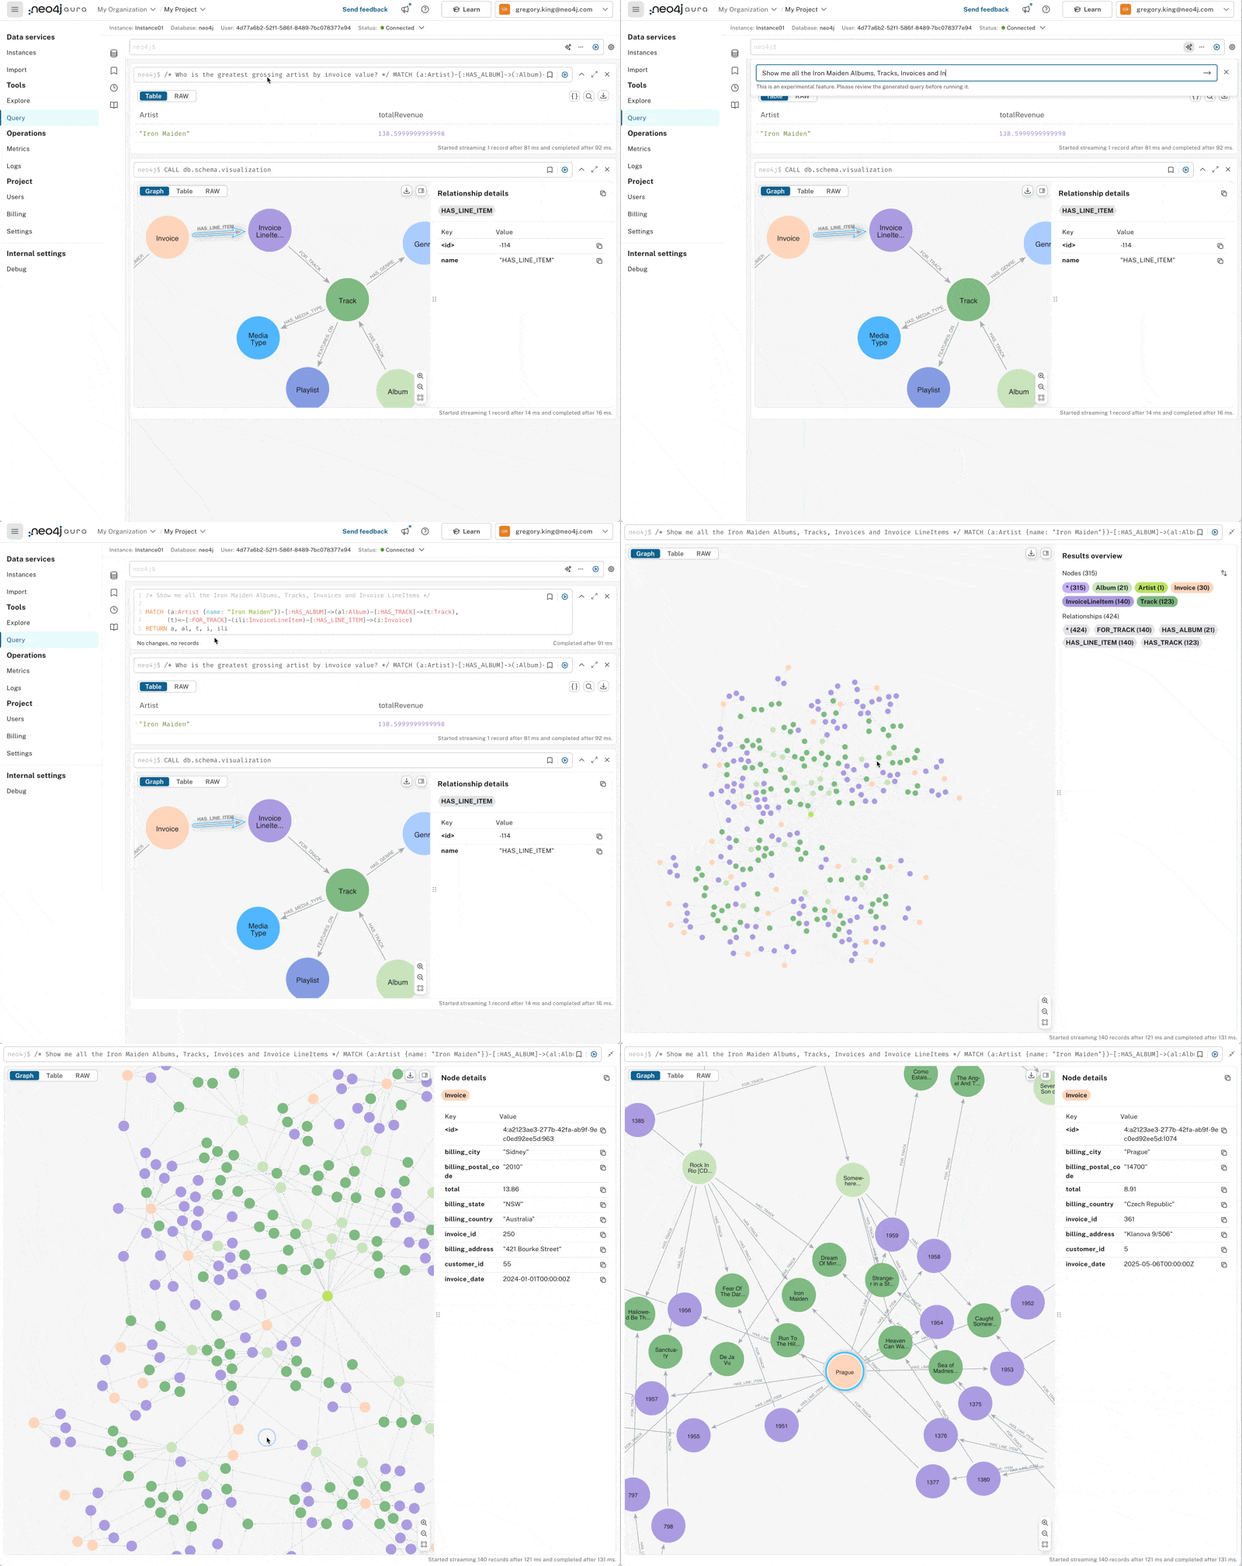
We have to do a little correction here again, but we got all the requested items. If we expand to show all the relationships, we get a nice graph of all the Iron Maiden albums, tracks, and invoice items related to them. Pretty neat!
Hopefully, this little run-through has helped illustrate how you can start with a relational database and get querying with all the benefits of a graph database in next to no time.
If you try it out on your own database and have feedback, please visit https://feedback.neo4j.com/data-importer to share your thoughts.
Thanks for reading!
🐘 Relational Database-to-Graph Querying in Less Than 5 Minutes was originally published in Neo4j Developer Blog on Medium, where people are continuing the conversation by highlighting and responding to this story.
The Developer’s Guide: How to Build a Knowledge Graph
This ebook gives you a step-by-step walkthrough on building your first knowledge graph.


