
Where’s My Neo4j Cypher Query Results?

Senior System Engineer, Neo4j
13 min read

Why a Cypher query run in the Neo4j Browser may not return in a reasonable amount of time, what is happening, and what you can do about it.
Note: The content of this post is relevant to the Neo4j Browser version 4.2.0 as of January, 2021. Your “mileage may vary” as the Neo4j Browser is continually being improved.
The Neo4j Browser is a developer tool, and is the number one interface used to write Cypher queries and interact with a Neo4j database.
The browser delivers an easy to use, metadata supported environment for developing Cypher queries with the interactive, force-directed graph visualization being the most popular output.
The utility of the Neo4j Browser for developers cannot be understated and it will continue to be the main development interface for Neo4j users.
It has query history, saving favorites, multi-statement execution, a variety of output formats, browser guides available through the :play command, and is continuously being improved (hint: check out the :edit command if you haven’t already). You can check out the user interface guide here.
The majority of Cypher queries run in the Neo4j Browser have no issues displaying an interactive graph visualization. Unfortunately, there are times when queries run through the Neo4j Browser start “taking a long time to run” and frustration builds while looking at the spinning dots as shown in figure 2.
This situation is where performance and utility can unknowingly be at cross purposes.
Neo4j users often equate the time it takes for the graph visualization or rendering of results of a Cypher query in the Neo4j Browser to database query performance.
At first glance, this is a perfectly reasonable assumption. The reality is that it can be the rendering of the query results that is taking time, not the query execution.
Assuming that the query response time is measured by when the visualization is produced can result in potentially invalid and costly conclusions, such as “I must re-write my query and / or restructure my database”.
The goal of this post is to provide Neo4j Browser users with ways to determine if it’s a query’s performance or if the visualization that is the culprit when query execution seems slow, and what other options exist.
The workflow is very simple:
- Determine if it’s the Neo4j Browser or the query execution that is keeping a visualization from being displayed.
- If Neo4j Browser visualization is the bottleneck, then try different query techniques and / or a different tool.
- Investigate why the query is slow to return if it’s not the visualization.
What the post does not take into consideration the larger context of concurrency, resource and database utilization, or query design. That’s a much bigger topic!
The Neo4j Browser and What It’s Doing
50 Nodes -> 70 Relationship: “Arrgh! Query!!! 🙀” vs. “Yeah! Query!!! 😺”
What Is the Neo4j Browser Graph Visualization Really Displaying?
Let’s use a simple acyclic graph structure to illustrate how even a small set of data can result in a significant amount of processing needed for visualization. The example graph consists of nodes with a :Node label, that are related to each other by a :PARENT_OF relationship, each with a unique node_id field.

The graph is intentionally small, containing only 50 :Node labeled nodes, and 70 :PARENT_OF relationships. It was generated using a Neo4j apoc procedure that generates a random graph using the Erdos-Renyi model. The schema visualization is shown in figure 3 , and the source Cypher statements are on github.
Why so small? To illustrate how even a small number of nodes and relationships can have a large number of unique paths through the graph.
The number of unique paths is not a problem unto itself, but can have an impact on the Neo4j Browser graph visualization that is not obvious.
Neo4j Browser can take a long time to render information, because what it draws and what the query results are can be different.
Figure 4 shows the visual output of the the one and two hop :PARENT_OF relationship traversals between :Node nodes using the query MATCH paths=(:Node)-[:PARENT_OF*1..2]->() RETURN paths. Here’s where the flattened, interactive visual output of the Neo4j Browser can be misinterpreted.
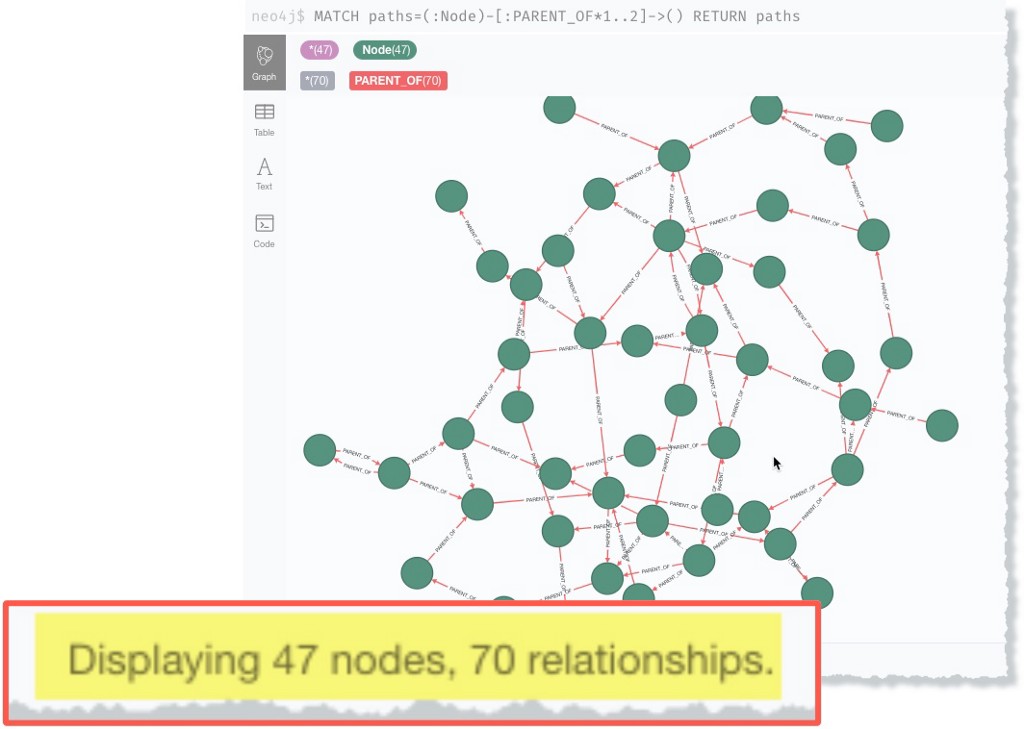
Figure 4 shows 47 nodes and 70 relationships displayed, but running a path count query MATCH paths=(:Node)-[:PARENT_OF*1..2]->() RETURN count(path) returns 170 paths.
Why the Discrepancy Between What’s Visualized and the Underlying Dataset It Represents?
The Neo4j Browser transforms the multi-dimensional overlapping path data into a 2D visual. The visualization is very useful for exploring query results with the unfortunate potential side effect of obscuring the actual amount of data returned. (see “The Graph Database Chronicles Episode 1” for a deeper discussion if this seems strange to you).
Graph Database Chronicles Episode I
The 50 node / 70 relationship example graph has a total of 5,673 unique paths. A visualization of all the unique paths is not much different from figure 4, but the underlying data is approximately a 3,000% increase over the 170 one and two hop traversal query paths.
The query MATCH path=(:Node)-[:PARENT_OF*]->() RETURN path illustrates returning all the paths for any number of traversals. Running this in the Neo4j Browser would result in the figure 2 spinning dots. Not to worry!
Turns out that the query is not the issue.
Think about your query carefully. Do you want a picture of that data? Are you sure that rendering that visually is a useful thing to do?
Neo4j Browser’s greatest strength (easy visualization) is also it’s greatest weakness. It simply isn’t the case that visualizing results is the first thing you should do always.
This could be your inner monologue:
⁉️ This is a good time for a reality check. It should be asked what the query is trying to accomplish and will the visualization add any value, or is it just eye candy? 👀
For this example it would be hard to come up with valid reason for needing a flattened visualization of 5,673 unique paths.
“But wait! I am looking for unrecognized patterns in my graph!” is a common quick response. A flattened force-directed layout is not going to give you this.
What’s really being asked for is the ability to find patterns based on the shape of the data in the graph.
Three Simple Ways to Fetermine If the Neo4j Browser Graph Visualization Rendering is Masquerading As a Performance Issue
1. The count() test.
Using the Cypher count() aggregation can be a an easy test to understand how much data a query is returning and getting an idea of the query performance characteristics. Running a Cypher query
MATCH path=(:Node)-[:PARENT_OF*]->() RETURN count(path)
to count the number of paths rows in figure 5:
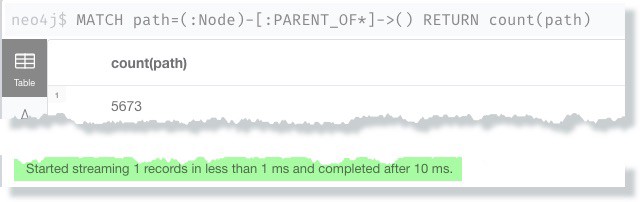
Notice two things:
- The number of paths can be significant. In my case there are 5,673 unique paths through the database even though there are only 50 nodes and 70 relationships in the graph.
- The query starts streaming results in 1ms and completes after 10ms.
The aggregation avoids having to return and render the interactive graph visualization. There’s no fun force-directed layout visual (which is of dubious value in this use case), but at least it is known that it’s not the query execution itself that’s the performance issue here.
The 5,673 unique paths in my example graph represents a combination of all paths. This is often not what a user wants and is an example of how the graph visualization can obscure the underlying data.
This post is focusing on when intentionally or not, a query returns more data than is reasonable for the Neo4j Browser to process. Why there’s 5,673 paths returned and why this may not be obvious is a topic for another discussion.
2. Use the PROFILE query directive to avoid the default force-directed visual layout.
Using the PROFILE directive will show how the query was executed, the processing time and show the query execution steps as the initial output, avoiding the default graph visualization step (until you click on the visualization tab).
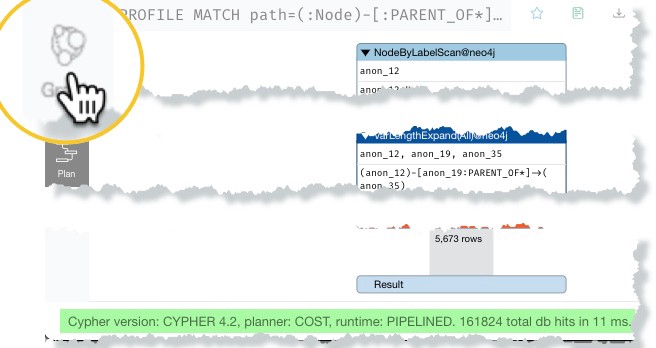
To see this in action, run the all paths query with the PROFILE command:
PROFILE MATCH paths=(:Node)-[:PARENT_OF*]->() RETURN paths
which shows the query executing in 11ms as shown in figure 6 below.
If you then click on the graph visualization icon as shown in figure 7, you’ll likely end up waiting for the visualization to render as in figure 2. The Neo4j Browser might have to be closed and reopened to continue on, because your web-browser’s JavaScript engine ran out of memory.

Consider using the approaches for working with the data in the following “Options” section if the PROFILE command returns in a reasonable amount of time but takes too long to visualize as a graph. If PROFILE does not return in a reasonable amount of time, then it’s likely the query execution that is the culprit.
Try running the query with EXPLAIN directive to see the expected query execution plan. Either optimize the query structure from there, or the consider steps similar to those discussed in the “It is the query” section below.
3. Use a LIMIT clause in your query, or reduce number of paths traversed.
This approach is useful for minimizing the results returned, allowing for the graph visualization to be displayed in the Neo4j Browser. This is not always appropriate as it changes the query.
A LIMIT is simply added to the query:
MATCH path=(:Node)-[:PARENT_OF*]->() RETURN path LIMIT 200
While changing the path length from 1 to 3 hops is accomplished by:
MATCH path=(:Node)-[:PARENT_OF*1..3]->() RETURN path
This obviously is a trial-and-error approach that sometimes elicits interesting observations that can change the premise of the original query.
Of course you can combine both to minimize even more.
Options: Neo4j Browser Visualization Is the “Performance” Culprit
What Are My Options If I Want to Work with the Big Old Dataset Returned by the Cypher Query?
1. Use cypher-shell
A simple to use command line utility for running Cypher queries, cypher-shell works with all Neo4j editions.
cypher-shell query results have rudimentary formatting that need very little processing to create the final output. I often use it from within the Sublime Text Editor when developing Cypher queries¹. This is useful when I have a series of disjoint statements (e.g. create data, indexes, match, merge, etc.) to run in sequence, or I want to use git as a repository for my queries.
You can find cypher-shell in the Neo4j install location bin subdirectory, or it can be installed standalone (see Cypher Shell section of the Neo4j Downloads page).
Running cypher-shell in a terminal window launched from the Neo4j Desktop on a Macbook is in figure 8. It is the same process for Windows.
👉 Using cypher-shell with the–format plain option is one of the fastest ways to return query data and execution metrics without writing your own code. Output can be saved to a file or piped through a pager for a better user experience.
Cypher Shell – Operations Manual
2. Use Neo4j Bloom
Neo4j Bloom is a graph visualization tool designed for end-users and analysts. Bloom users navigate and query the graph without having to write Cypher, while being able to visualize a much larger set of data than is possible in the Neo4j Browser.
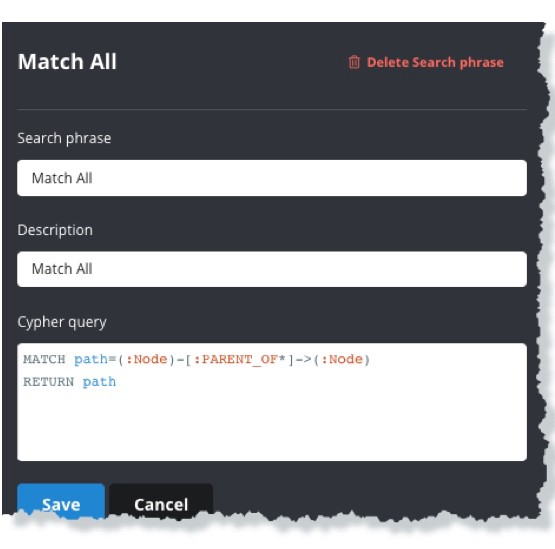
How does that help in this scenario where we want to see the output of a Cypher statement? Bloom allows for Cypher queries to be created and parameterized for use within the interface by creating a custom search phrase (figure 9). We can then execute the query that was problematic for the Neo4j Browser to see the visualization Bloom.
Caveat with Neo4j Bloom. Neo4j Bloom requires the Enterprise version of the Neo4j database and does not work with the Neo4j Community Edition. Neo4j Bloom also works best with a dedicated GPU. Those relying on their CPU for graphics rendering may have a poor experience. Users can use Neo4j Bloom in several ways:
- Through the Neo4j Desktop. A single user Bloom installation is included with the Neo4j Desktop. Databases created from within the Neo4j Desktop run a free Developer License of the Neo4j Enterprise Edition.
- Through Neo4j Aura, all Neo4j Aura instances come with Bloom enabled out of the box.
- Through Neo4j Sandbox, which also has a single-click Bloom integration
- Through an Neo4j Enterprise Edition database installation. This requires Neo4j Bloom to be installed on the server and a Bloom activation key.
It Is the Query Afterall! What to Do If the Cypher Query Is Not Performing as Wanted?
✏️ That Is a Big Subject! ☯
A single blog post could never even begin to address the subject of the yin and yang of query and database performance. There’s just too much to cover and too many variables. Given that, here are some hints and tips to keep in mind and resources to help out:
- Check your schema
- Monitor your database
- Get help from the community
- The YANGI principle
- Do you have a graph problem?
Check Your Schema
Like any database, the design and how well queries are written can affect performance. The good news is that being “schema-less”, it is very easy to provide multiple graph models in a single Neo4j database to meet different query requirements.
The twist is understanding when and how to create an efficient graph model and queries. Fortunately there’s an incredible number of resources to help Neo4j developers and users. There’s a quick introduction to modeling in the Neo4j Developer documentation, and the no charge online courses from Neo4j Graph Academy. These courses cover Cypher basics, thru advanced query writing and optimization, to database design and administration, etc.
Monitoring
Remember that the Neo4j graph database is a database. Even though Neo4j is a very efficient graph database, the universal database resource trifecta of RAM, CPU and I/O still apply and are constrained by concurrent usage.
You can’t fix what you can’t see, and there are many ways to monitor the resource usage of the Neo4j database and queries. The Halin monitoring tool developed by Neo4j Labs that is available as a GraphApp in the Neo4j Desktop or standalone from halin.graphapp.io is one of the easiest monitoring tools to start with.
Halin – Neo4j Monitoring Tool – Neo4j Labs
The Neo4j Operations Manual covers production monitoring of database and system metrics
Monitoring – Operations Manual
Get Help from the Community
The Neo4j Community web site is a wonderful resource to ask specific questions and take advantage of the collective knowledge of the vast Neo4j user community. I will often go to neo4j.community.com for ideas when I’m trying to solve a problem, or am looking for new approaches to writing a complex Cypher pattern. Good chance that whatever it is you’re asking has already been addressed. On a side note, the Neo4j Community’s “This Week in Neo4j” and “Featured Community Member” often presents interesting user provided graph use case examples and real world projects using new approaches and technologies. I would have completely missed the “Using Neo4j withPySpark on Databricks” post if I wasn’t a member of the Neo4j community.
The YAGNI Principle
Follow the YagNI (You ain’t gonna Need It) principle and good graph data modeling techniques.
A generalized query will return all the properties for each node and relationship to Neo4j Browser for rendering. If every node in our example graph had 512K of property data, that would be ~3MB of data being returned to the Neo4j Browser for displayed in the property value box.
That’s a lot of memory and CPU being used just in case a user clicks or hovers on an individual node or relationship visualization to see the property data.
Having node properties available in a visualization is what you’d expect, but there’s only so much you can really load into our web based Neo4j Browser.
Not only is an unreasonable number of properties a stressor for the Neo4j Browser, but it can indicate an underdeveloped graph model. See this series of blog posts for a quick introduction to modeling concepts and how a good model that is easier to understand and query will avoid this scenario.
Graph Data Modeling: Categorical Variables
Do You Have a Graph Problem?
This should be obvious, but be sure you have a graph use case! It is so much fun and easy working with a Neo4j graph database that it is easy to try and apply it to scenarios where graph does not add any value. Watch this short video for a good introduction on identifying graph shaped problems
Parting Thoughts. Yours and Mine.
Thank you for your time if you made this far. Please post any questions or comments as I am very interested in what readers think and am hoping to gain insight from any responses.
¹ More on the Sublime Text editor and cypher-shell coming in another blog post.
Where’s My Neo4j Cypher Query Results? 😠 ⚡️ ⁉️ was originally published in Neo4j Developer Blog on Medium, where people are continuing the conversation by highlighting and responding to this story.
Share Article


Explore
Related Articles


How to Improve Multi-Hop Reasoning With Knowledge Graphs and LLMs
