IT Service Graph
1. Introduction
Medium to large organisations have to support, operate and maintain large to huge IT environments with hundreds or even thousands of internal and external customer services. These environments are highly complex and full of dependencies between IT infrastructure, software, services, customers, service levels, providers, and many more. Applications are used to collect and maintain information about the environments in order to support operating them. However, those solutions are mostly dedicated to only a portion of the above-mentioned entities in an IT environment, and important relations between entities are sparsely available if they exist at all.
2. Scenario
Service downtime may lead to significant problems for an organisation and critical business problems, ranging from degradation of the company’s reputation and/or credibility to revenue loss due to downtime of critical revenue-supporting applications.
Hence, understanding all relationships and the possible cost of downtime in medium to large enterprises is critical. Monitoring and analysing relationships between infrastructure, software, services and users/customers will enable companies to understand the most critical entities in their IT Services landscape and take action to build resilience into those parts to mitigate outages. This will help to increase uptime and reduce negative impact on the companies’ revenue driving services in case of failures.
The applications mentioned in the introduction handle most of the data required to analyse an IT Services environment. Still, data is spread into several buckets, such as CMDBs, Service monitoring tools, case management systems, and often self-written applications. A company growing through acquisitions introduces an additional layer of complexity with even more different solutions to operating IT services.
3. Solution
Neo4j is an advanced graph database that is highly effective at connecting data from various data sources to make sense of it and provide business value. An IT services knowledge graph will greatly support the IT organisation in analysing and understanding the complex landscape of infrastructure, services, software, customers, SLAs, and many other entities in such environments.
3.1. How Graph Databases Can Help?
Implementing Neo4j can help execute analyses that were not previously possible. Examples of the scenarios are:
-
Service Chain Analysis: Neo4j enables efficient link analysis to explore connections among objects in the IT Landscape that are connected to each other. Providing information about the complete service chain from the user/customer down to the location (rack) of the server instance running the service plus all connected objects in-between like service, software, data stores, contractual information and customer attributes.
-
Service Impact Analysis and Simulation: Analysis or simulation of a service impact that shows the possible damage of a service failure from different angles like a service failure, a software issue/bug or just a server failure with the possible associated cost of the outage.
-
Real-time: Neo4j also enables real-time analysis of service failures and their impact, including root cause analysis of current revenue loss. It also enables companies to extend the knowledge graph with additional mitigation strategies for service personnel.
4. Modelling
This section will show examples of Cypher queries on an example IT Service Graph. The intention is to illustrate what the queries look like and provide a guide on how to structure your data in a real setting. We will do this on a small graph of several nodes. The example graph will be based on the data model below:
4.1. Data Model
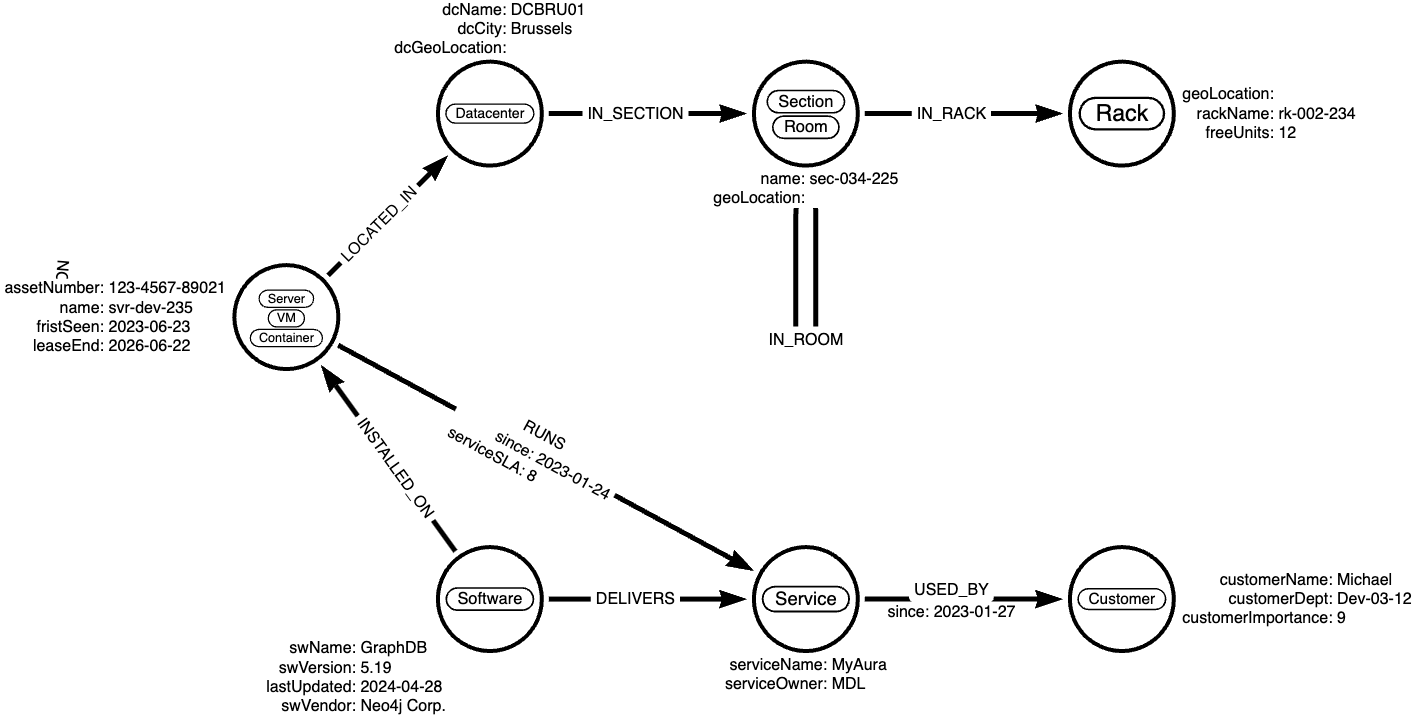
4.1.1. Required Fields
Below are the fields required to get started:
Server Node:
-
name: Contains the name of the server/VM or container. It needs to be a unique name amongst all server objects.
Datacenter Node:
-
dcName: That’s the hosting datacenter whereServer/VM/Containeris hosted. It should be a unique name, too.
Section/Room Node:
-
name: Contains the name of the section or room located in the datacenter with theDatacenter.
Rack Node:
-
rackName: Contains the name of the rack that is deployed in the relatedSectionorRoom.
Software Node:
-
swName: Contains the name of the software installed on the relatedServer/VM/Container.
Service Node:
-
serviceName: Contains the name of the service that uses theSoftwareand runs on a particularServer.
Customer Node:
-
customerName: Contains the customer’s name using theService.
The above is the minimum information to start querying the graph.
4.2. Demo Data
The following Cypher statement will create the example graph in the Neo4j database:
// Create customer node
CREATE (n1:Customer {customerName: "Michael", customerDept: "Dev-03-12", customerImportance: 9})

// Create service node
CREATE (n2:Service {serviceName: "MyAura", serviceOwner: "MDL"})

// Create software node
CREATE (n3:Software {swName: "GraphDB", swVersion: 5.19, lastUpdated: "2024-04-28", swVendor: "Neo4j Corp."})

// Create server node
CREATE (n0:Server {assetNumber: "123-4567-89021", name: "svr-dev-235", fristSeen: "2023-06-23", leaseEnd: "2026-06-22"})

// Create datacenter node
CREATE (n4:Datacenter {dcName: "DCBRU01", dcCity: "Brussels", dcGeoLocation: ""})

// Create section node with both labels
CREATE (n5:Section {name: "sec-034-225", geoLocation: ""})

// Create rack node
CREATE (n6:Rack {geoLocation: "", rackName: "rk-002-234", freeUnits: 12})

// Create relationships between customer -> service -> software & server -> service and software
CREATE (n1)<-[:USED_BY {since: "2023-01-27"}]-(n2)<-[:DELIVERS]-(n3)
CREATE (n0)-[:RUNS {since: "2023-01-24", serviceSLA: 8}]->(n2)
CREATE (n3)-[:INSTALLED_ON]->(n0)

// Create relationship chain between server -> dc -> section/room -> rack
CREATE (n0)-[:LOCATED_IN]->(n4)
CREATE (n4)-[:IN_SECTION]->(n5)-[:IN_RACK]->(n6)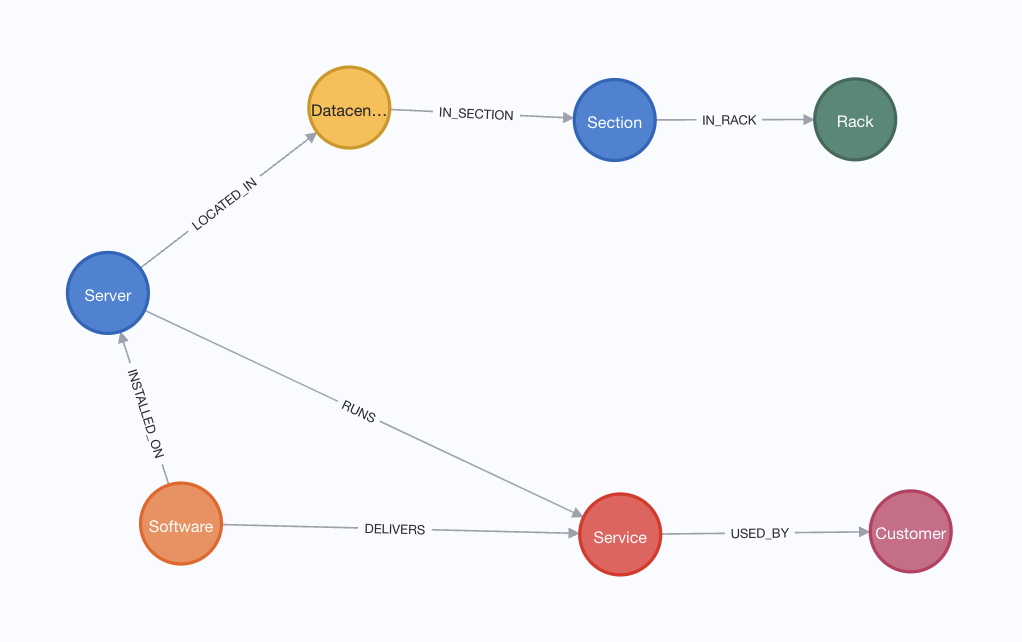
5. Cypher Queries
5.1. Identify Software delivering various services
In this query, we will identify software which is delivering various services and customers using that service:
Software nodes should be connected to the same Service node. The direction of the relationship has been applied to the traversal.
The following query returns all paths from software delivering a service used by customers:
// Match all service delivering a service used by customers
MATCH path=(:Software)-[:DELIVERS]->(:Service)-[:USED_BY]->(:Customer)
RETURN path;
It can also be filtered by various properties, e.g. the software name:
// Match all service delivering a service used by customer for software GraphDB
MATCH path=(:Software {swName: 'GraphDB'})-[:DELIVERS]->(:Service)-[:USED_BY]->(:Customer)
RETURN path;
Going further, it is also easy to include the server that runs the services to understand the impact of the server being down:
// Match a complete service chain for the software GraphDB
MATCH path=(:Rack)<-[:IN_RACK]-(:Section)<-[:IN_SECTION]-(:Datacenter)<-[:LOCATED_IN]-(:Server)<-[:INSTALLED_ON]-(:Software {swName: 'GraphDB'})-[:DELIVERS]->(:Service)-[:USED_BY]->(:Customer)
RETURN path
5.2. Identify a complete service chain of a particular software
This query can be used to identify a complete service chain, from Customer up to the Rack that is hosting the server for the software "GraphDB" running certain services:
-
Customernodes should be using the sameServicenode. -
Servicenodes should be run with the sameSoftwarenode. -
Softwarenodes should be installed on the sameServernode. -
The
Servernodes run in a datacenterSectionorRoommounted into aRacklocated in that particular place.
The direction of the relationship has been applied to the traversal for faster query response.
// Match a complete service chain
MATCH path=(:Rack)<-[:IN_RACK]-(:Section)<-[:IN_SECTION]-(:Datacenter)<-[:LOCATED_IN]-(:Server)<-[:INSTALLED_ON]-(:Software {swName: 'GraphDB'})-[:DELIVERS]->(:Service)-[:USED_BY]->(:Customer)
RETURN path;
6. Extending the IT Service Graph further
6.1. With additional data
The above example of an IT Service Graph contains information relevant to an organisation. Extending it is as simple as adding Properties to the nodes, such as relevant “loss of revenue per hour” information for estimating revenue impact or additional information about the individual objects themselves. Adding contracting and cost information for servers, services, or software will enhance the ability to monitor or analyse more complex questions and provide answers to all relevant information related to and around services running your business.
6.2. With additional use cases like Master Data Management, etc.
A mature IT Service Knowledge Graph (KG) will provide you with many possibilities to increase the maturity of your services. Nevertheless, it can be beneficial to increase your graph knowledge further. Two options may stick into your eyes immediately:
-
Master Data Management (MDM): MDM can be any type of data in a graph varying from price master data up to access information about people having permissions to certain operations and maintenance involved in server, software and service operations. Adding this kind of data into the IT Service Knowledge Graph will enhance the views even more and can answer questions like “Marco moves from department A to D, what services/software/data/etc. does he need and what needs to be removed from his list of permissions”.
-
People Profile Information: Having people profiles and experience information in the Graph or as a separate KG can help understand what people have experience or certifications to operate services, servers, networks, and other objects in IT. It can also help develop skills needed to maintain stable operations in case certain knowledge gets lost and provide growth paths to employees.
There are even more possibilities to build an IT Service Graph further out, but it is important to start small and grow once the foundational work has been done.