Monitoring Neo4j
About this module
Now that you have gained experience managing a Neo4j instance and database, managing Neo4j Causal Clusters, and the steps you must take to secure your deployed Neo4j application, you will learn how to monitor the Neo4j instance as it is used by applications.
At the end of this module, you will be able to:
-
Describe the categories of monitoring and measurement you can perform with Neo4j.
-
Monitor:
-
queries
-
transactions
-
connections
-
memory usage
-
-
Manage log files.
-
Manage the collection of Neo4j metrics.
-
Use JMX queries.
Monitoring in Neo4j
As an administrator, you configure your deployed Neo4j application so that you can perform routine monitoring of activity, as well as being prepared to more deeply monitor and possibly re-configure Neo4j.
The Neo4j instance writes events to log files where you can configure the level of logging you want to perform. In addition, Neo4j writes metrics to a directory that is dedicated for collecting runtime data. The Neo4j Operations Manual describes these files and locations that you will be working with in this module.
Some linux installations may use a system service to collect log files and allow you to access log data with journalctl as described in the Neo4j Operations Manual. You have already seen some of the events that are written to the neo4j.log file (journalctl -u neo4j on Debian) when the Neo4j instance starts and you want to confirm that it started successfully. In addition, you have seen error events written to debug.log when attempting to start a Neo4j instance in a Causal Cluster. You have also seen authentication events that are written to the security.log file when users connect to the Neo4j instance.
Monitoring log files
In the previous module, Security in Neo4j, you learned about the authentication events that are written to the security.log file. The categories of events that you configure for and monitor in log files that you will learn about in this module include:
-
Queries
-
Transactions
-
Connections
-
Memory
| You have learned how to monitor core and read replica servers in a Neo4j Causal Cluster in the module, Causal Clustering in Neo4j. |
Collecting metrics
In addition, you can configure the Neo4j instance to collect metrics that are related to events, but can be viewed in tools (such as Grafana) that use the Graphite or Prometheus protocols to help you monitor your application. In most cases, you will want to configure a tool such as Nagios to provide alerts when certain metrics or events are detected in Neo4j. Note that you can also set up alerts in Grafana, but Nagios is a better choice for alerts. CloudWatch is another UI that is commonly use for monitoring and alerting with AWS deployments.
Monitoring queries
In a production environment, you want to know if a query is taking a long time and using too many resources. A user/application may not even be aware that their query is hung. For example, if they started a query and then walked away from their computer.
As an administrator, you can configure Neo4j to write information about queries that completed to the query.log file. You can provide settings that will log information about queries that took a long time to complete. You can also monitor currently running queries and if need be, kill them if they are taking too long.
Configuring query logging
You can configure Neo4j to log an event if a query runs more than xx milliseconds. There is no standard for what a reasonable period of time is for a query, but in most databases, a query that runs for minutes is not a good thing! At a minimum, you must enable logging for queries and set a threshold for the length of time queries take. Then, as part of your monitoring, you could regularly inspect the query.log file to determine if a certain set of queries or users are possibly performing queries that tax the resources of the Neo4j instance.
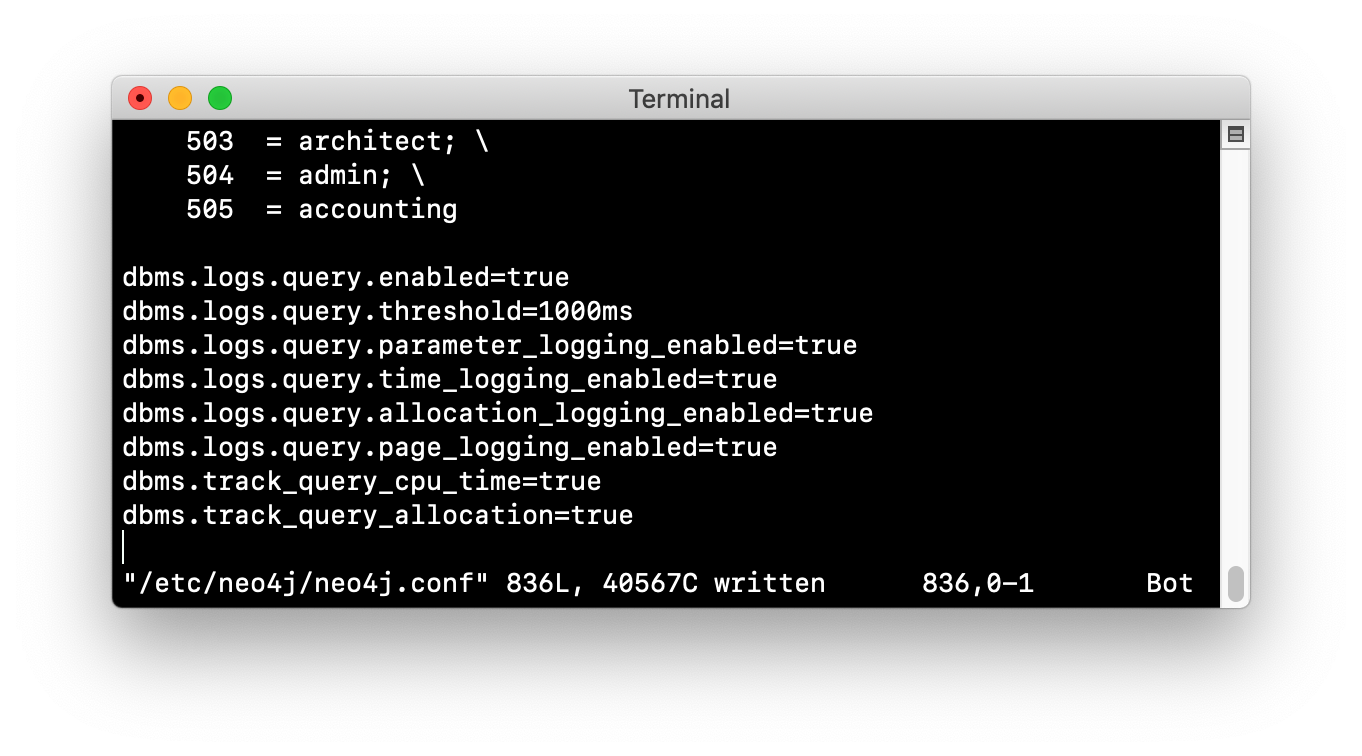
For example, here are the properties you would set in the Neo4j configuration to log a message and provide information when a query takes more than 1000ms to complete:
dbms.logs.query.enabled=true
dbms.logs.query.threshold=1000ms
dbms.logs.query.parameter_logging_enabled=true
dbms.logs.query.time_logging_enabled=true
dbms.logs.query.allocation_logging_enabled=true
dbms.logs.query.page_logging_enabled=true
dbms.track_query_cpu_time=true
dbms.track_query_allocation=true
The Neo4j Operations Manual has a section on the configuration settings you can specify to log query events to the query.log file.
| If you have Neo4j Desktop installed on a system, you can use it to run an application called Query Log Analyzer, written by an engineer from Neo4j. This application is a useful tool for viewing queries on your Neo4j Enterprise instance. Here is the Medium article that describes the tool and how to install it. |
Long-running queries
Inspecting the log file for queries that completed in more than XX milliseconds provides historical information, but what if you suspect that a query is running too long or is hung?
There are two reasons why a Cypher query may take a long time:
-
The query returns a lot of data. The query completes execution in the graph engine, but it takes a long time to create the result stream.
-
Example:
MATCH (a)--(b)--(c)--(d)--(e)--(f) RETURN a
-
-
The query takes a long time to execute in the graph engine.
-
Example:
MATCH (a), (b), (c), (d), (e) RETURN count(id(a))
-
If the query executes and then returns a lot of data, there is no way to monitor it or kill the query. If the Neo4j instance has many of these rogue queries running, it will slow down considerably so you must aim to limit these types of queries.
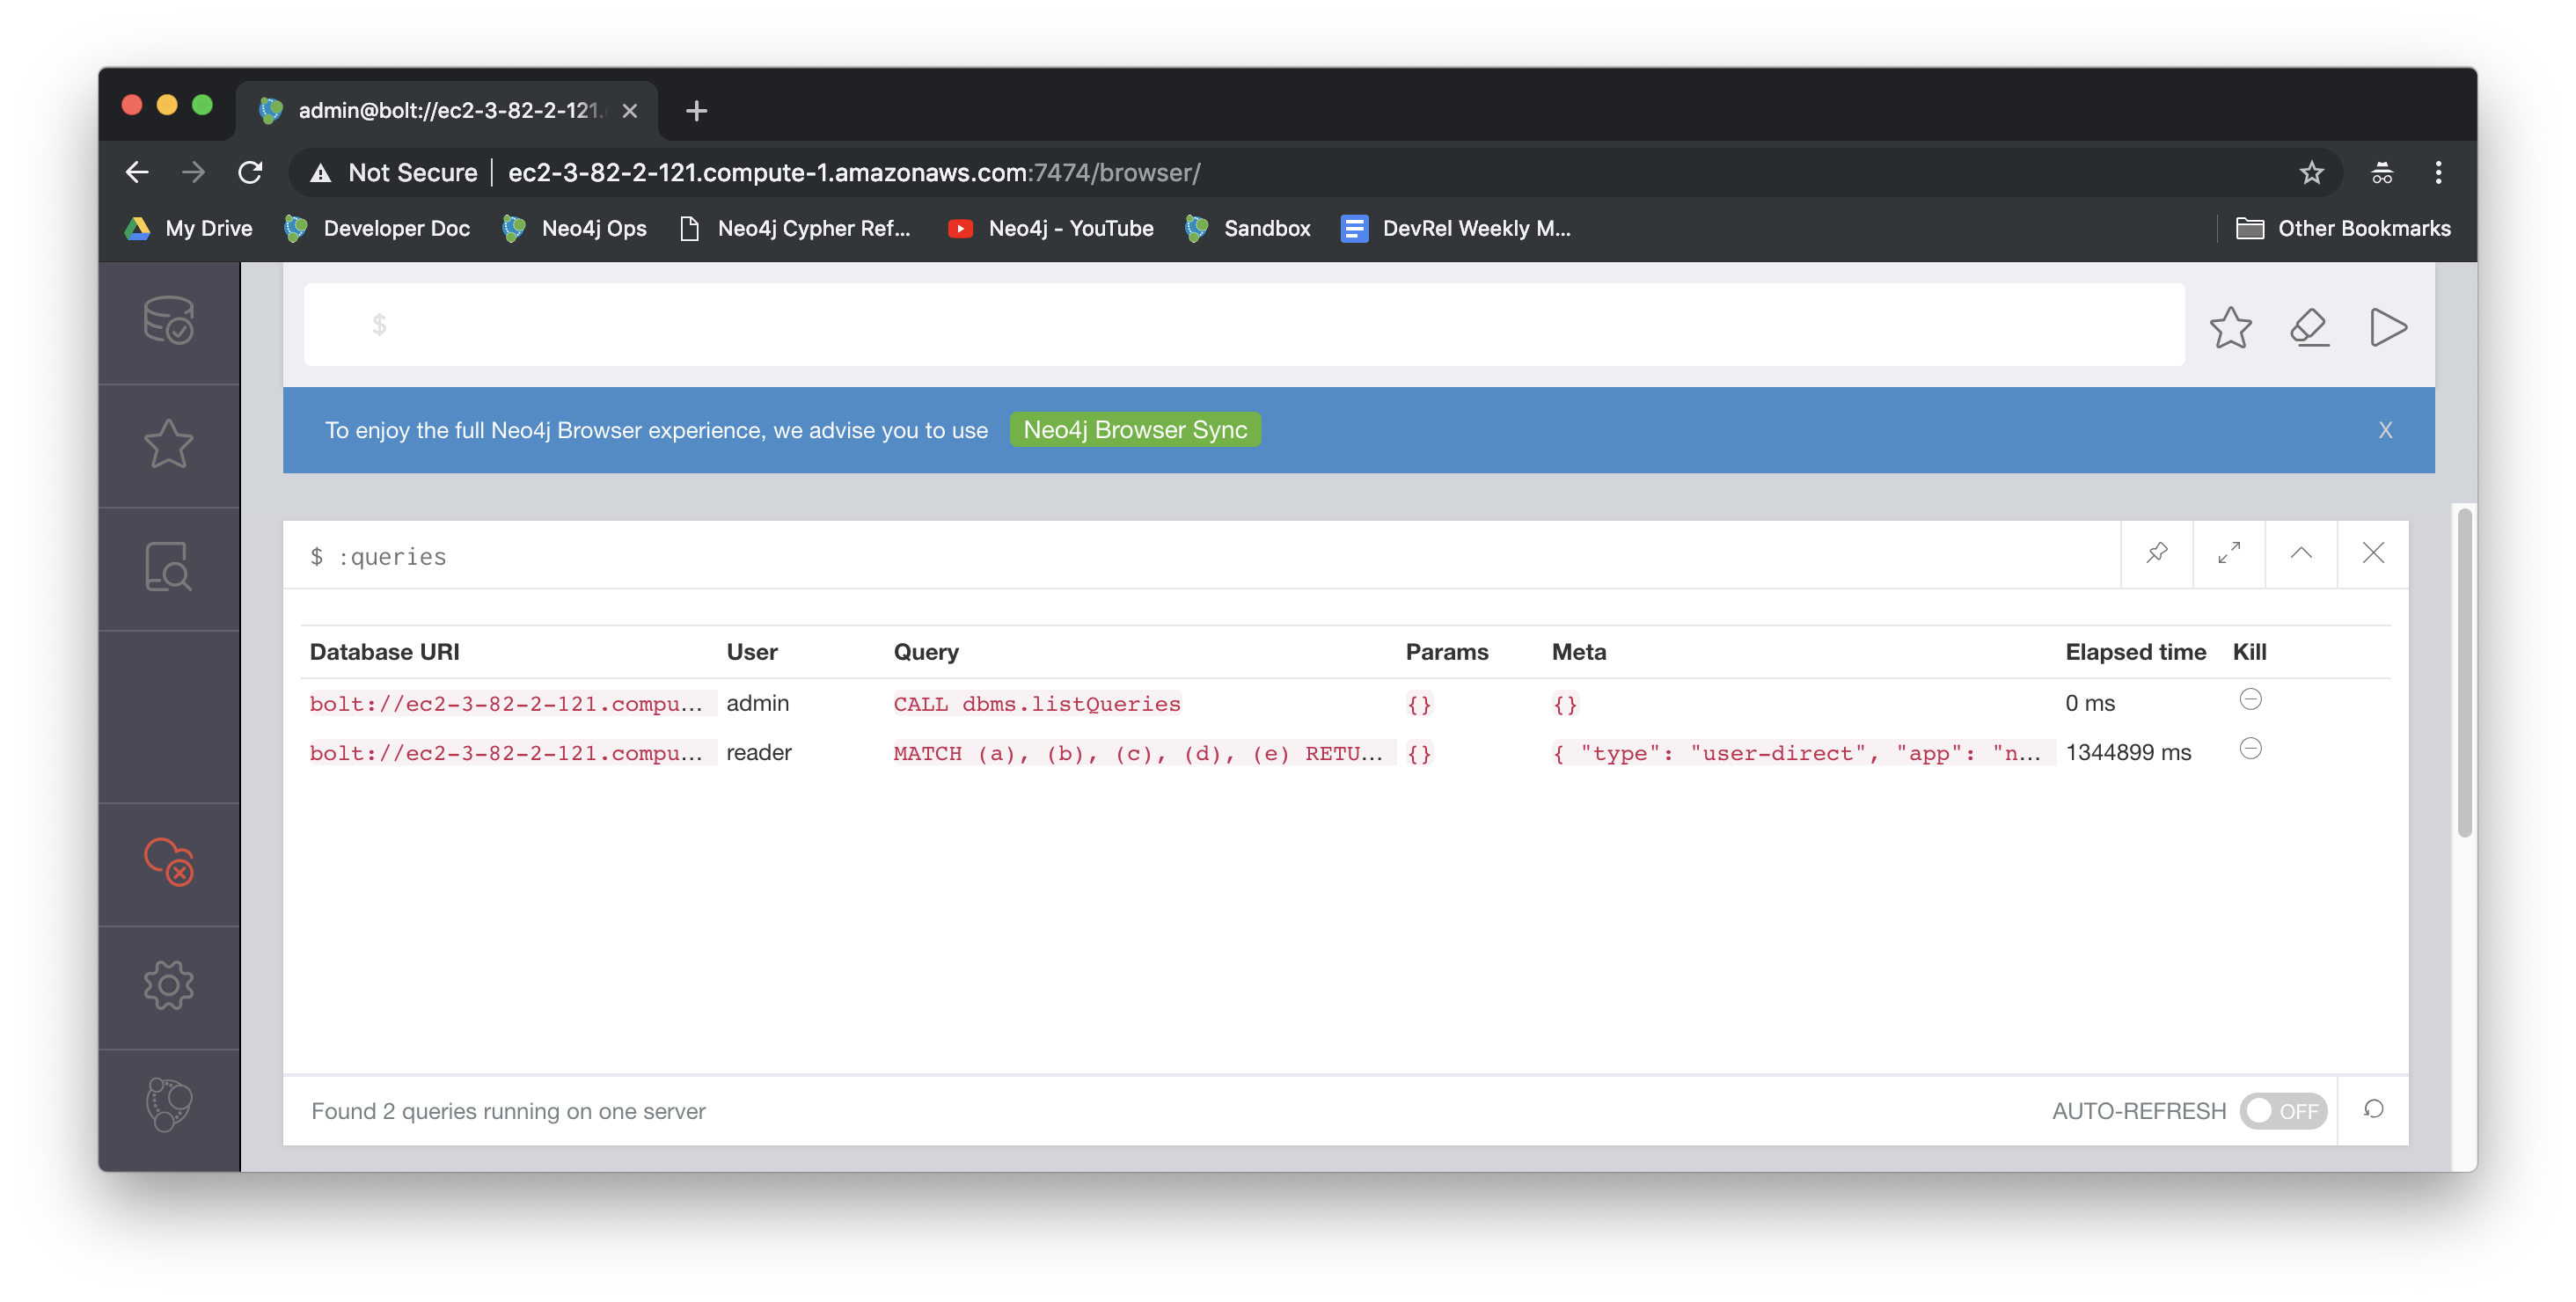
Viewing currently running queries (Neo4j Browser)
In Neo4j Browser you can use the :queries command to see all currently running queries:
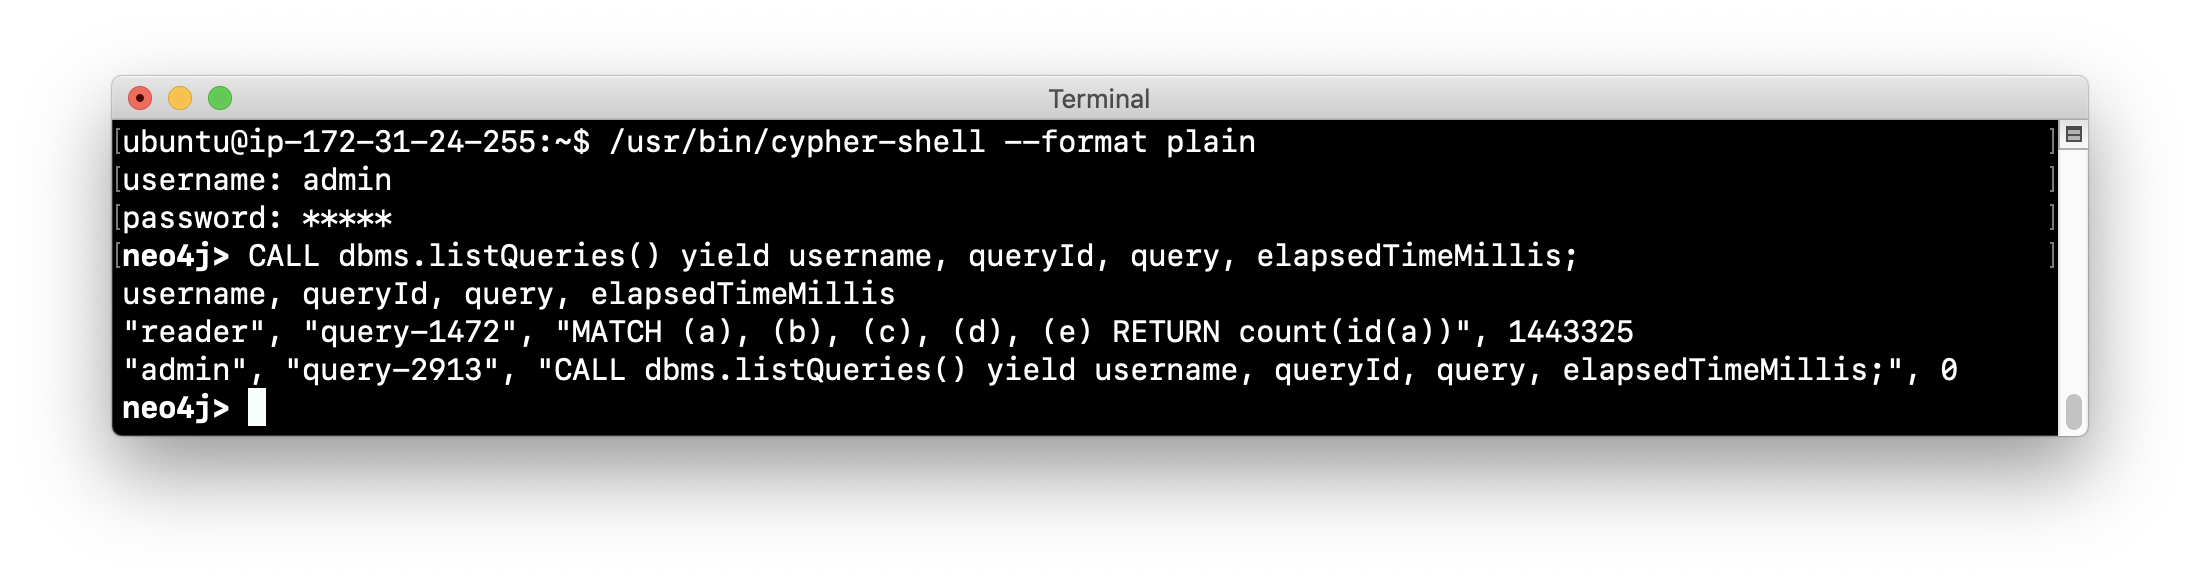
Viewing currently running queries (cypher-shell)
In cypher-shell you execute CALL dbms.listQueries() YIELD username, queryId, query, elapsedTimeMillis;.
Due to a limitation in the database, there is a very small possibility that not all queries will be returned when you run dbms.listQueries().
|
Another statement you can use to view long-running queries and any type of transaction running in the Neo4j instance is CALL dbms.listTransactions(); which you will use in the next Exercise.
If you have the admin role, you can view (and kill) queries from all users. If you do not have an admin role, you will only be able to view your own queries.
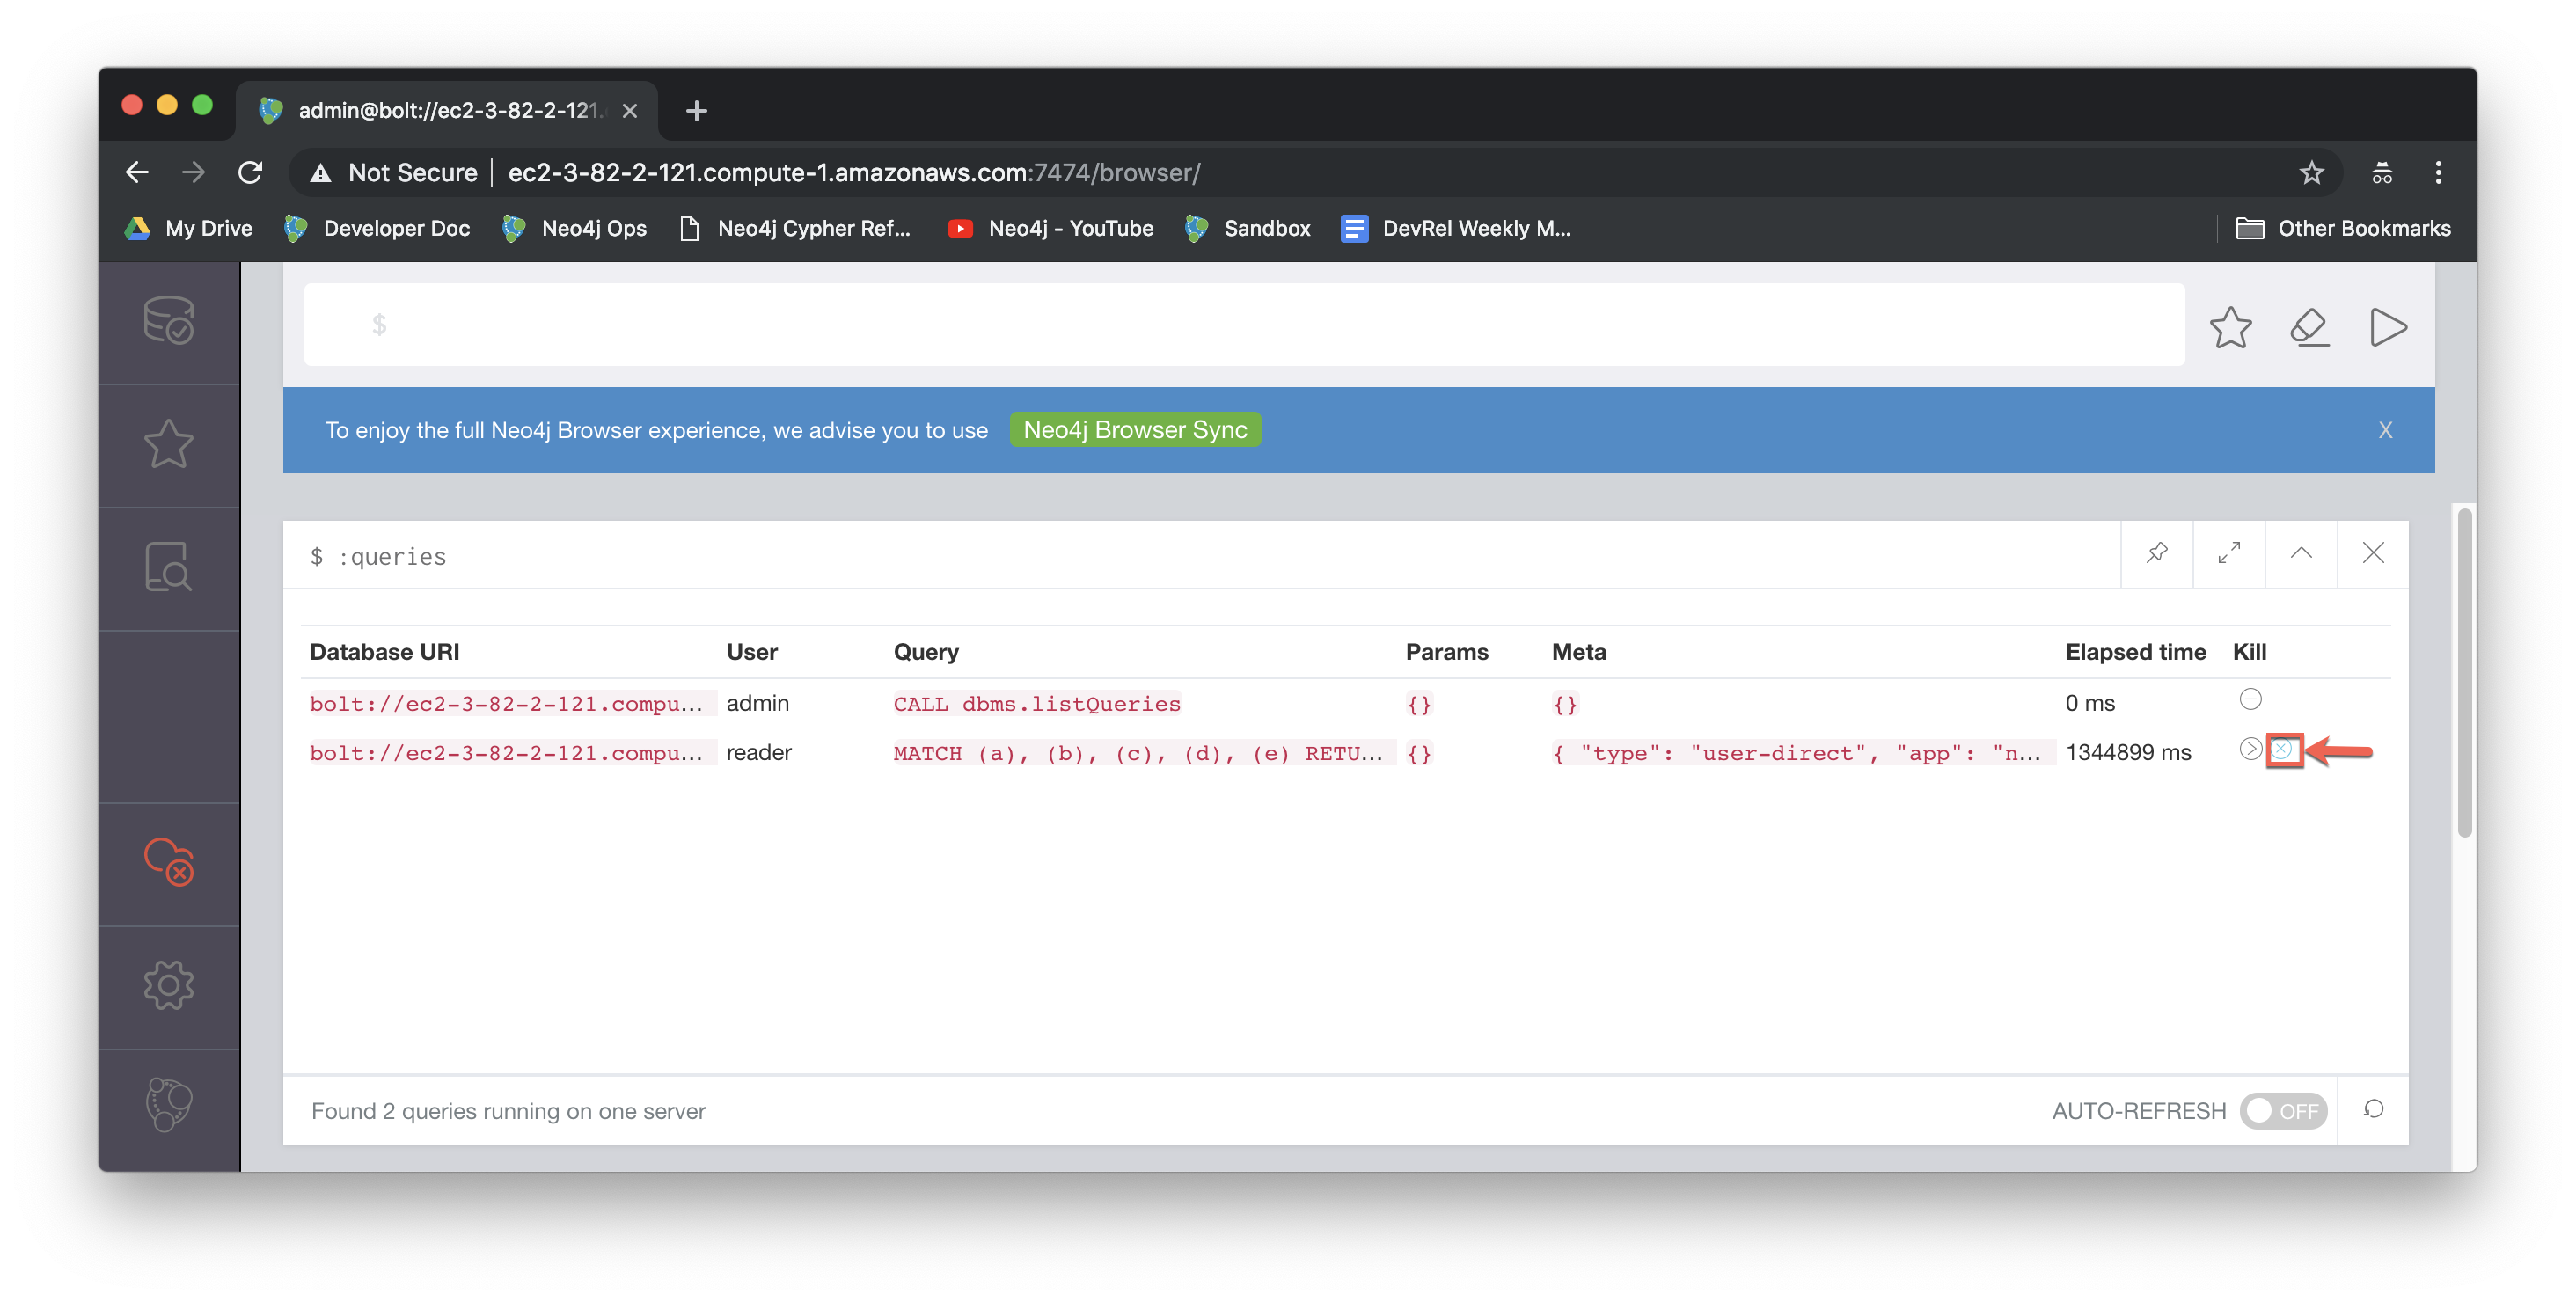
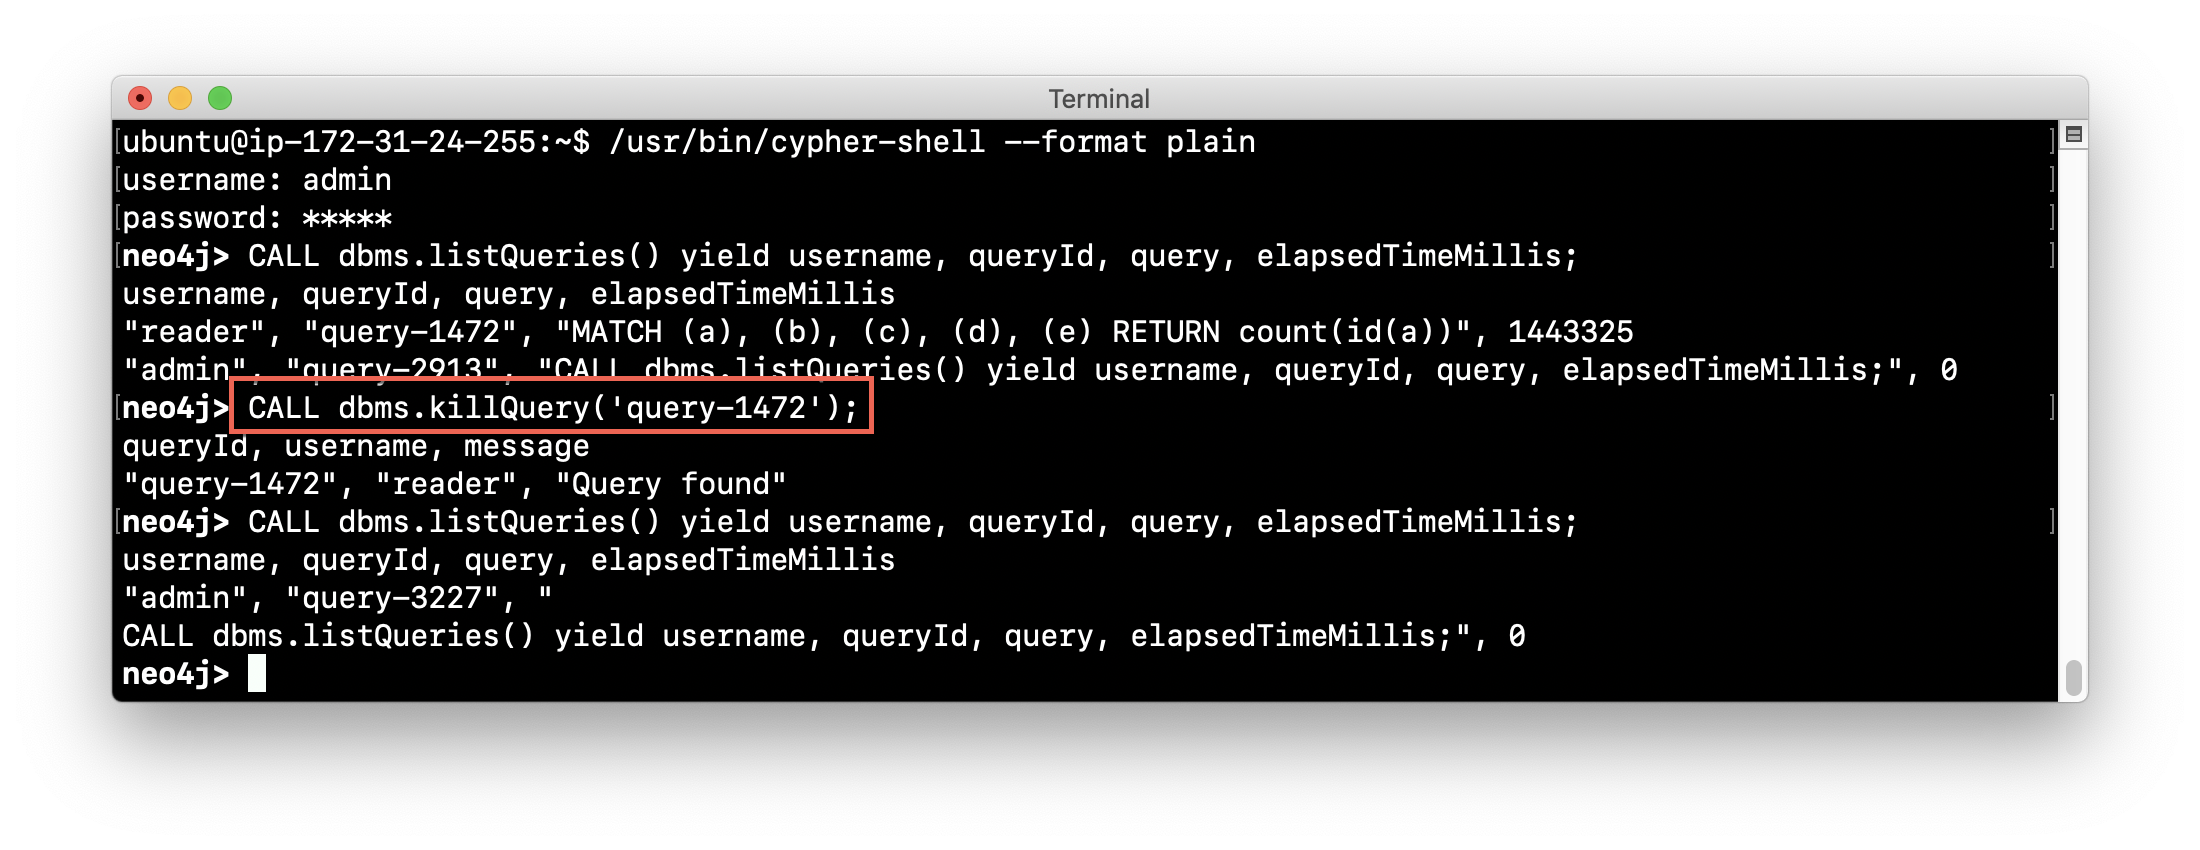
Killing a long-running query
Recall that a user (or application) that issues a long-running query may not be able to stop the query. You would need to intervene and kill the query for the user.
Once you have identified the long-running query that you want to kill, in Neo4j Browser, you can kill it by double-clicking the icon in the Kill column.
Exercise #1: Monitoring queries
In this Exercise, you enable query logging where an event will be written to the query.log file for a query that took more than 1000ms to complete. Then you will monitor and detect a long-running query and kill it.
Before you begin:
-
For this Exercise, you will be using the stand-alone Neo4j instance that you configured for authentication in the previous module, Security in Neo4j.
-
Ensure that the database you are using is movie3.db.
Exercise steps:
-
Modify the neo4j.conf file to create a log record if a query exceeds 1000 ms.
-
Start/restart the Neo4j stand-alone instance.
-
Open a new terminal window and log in to
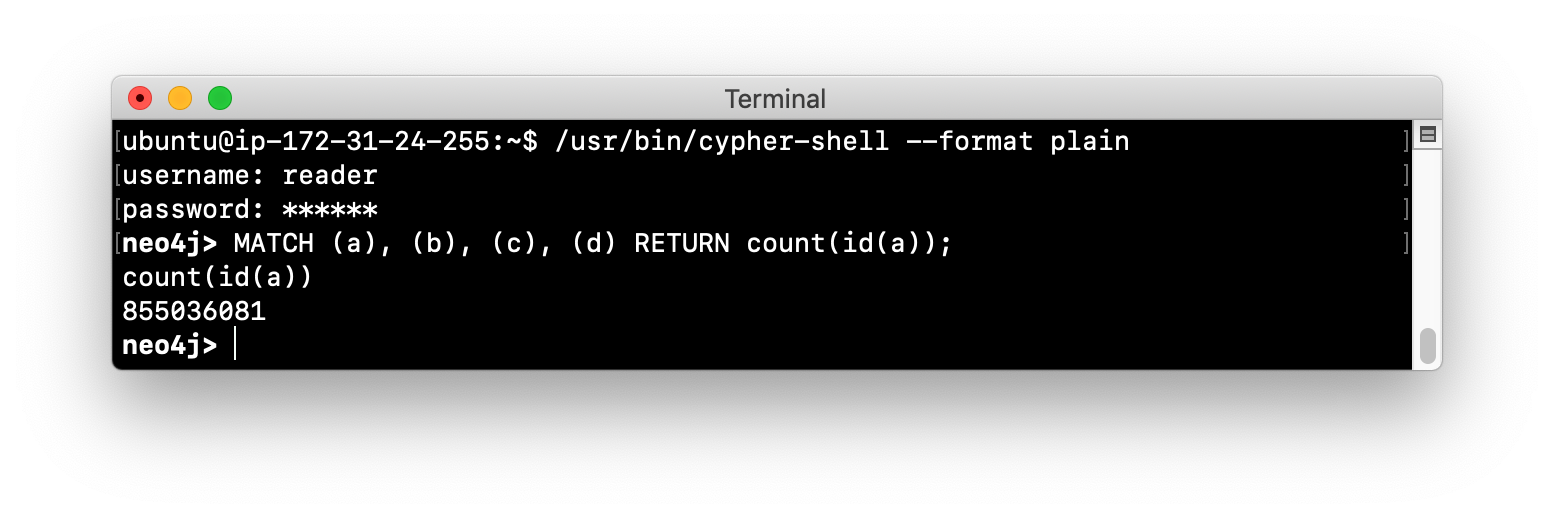
cypher-shellwith the reader/reader credentials. (Suggestion: specify --format plain) -
In this
cypher-shellsession, enter the following statement which will execute a query that runs for longer than 1000 ms:MATCH (a), (b), (c), (d) RETURN count(id(a));You must never run this type of query against a large database. It is only presented here for illustrative purposes to show a long-running query.
-
Wait about a minute, it will complete.
-
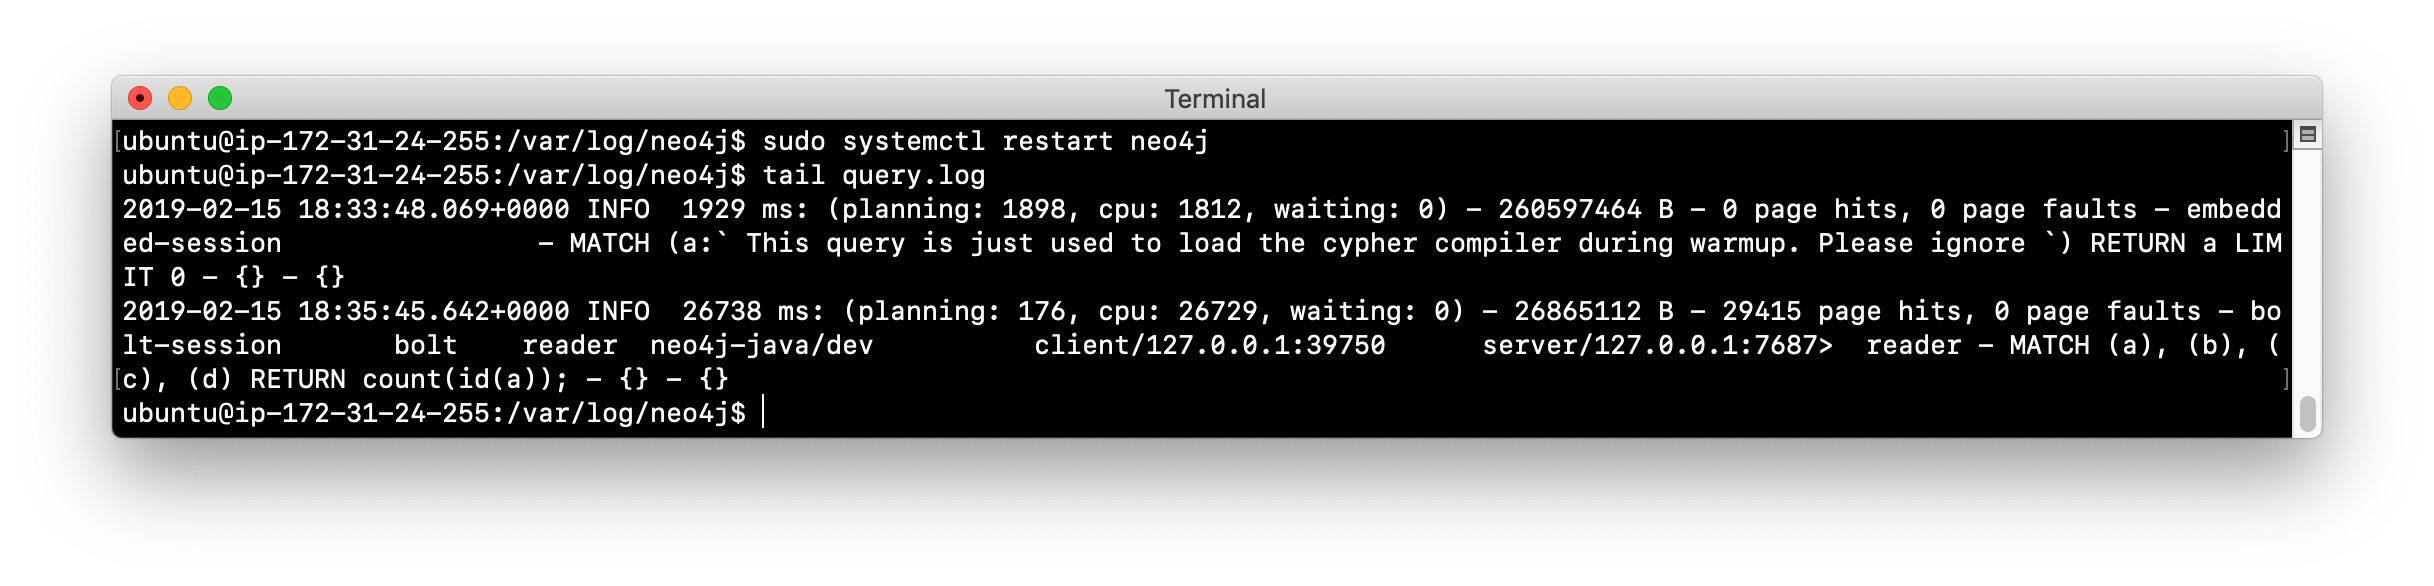
In the terminal window where you started the Neo4j instance, view the query.log. Is there a record for this query?
-
In
cypher-shellsession for reader, enter a query that will execute for an even longer period of time:MATCH (a), (b), (c), (d), (e) RETURN count(id(a)); -
Open a new terminal window and log in to cypher-shell with the admin/admin credentials. (Suggestion: specify --format plain)
-
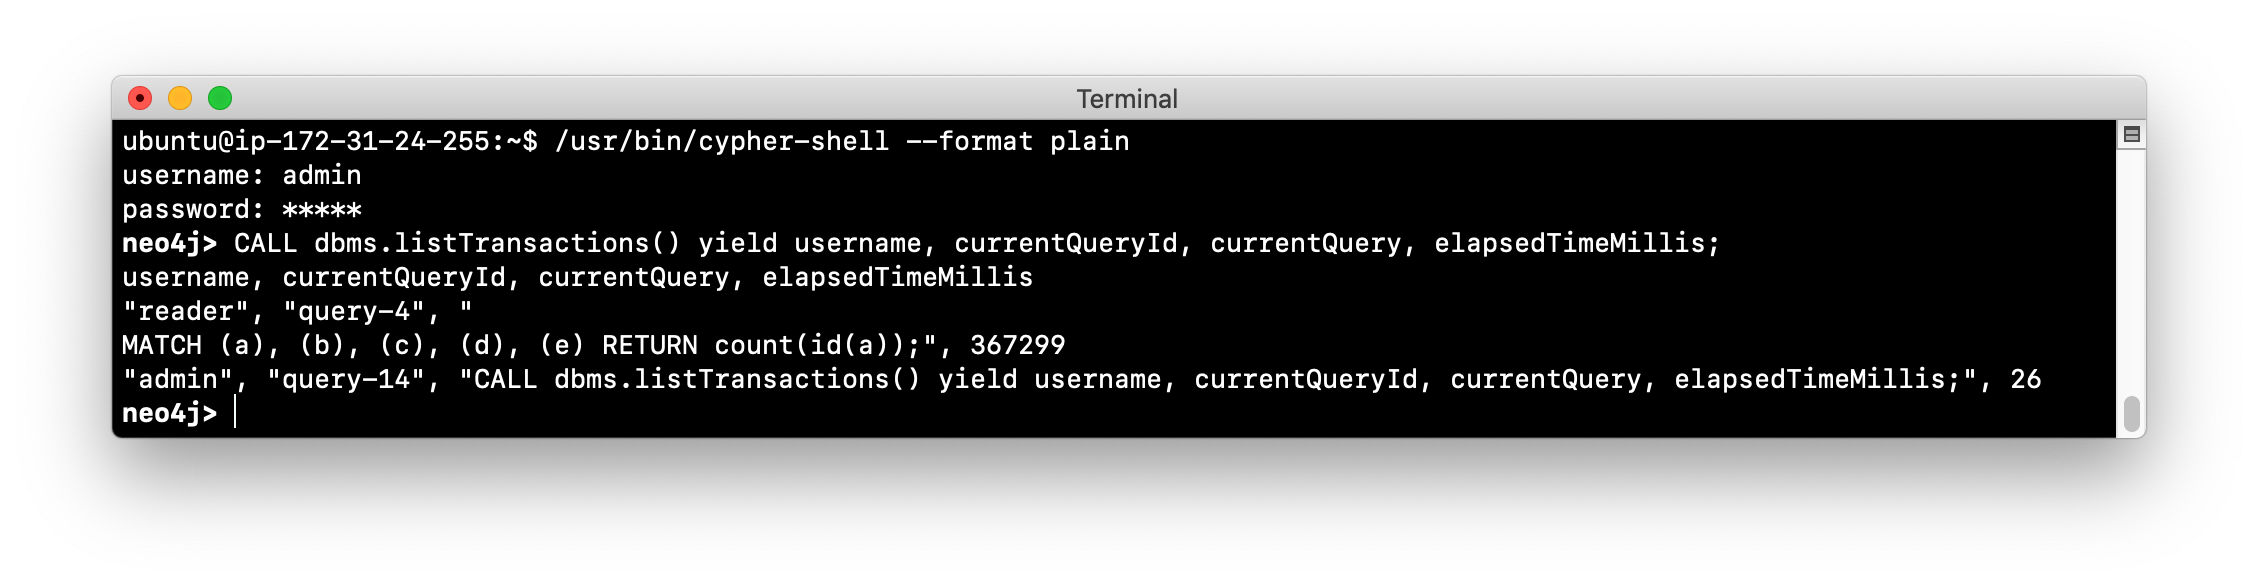
In this second admin
cypher-shellsession, execute the Cypher statement to list transactions. Do you see the query from reader? -
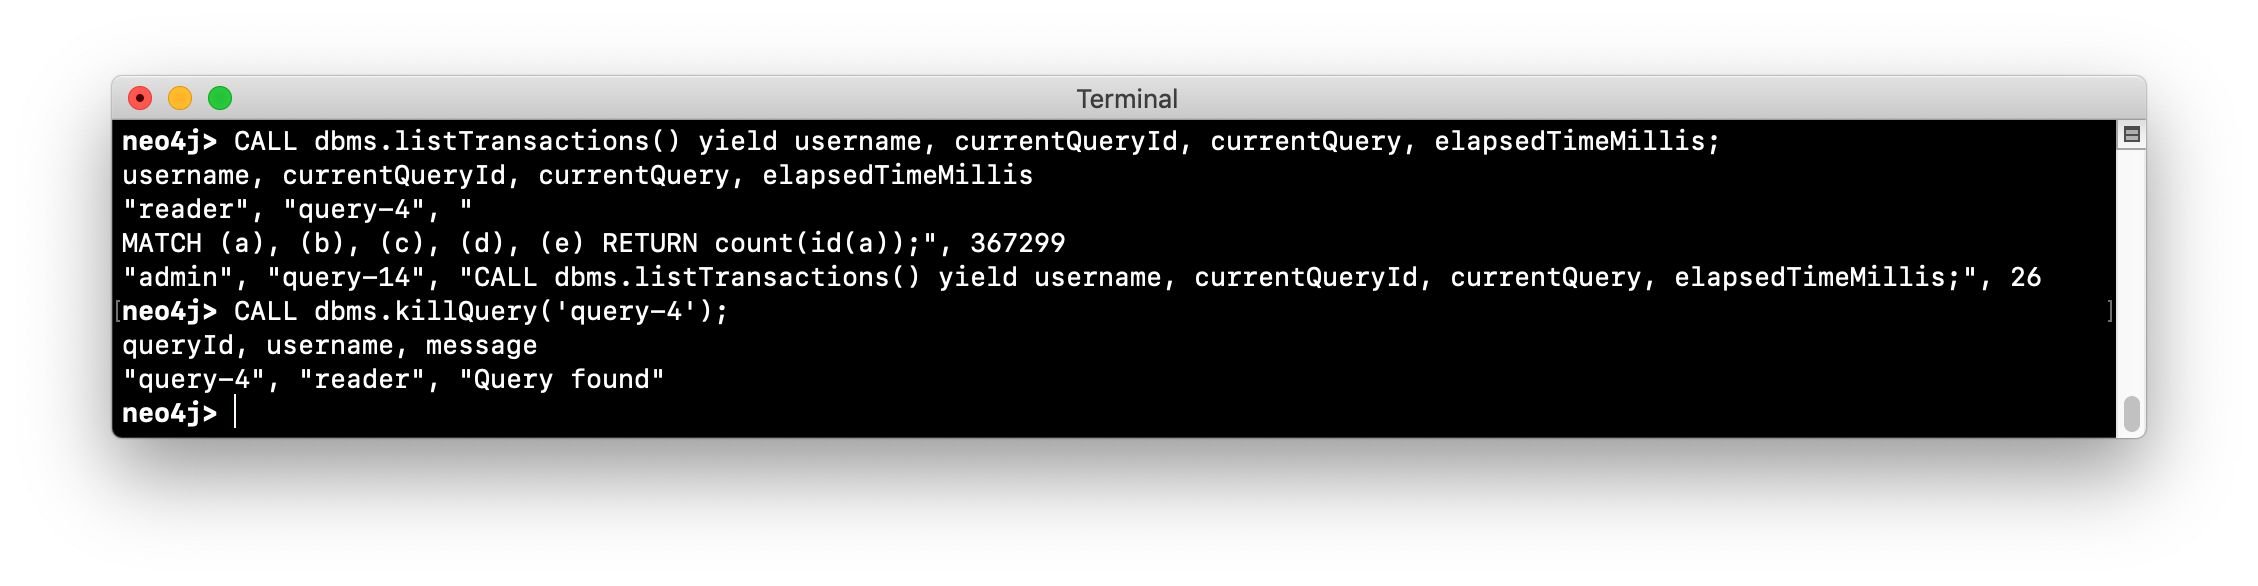
Then execute the same statement returning the username, currentQueryId, currentQuery, and elapsedTimeMillis.
-
In the second admin
cypher-shellsession, execute the Cypher statement to kill the long-running query.
-
Observe in the reader_
cypher-shellsession that the query has been killed.
Automating monitoring of queries
Some queries against the Neo4j instance are not simply queries, but are Cypher statements that load data from CSV files. These types of Cypher statements could take a considerable amount of time to complete. One option for you to help automate the killing of long-running queries is to create a script that executes a Cypher statement such as the following:
CALL dbms.listQueries() YIELD query, elapsedTimeMillis, queryId, username
WHERE  NOT query CONTAINS toLower('LOAD')
AND elapsedTimeMillis > 30000
WITH query, collect(queryId) AS q
CALL dbms.killQueries(q) YIELD queryId
RETURN query, queryId;
This Cypher statement will retrieve all queries that are running for longer than 30000 ms that do not perform a LOAD operation and kill them. You could place this code into a script that is run at regular intervals.
Monitoring transactions
In the previous Exercise, you saw that you can query the Neo4j instance for currently running queries, as well as currently running transactions. Transactions and their successful completion are important for any production Neo4j instance. As an administrator, you must be able to confirm through monitoring and configuration settings that transactions are completing within a specified period of time.
A transaction is either a read-only transaction or a read-write transaction. Read-only transactions never block other clients as they acquire share locks, but can take a long period of time to execute as you saw in the previous Exercise. A read-write transaction acquires exclusive locks during the transaction and may be blocked by other transactions that have acquired exclusive locks on the same resources. In some scenarios, a deadlock could occur if one transaction is blocked and is also blocking another transaction from acquiring the exclusive locks it needs.
In a multi-user read-write transactional application, you mustconfigure the Neo4j instance so that a transaction will be aborted if it cannot obtain exclusive locks after a certain period of time. This will eliminate a deadlock situation.
In addition, you must configure an upper limit for how long a transaction can run. This will depend on your particular application, but it must be set to a value that is greater than the lock timeout value. This is called a transaction guard which is a good thing in a production system. In fact, you can use transaction guard to automatically kill queries that take longer than xx minutes to execute.
Example: Configuring transaction guard
Here is an example of the configuration settings for lock acquisition timeout and transaction guard where the transaction will fail if it exceeds one second or the request waits more than 10 milliseconds to acquire a write lock:
# transaction guard: max duration of any transaction
dbms.transaction.timeout=1s
# max time to acquire write lock
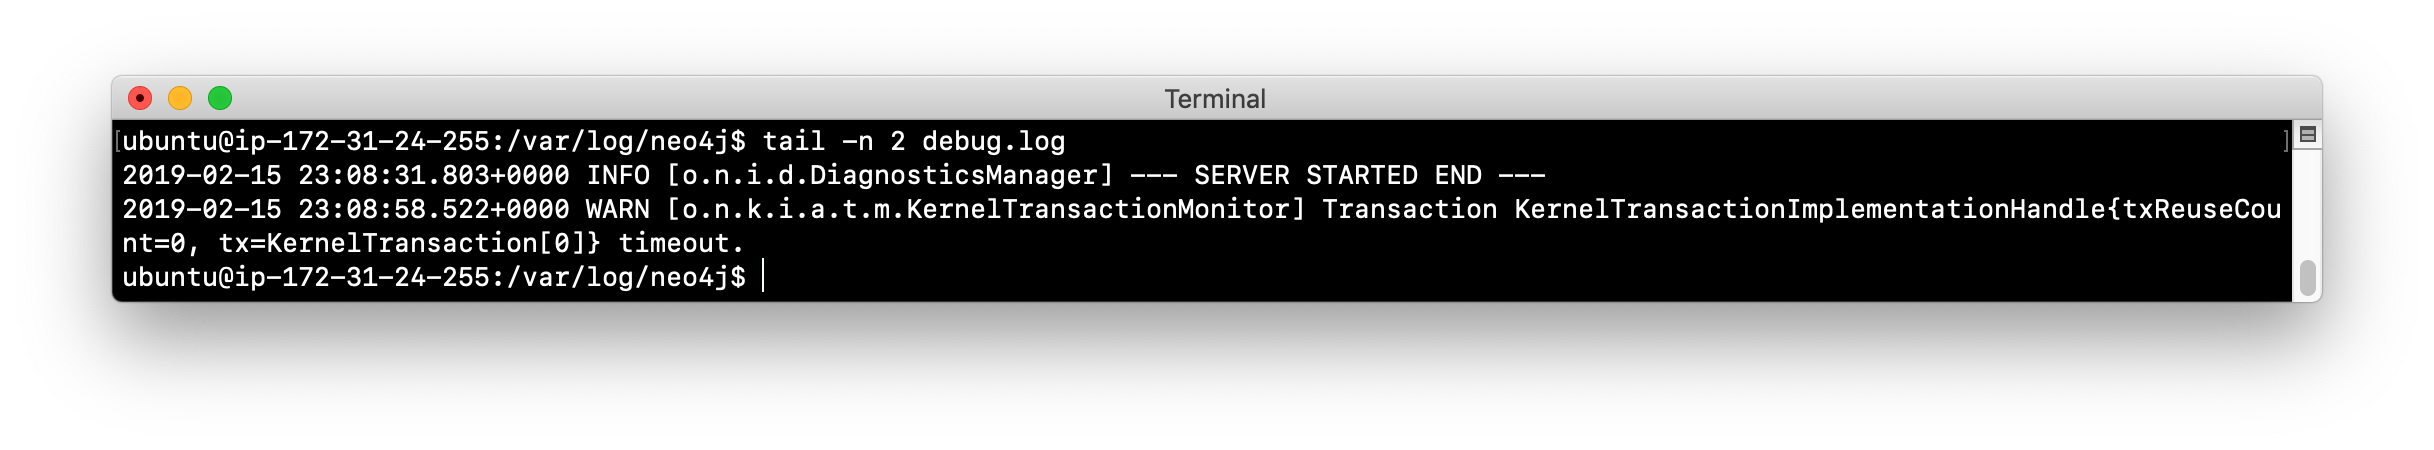
dbms.lock.acquisition.timeout=10msWhen a lock timeout occurs or when a transaction times out, the client will receive an error and a record is written to the debug.log file.
| If you set a transaction timeout without setting the lock timeout, the client session may be deadlocked and the transaction cannot be terminated. This is why it is important to set both of these properties in your Neo4j configuration. |
Exercise #2: Monitoring transactions
In this Exercise, you configure Neo4j to not allow transactions that take longer than one second to complete.
Before you begin:
For this exercise, you will be using the stand-alone Neo4j instance that you used in the previous Exercise.
Exercise steps:
-
Modify the neo4j.conf file to terminate transactions where the client cannot obtain a write lock after 10 milliseconds or the transaction time exceeds 1 second.
-
Start or restart the Neo4j instance.
-
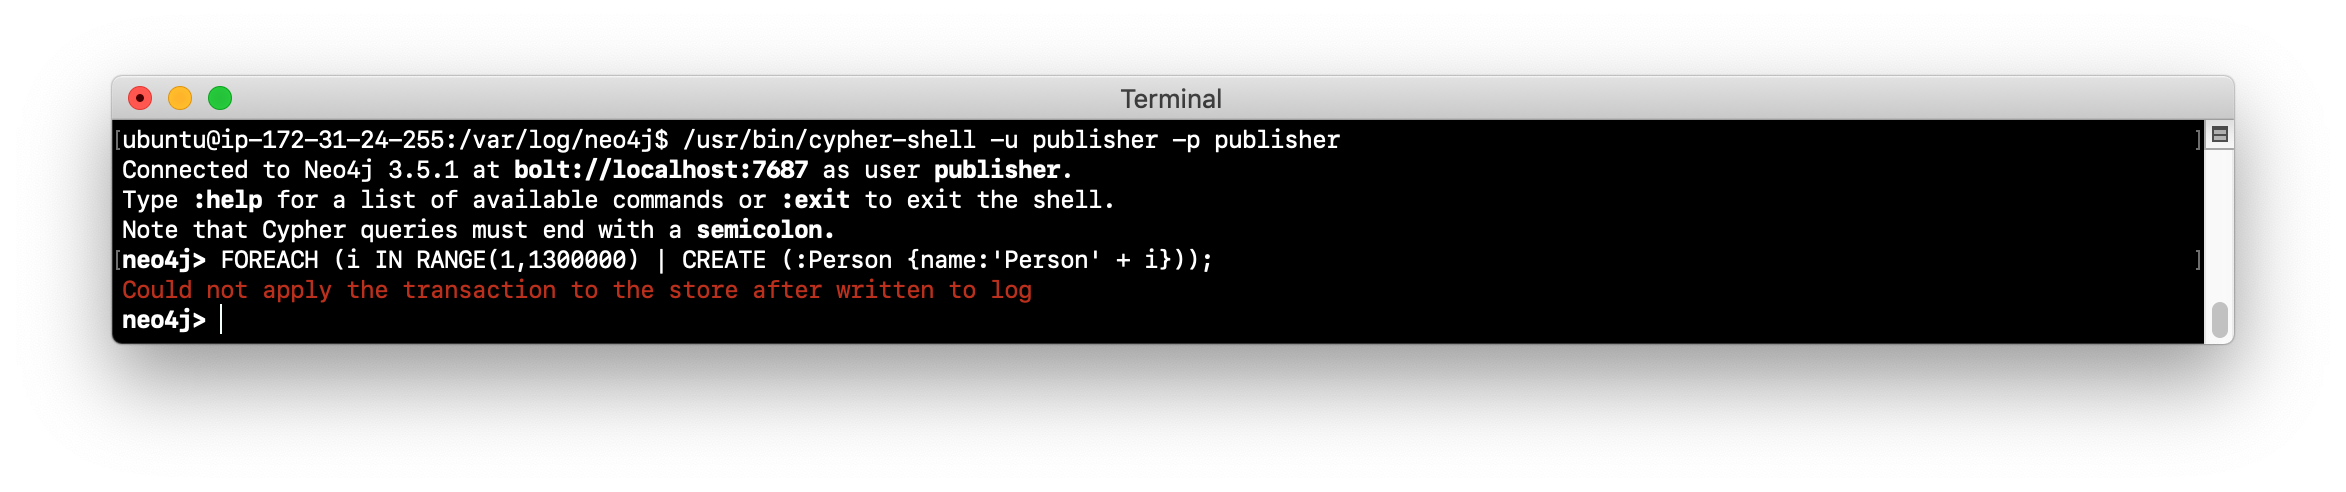
In a terminal window, log in to
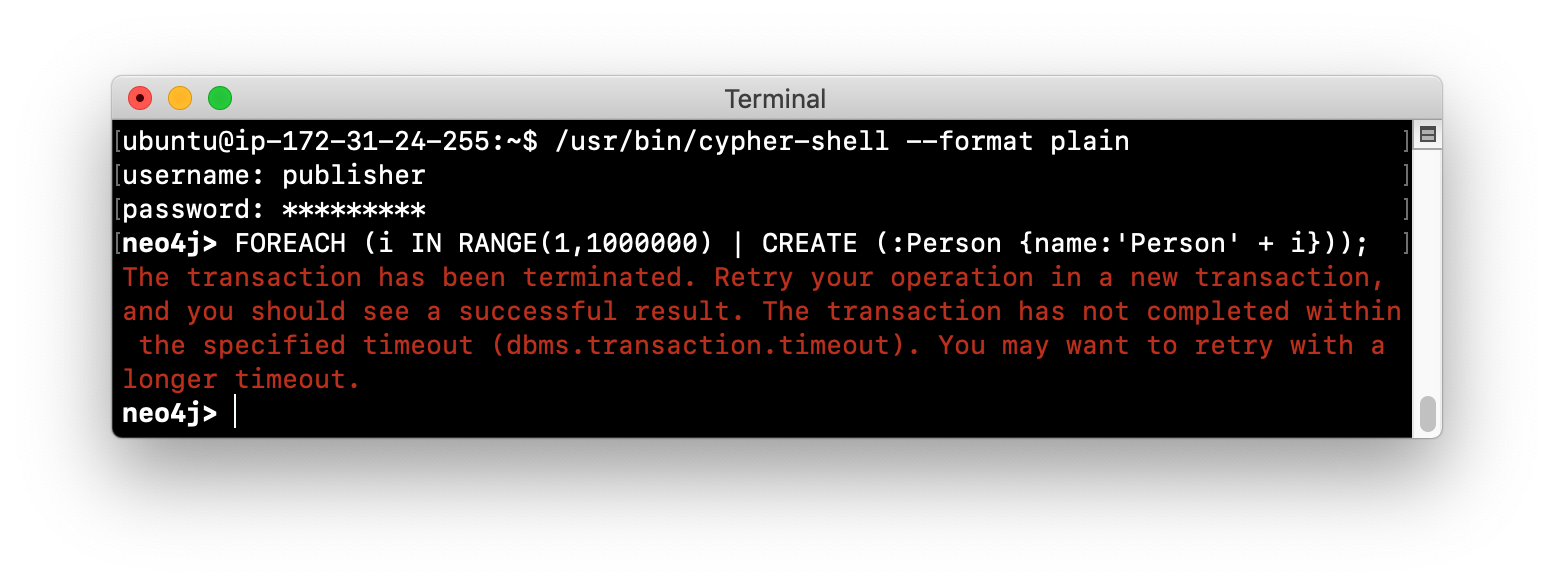
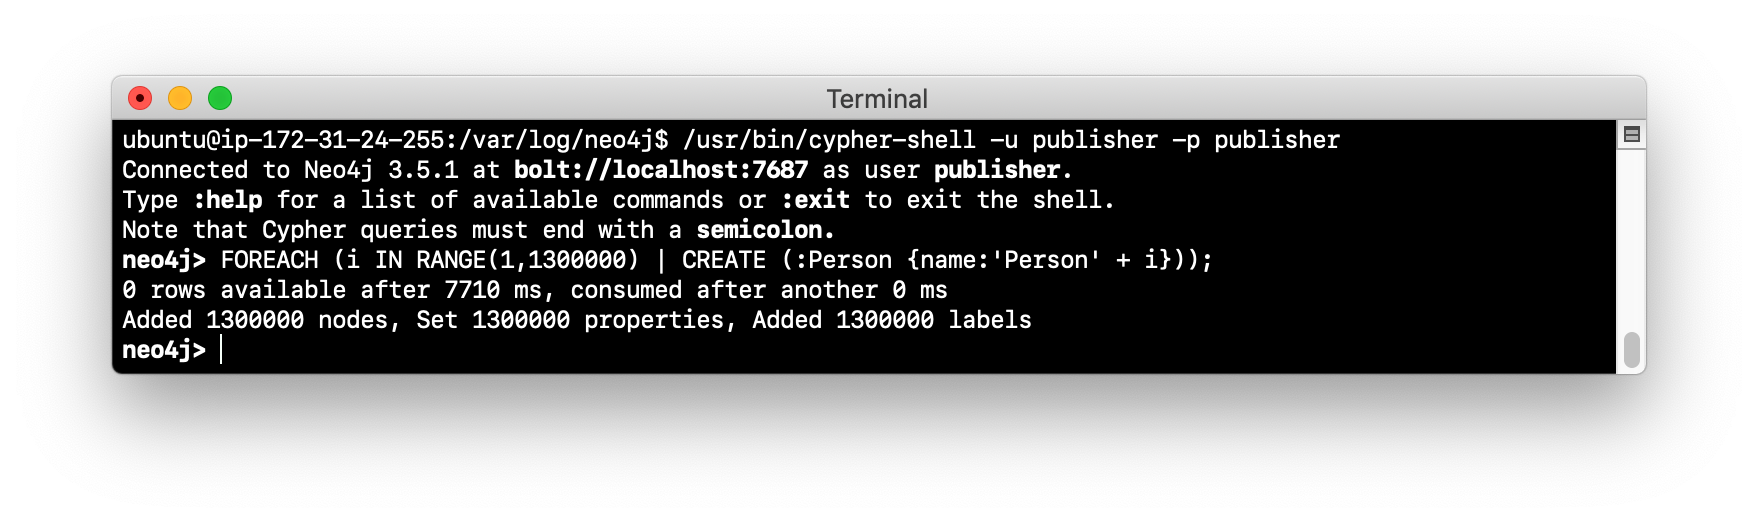
cypher-shellwith the credentials publisher/publisher. -
Enter this Cypher statement which will attempt to execute a write transaction to create a million Person nodes:
FOREACH (i IN RANGE(1,1000000) | CREATE (:Person {name:'Person' + i}));Do you receive an error?
-
View the record written to debug.log.
| If you attempt to create more than a million Person nodes, you will run into other problems, most notably, running out of virtual memory in the Neo4j instance. You will learn about configuring virtual memory later in this module. |
Monitoring locks
You can query the Neo4j instance’s currently running transactions. If you see transactions that are running for a long time, you can further query the Neo4j instance to determine what locks each long-running query is holding. To read more about monitoring locks, see this Neo4j Support Knowledge Base article.
Monitoring connections
A Neo4j instance (stand-alone or cluster mode) uses a set of ports for inter-cluster communication and a set of ports for client communication. When you configure the Neo4j instance, you must ensure that the configured ports are available and are not blocked by a firewall.
The default ports used by a Neo4j instance are documented in the Neo4j Operations Manual. And you have learned that you can modify the port numbers used by a Neo4j instance. As you learned in a previous lesson about securing Neo4j, for a secure Neo4j application, you must not use any default port numbers.
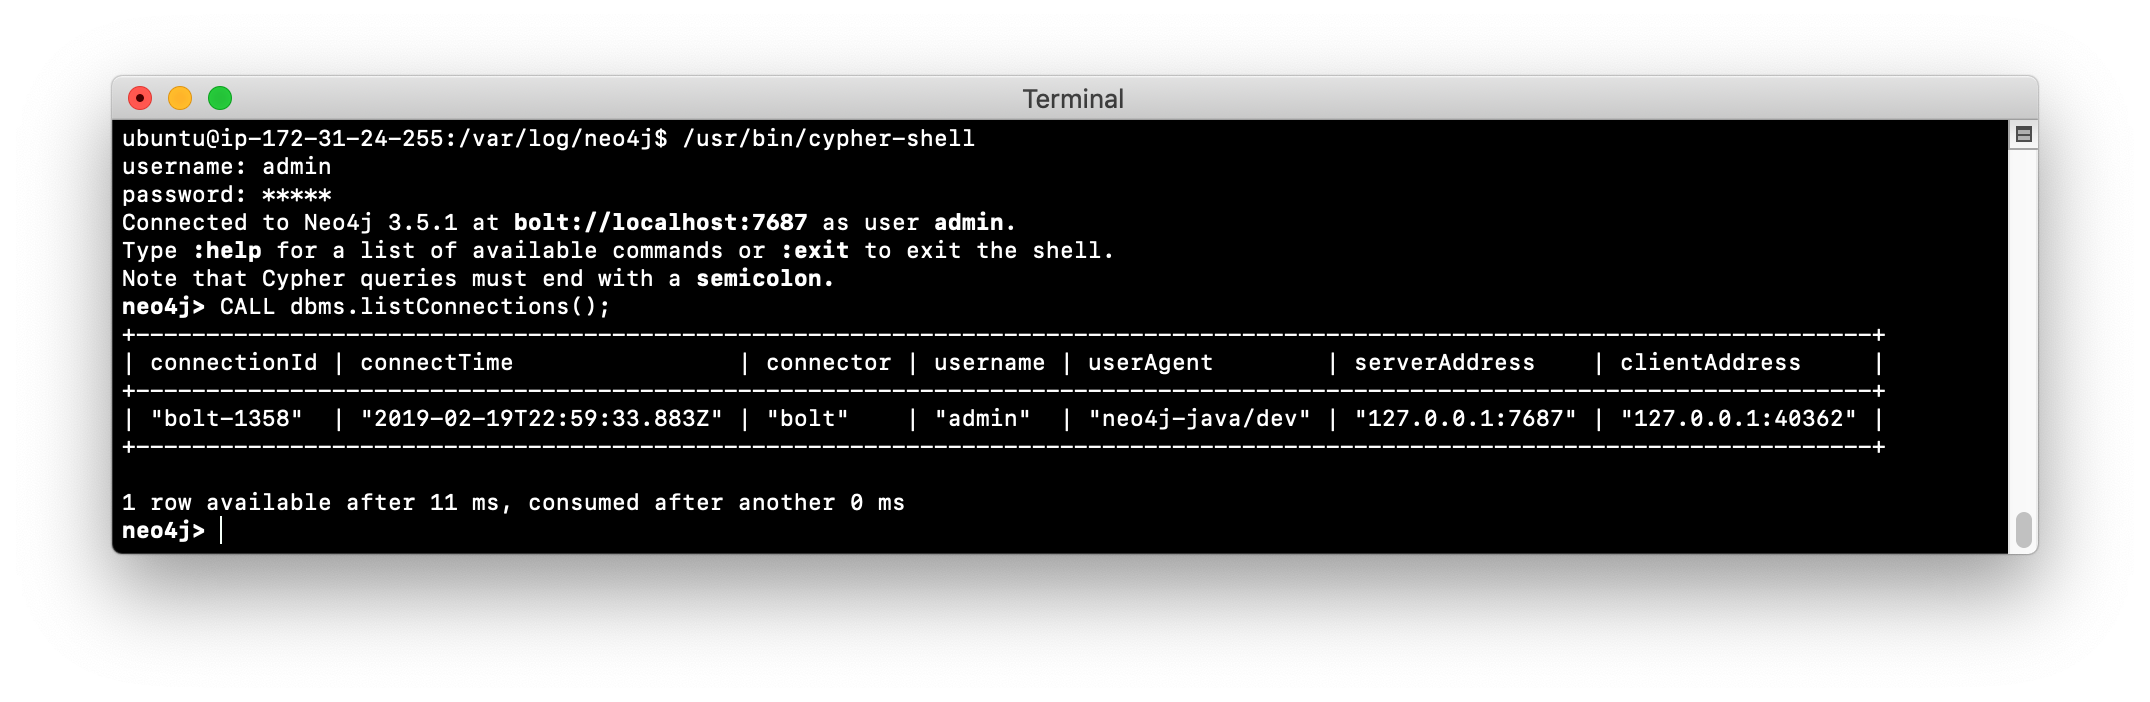
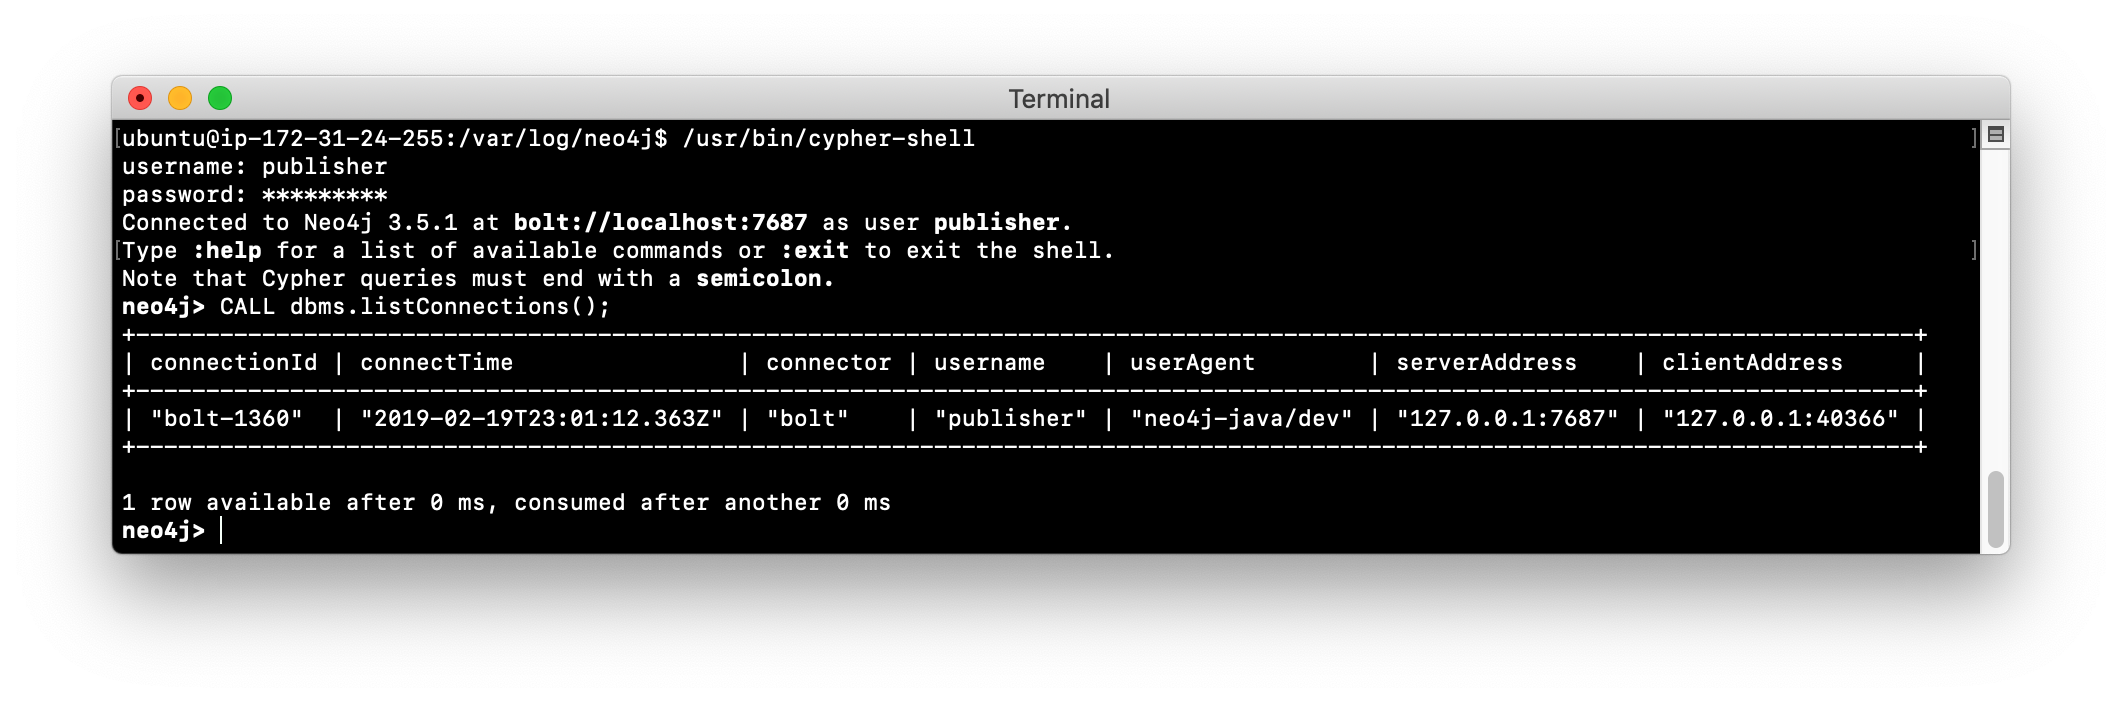
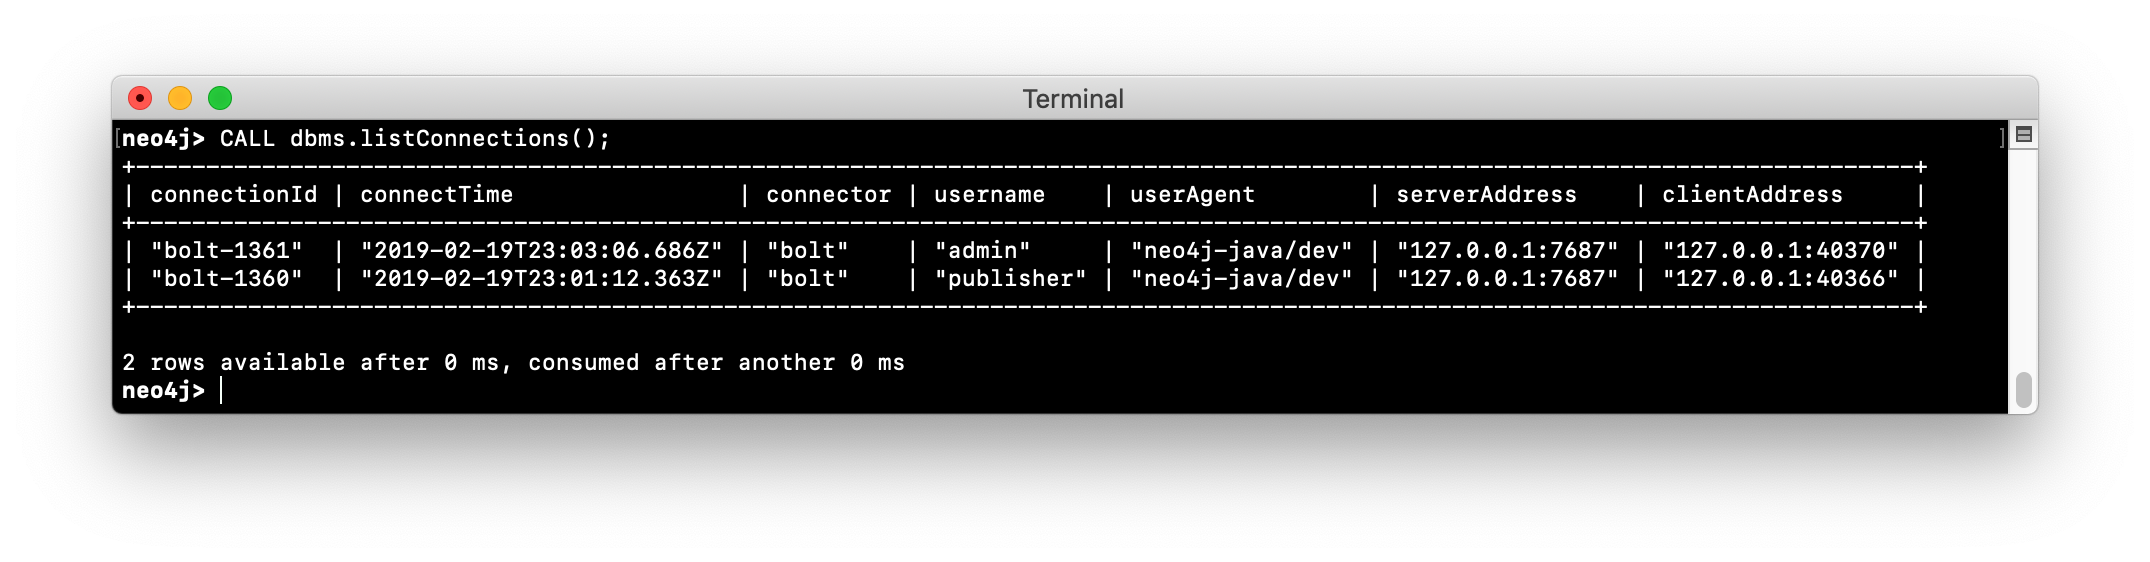
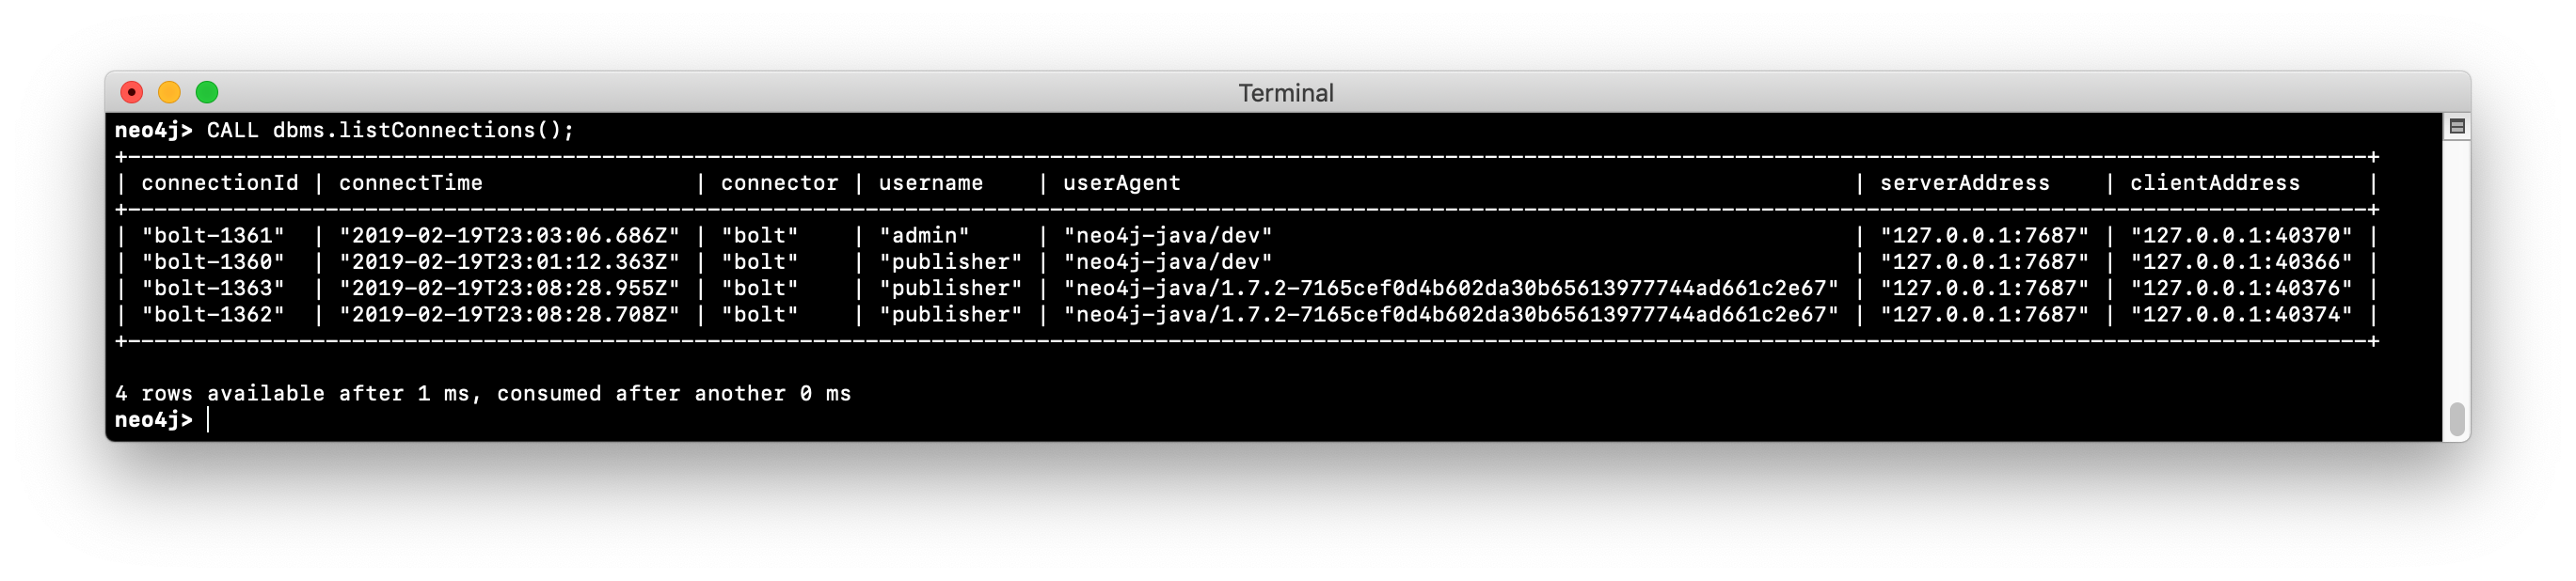
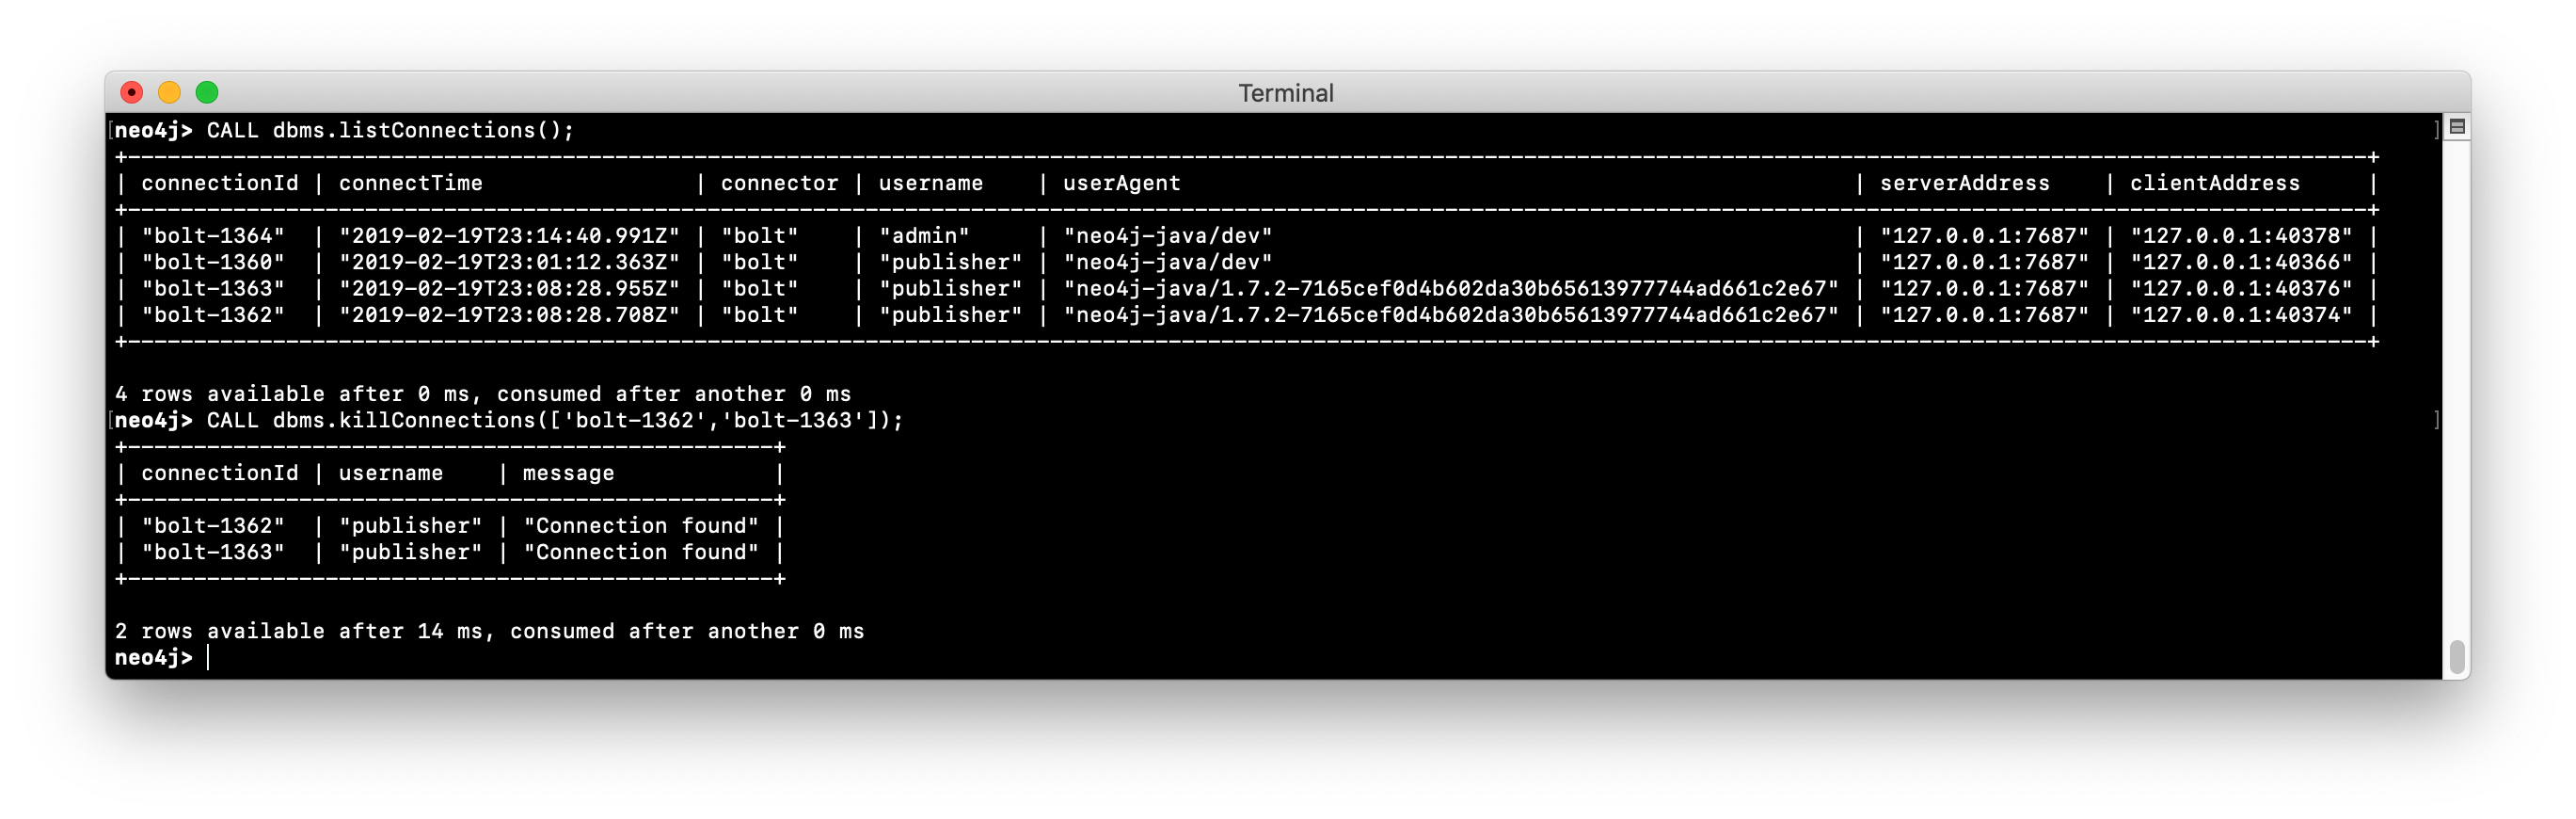
As an administrator, you can view the current connections to a Neo4j instance from cypher-shell by executing the call to dbms.listConnections():
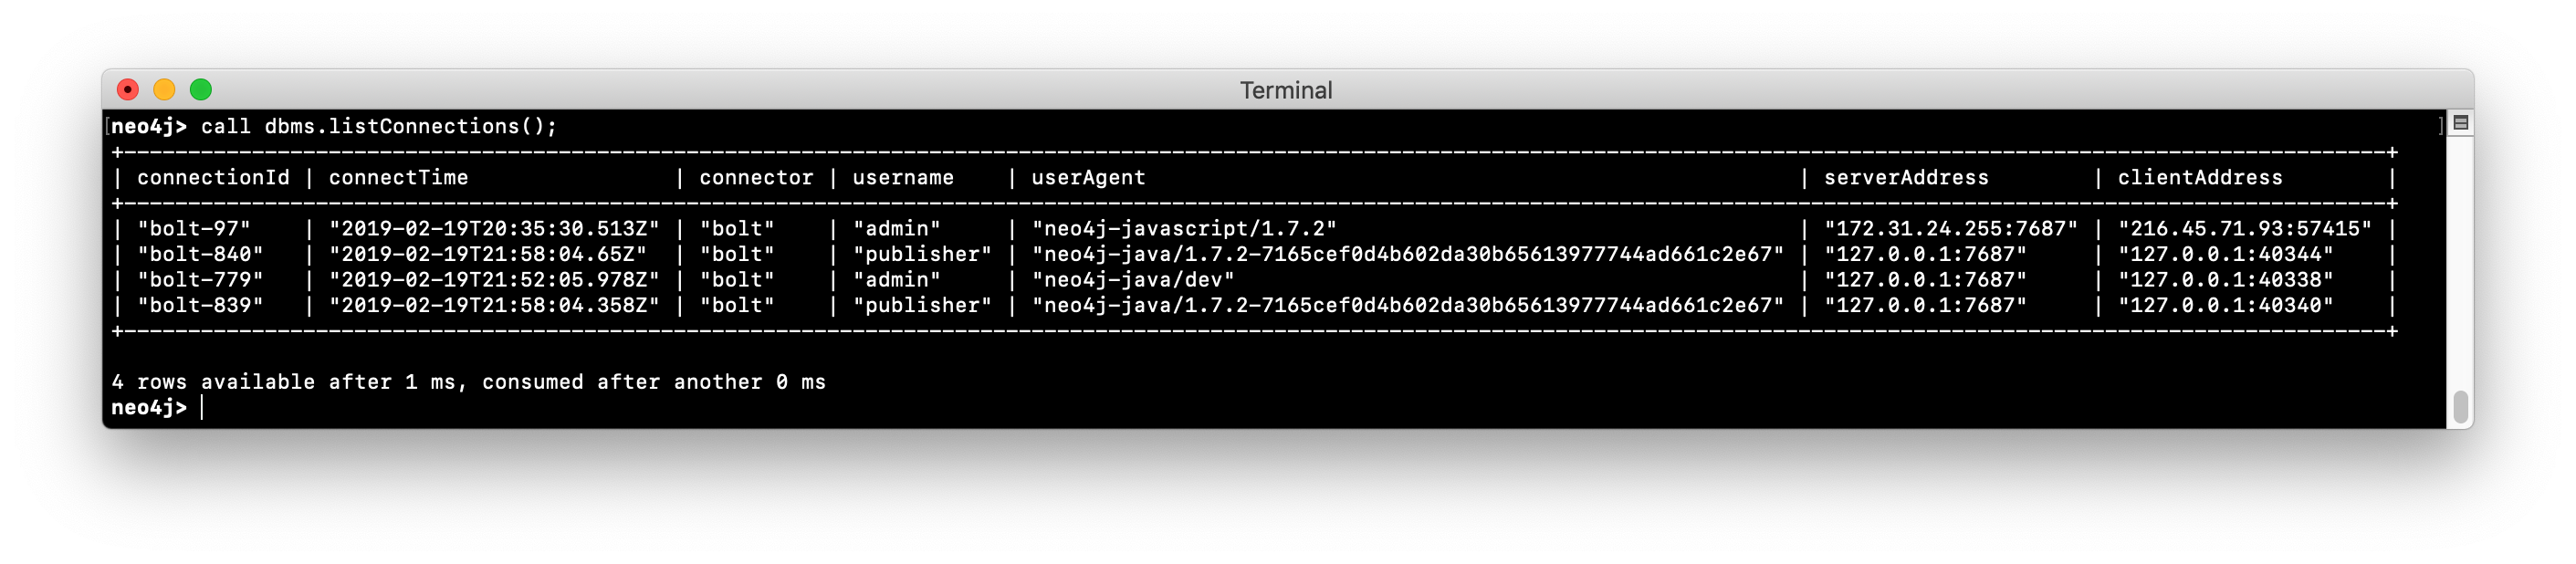
The connection with the userAgent value of neo4j-java/dev is the cypher-shell session. Any connections that are javascript are from the Web interface to Neo4j Browser. The other connections are for a java application. You could write a query to screen for connections from certain IP addresses that are forbidden. How you identify these IP addresses will depend on your security administrator for your application.
Monitoring and terminating connections
With dbms.listConnections(), you can identify a connection that:
-
has been connected to the Neo4j instance for too long a time period.
-
is from a user that you do not want connecting to the Neo4j instance.
-
is from a suspect IP address.
You terminate the connection to the Neo4j instance with a call to dbms.killConnection() where you can provide the connection ID or a comma-separated list of connection IDs with the format ['connectID-xx','connectID-yy'].
Exercise #3: Monitoring connections
In this Exercise, you access the Neo4j instance from multiple clients and monitor the connections.
Before you begin:
-
Make sure that you have exited out of any
cypher-shellsessions. -
Download the writeApp java application zip file located here.
Hint: Enter:
wget https://s3-us-west-1.amazonaws.com/data.neo4j.com/admin-neo4j/writeApp.zip -
Unzip writeApp.zip which will create the folder writeApp.
-
Make sure that write.sh has execute permissions (
chmod +x write.sh)
Exercise steps:
-
In a terminal window, log in to
cypher-shellwith the credentials admin/admin. -
Enter the Cypher statement to list all connections to the Neo4j instance.
-
In a different terminal window, log in to
cypher-shellwith the credentials publisher/publisher. -
Enter the Cypher statement to list all connections to the Neo4j instance. Do you only see the connections for your user ID?
-
In the first admin
cypher-shellsession, enter the Cypher statement to list all connections to the Neo4j instance. Do you see all of the connections?
-
In a third terminal window navigate to the writeApp folder you created when you unzipped the java application.
-
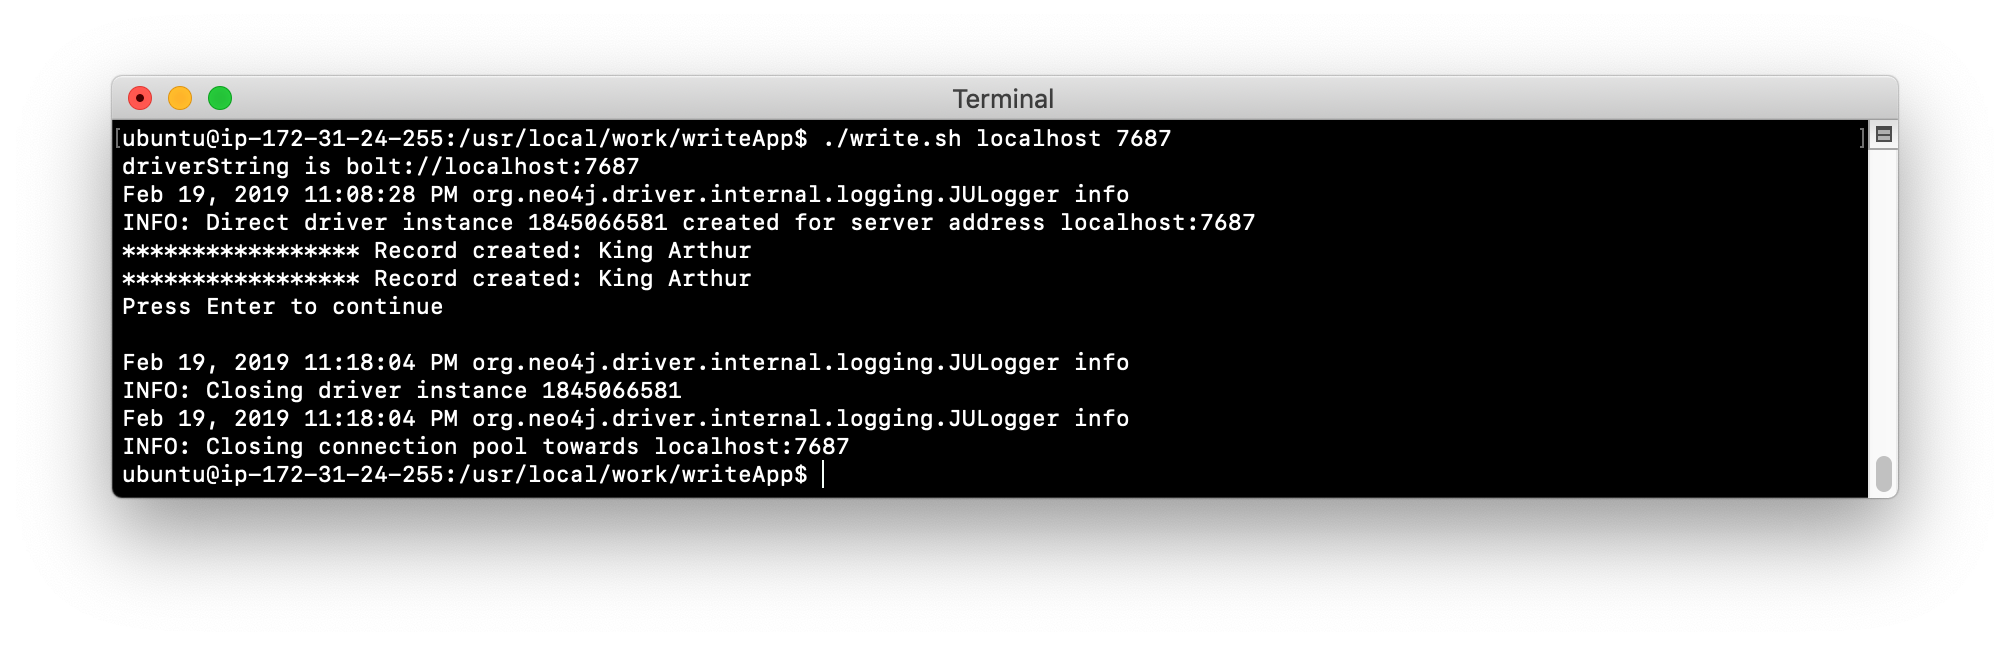
Enter
./write.sh localhost 7687. This java application will open a connection to the Neo4j instance and will ask you to press Enter to continue. Do not press Enter. -
In the admin
cypher-shellsession, enter the Cypher statement to list all connections.
-
In the admin
cypher-shellsession, enter the Cypher statement to kill the java client connections for publisher.
-
In the window where the write Java application is waiting for you to press Enter, press the Enter key. You will see a message that the connection was closed.
Logging HTTP requests
You may want to monitor requests that come into the Neo4j instance from browser clients as these types of requests are typically not part of an application, but rather a user connecting to the server with their credentials.
You can set this property in neo4j.conf to log these requests:
# To enable HTTP logging, uncomment this line
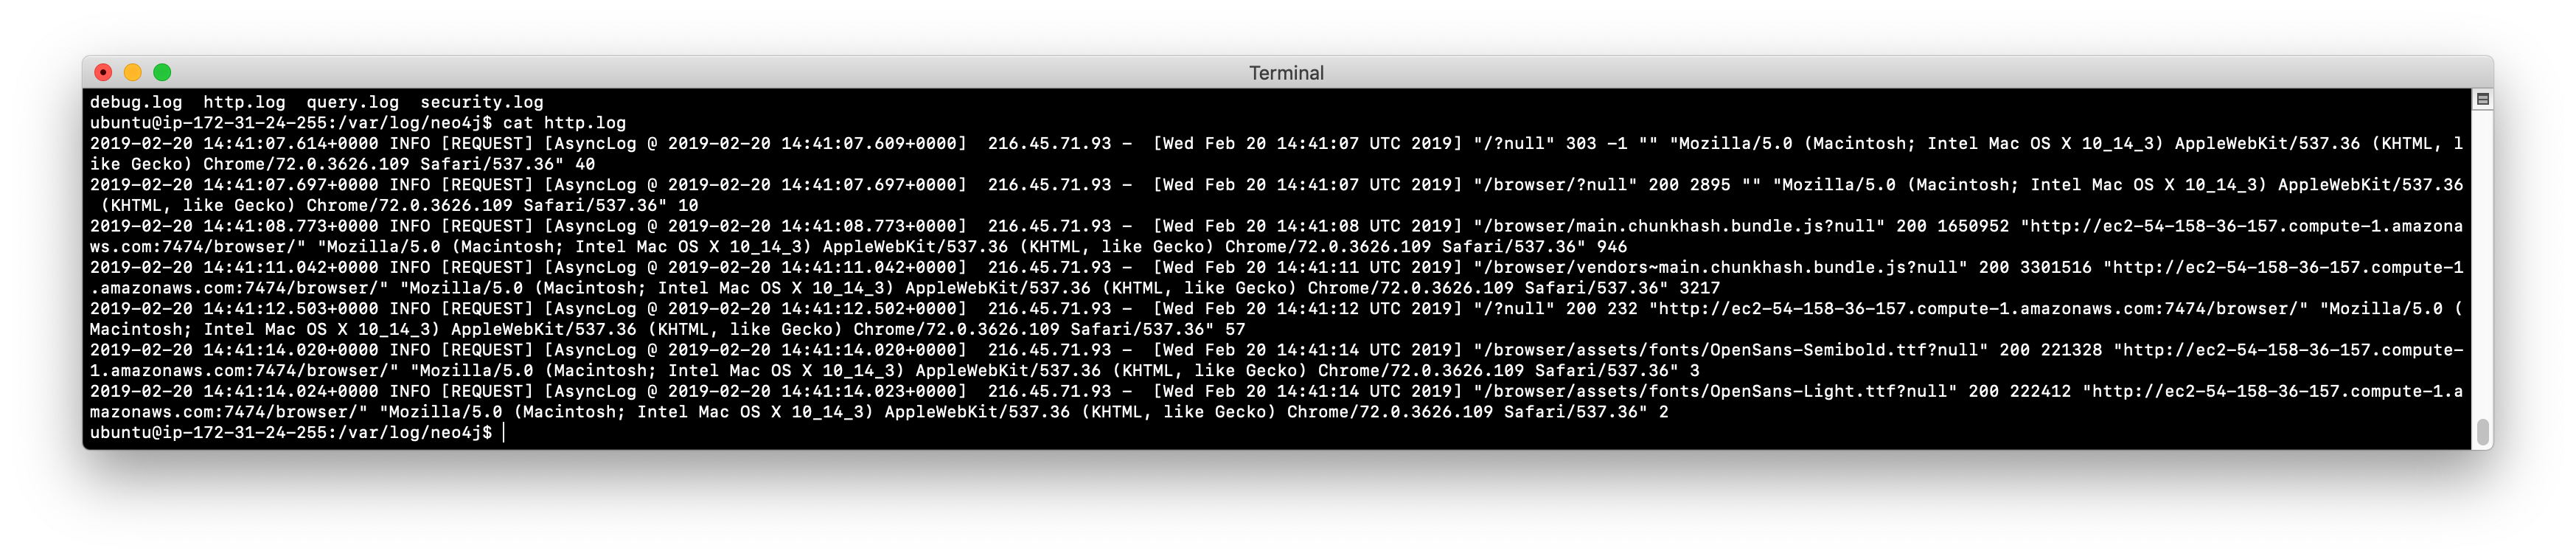
dbms.logs.http.enabled=trueWith HTTP logging enabled, you will see records for each HTTP request so you will also limit the number of log files to keep and their sizes. Part of your monitoring might be to look for certain patterns in the http.log file(s) and in particular, requests made from IP addresses that you may not want accessing the instance.
Exercise #4: Monitoring HTTP requests
In this Exercise, you enable the Neo4j instance for logging HTTP requests and monitor them.
Before you begin:
-
Make sure that you have exited out of any cypher-shell sessions.
-
Stop the Neo4j instance.
Exercise steps:
-
In a terminal window, modify the Neo4j configuration to log HTTP requests.
-
Start the Neo4j instance.
-
In a browser, connect to the Neo4j instance using port 7474. Connect to the server as reader/reader.
-
View the schema of the database by executing:
CALL db.schema(); -
View the records in the http.log file.
Monitoring memory usage
There are many properties that you can set to control how the Neo4j instance executes at runtime. The default values provided in the neo4j.conf file are useful for a small database with a small number of connections. In a production environment and in a Causal Cluster environment, you must make sure that the settings for the JVM are the best ones for your particular application.
This training does not teach about performance tuning, but it introduces you to how memory is used by a Neo4j instance and how you can perform basic monitoring of memory usage.
In a JVM, memory is consumed by a number of internal resources:
| JVM Memory Usage | Description |
|---|---|
Heap |
The heap is where your Class instantiations or “Objects” are stored. |
Thread stacks |
Each thread has its own call stack. The stack stores primitive local variables and object references along with the call stack (list of method invocations) itself. The stack is cleaned up as stack frames move out of context so there is no GC performed here. |
Metaspace |
Metaspace stores the Class definitions of your Objects, and some other metadata. |
Code cache |
The JIT compiler stores native code it generates in the code cache to improve performance by reusing it. |
Garbage Collection |
In order for the GC to know which objects are eligible for collection, it needs to keep track of the object graphs. So this is one part of the memory lost to this internal bookkeeping. |
Buffer Pools |
Many libraries and frameworks allocate buffers outside of the heap to improve performance. These buffer pools can be used to share memory between Java code and native code, or map regions of a file into memory. |
Memory consumption of a Neo4j instance
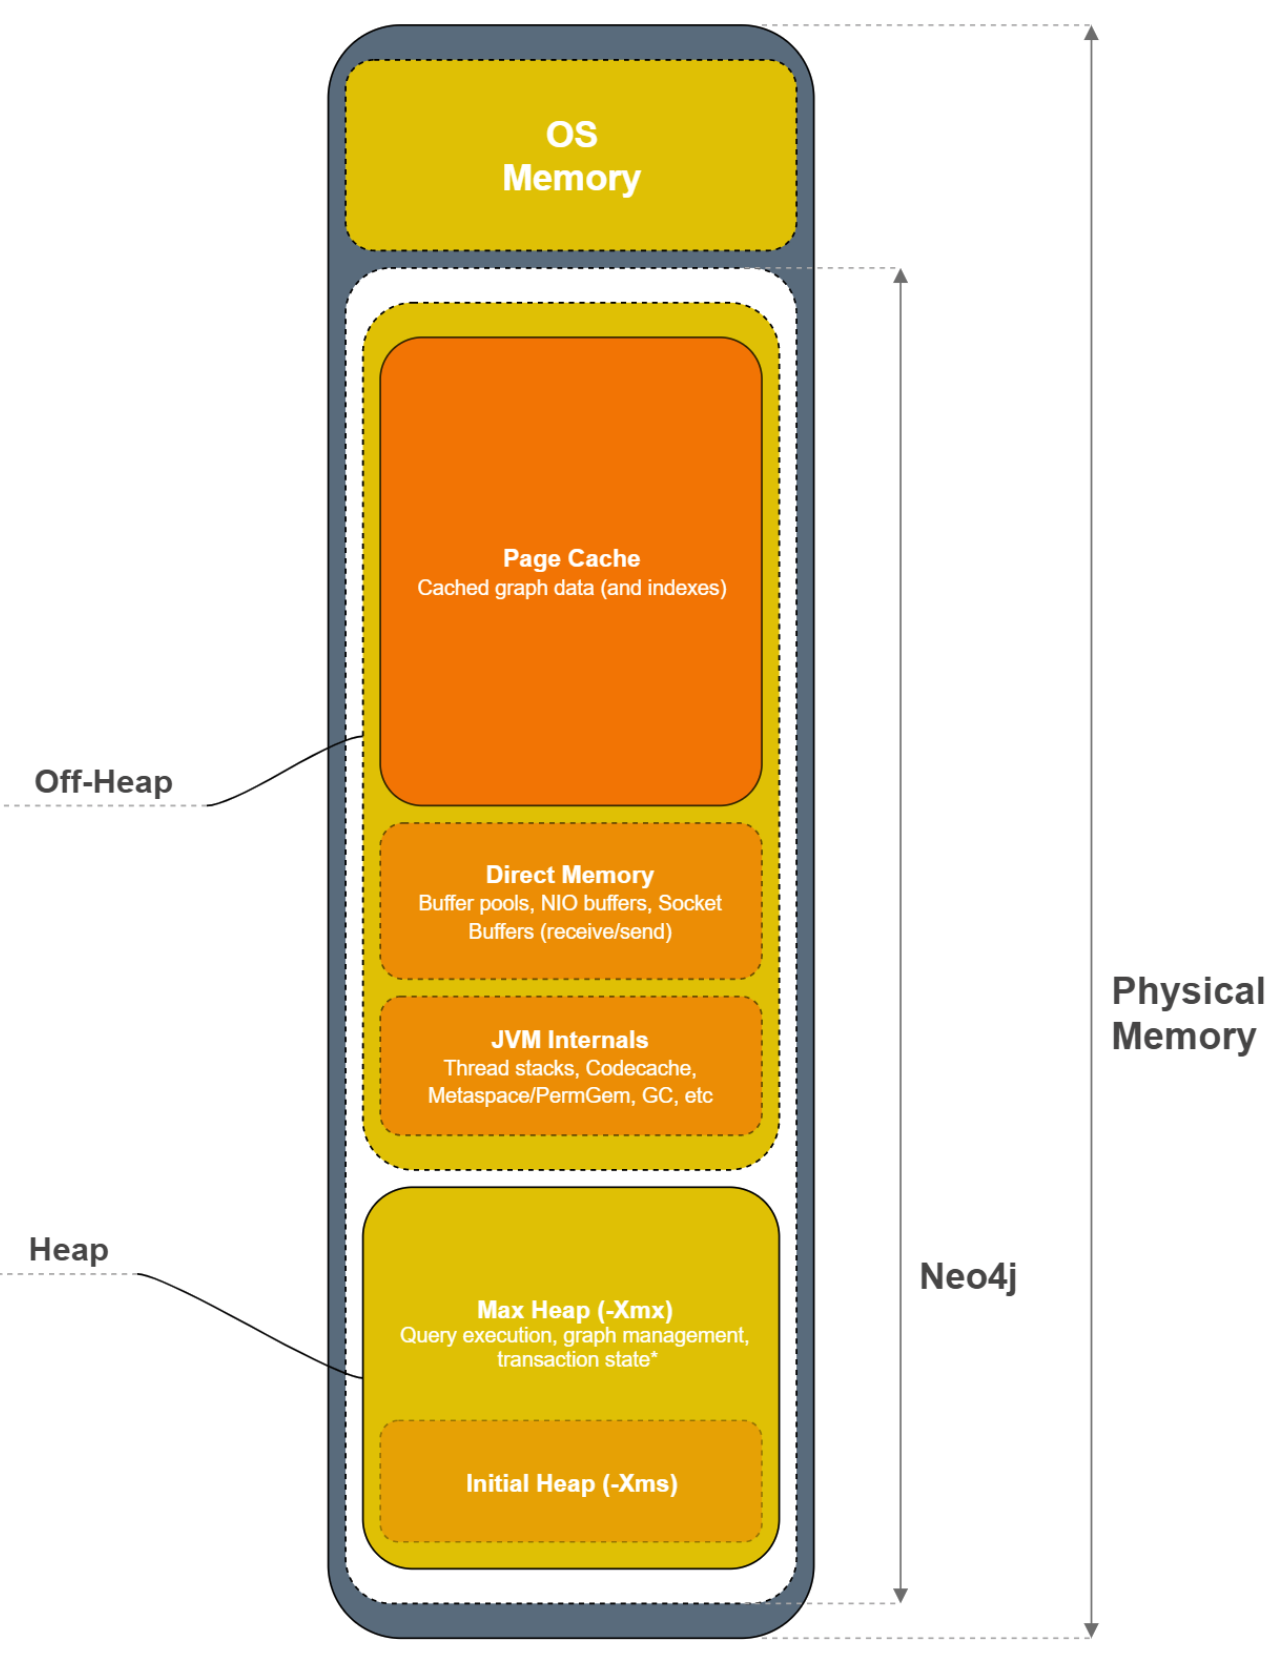
A Neo4j instance consumes memory as follows:
| Neo4j Instance Memory Usage | Description |
|---|---|
Heap |
The JVM has a heap that is the runtime data area from which memory for all class instances and arrays are allocated. Heap storage for objects is reclaimed by an automatic storage management system (known as a garbage collector or GC). |
Off-heap |
Off-heap refers to objects that are managed by EHCache, but stored outside the heap (and also not subject to GC). As the off-heap store continues to be managed in memory, it is slightly slower than the on-heap store, but still faster than the disk store. |
Page cache |
The page cache lives off-heap and is used to cache the Neo4j data (and native indexes). The caching of graph data and indexes into memory will help avoid costly disk access and result in optimal performance. |
Heap allocation is where the runtime data resides including query execution, graph management, and transaction state.
Initial memory settings for a database
The amount of memory the Neo4j instance will need may change over time and will depend on the growth of the database, as well as the number and types of queries against the database.
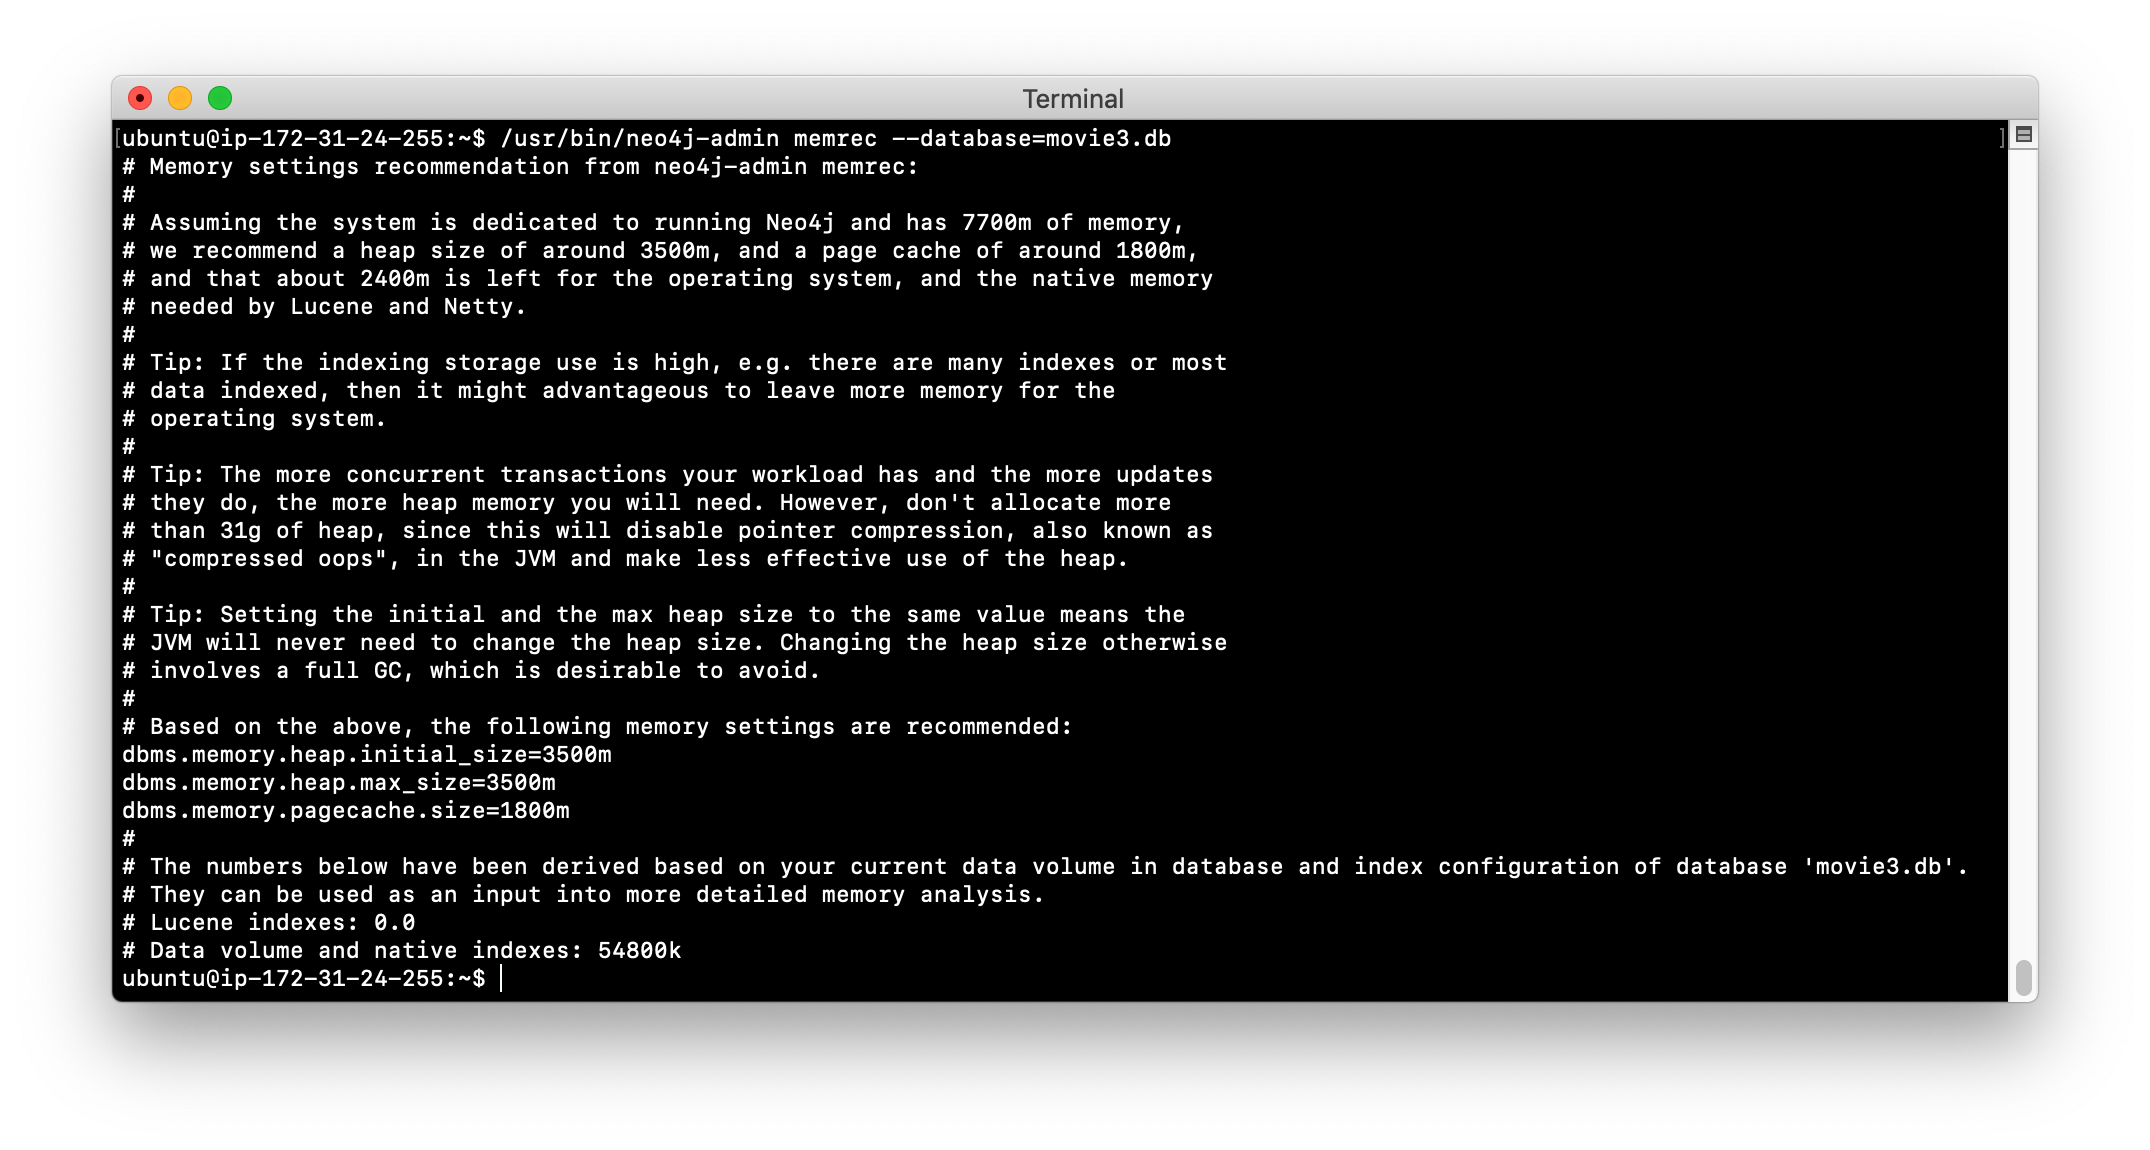
Initially, you can obtain a recommendation for property settings related to memory from information in the database using the memrec command of neo4j-admin:
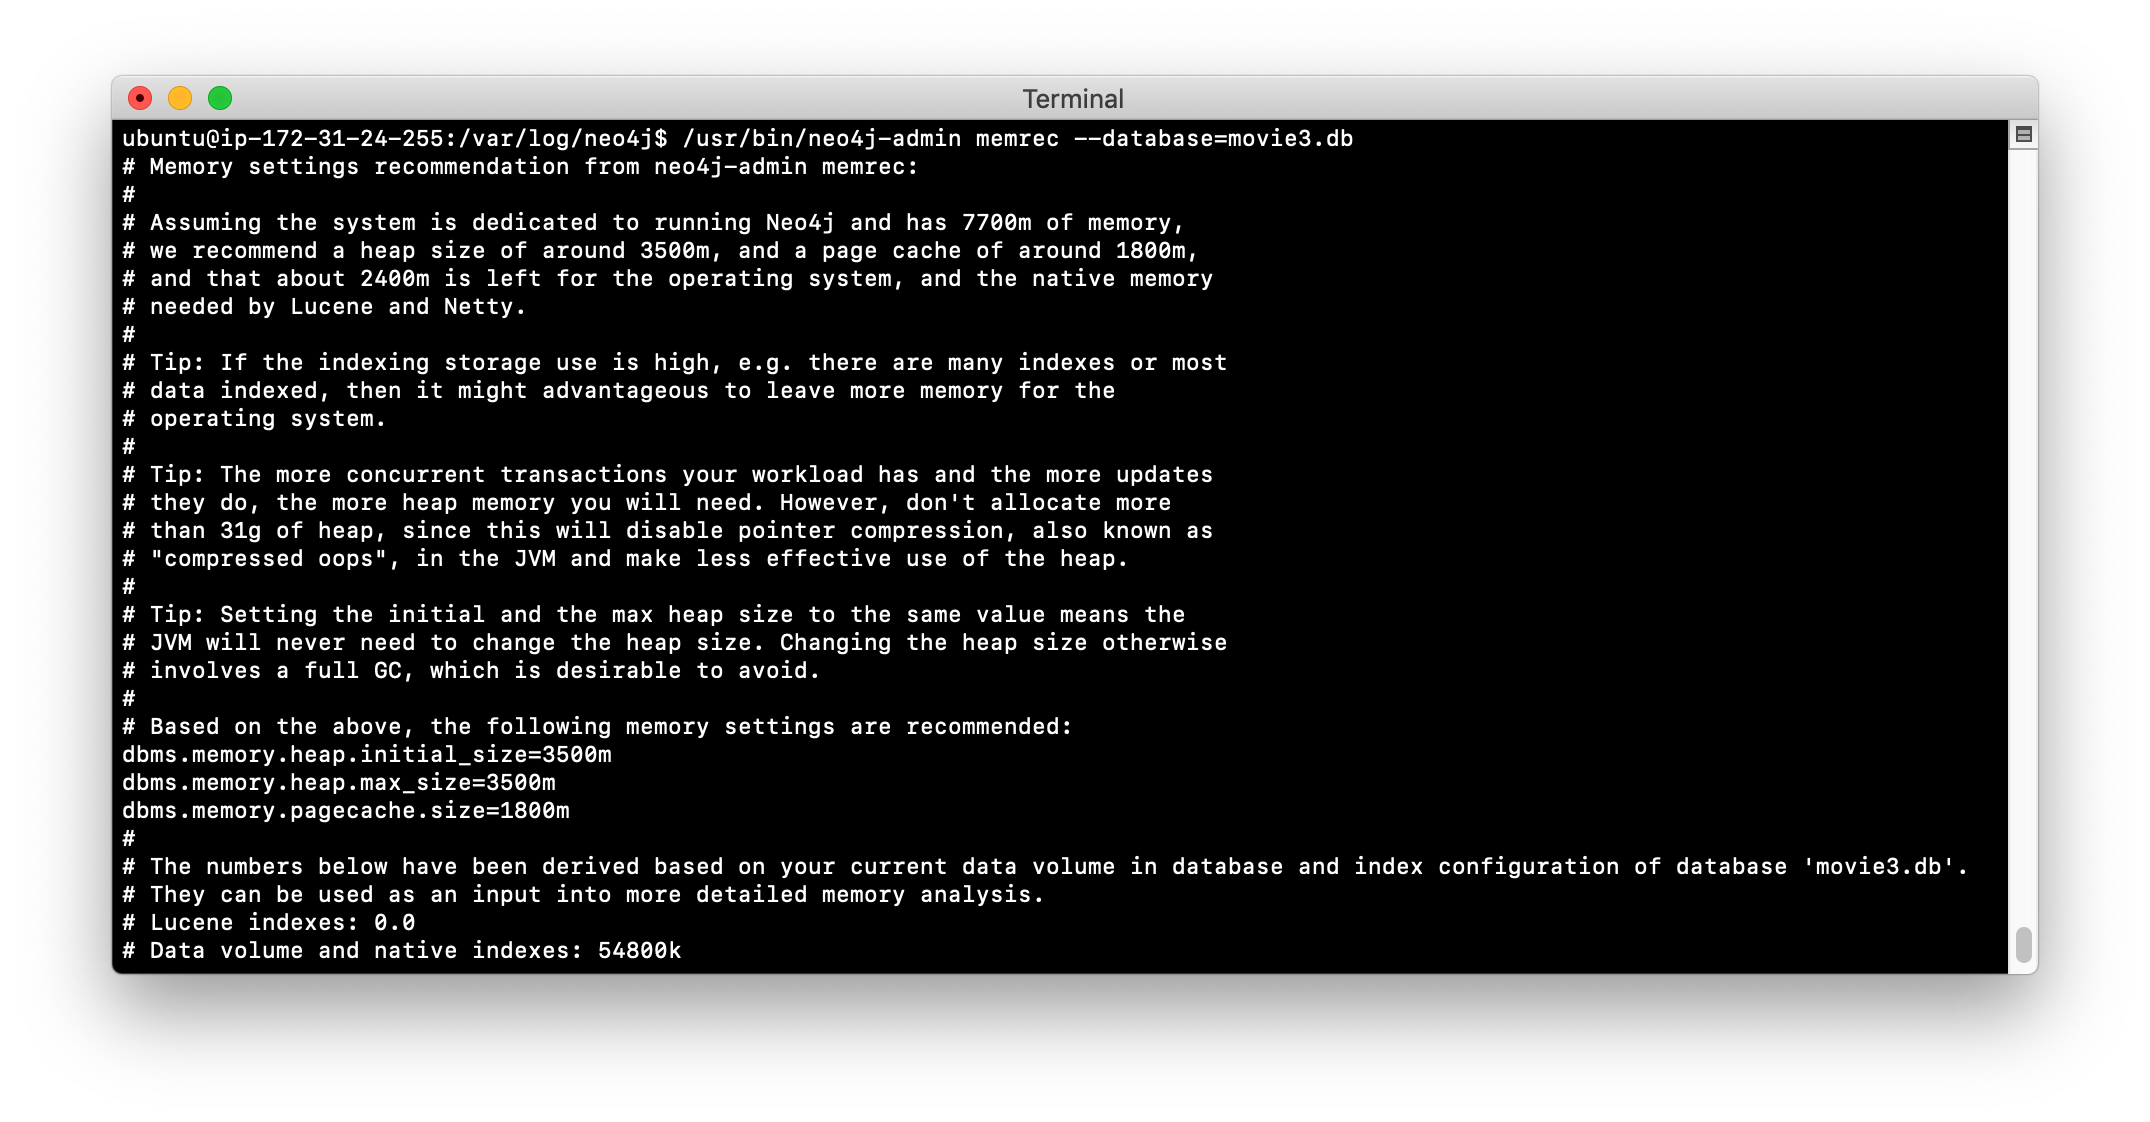
This tool provides recommended memory settings based upon information in your database and also information about available memory on your system.
Monitoring memory consumption
If you suspect that there is a memory issue with your Neo4j instance, you must temporarily turn on GC logging in the Neo4j configuration: dbms.logs.gc.enabled=true. In addition, records will be written to debug.log if an out of memory event occurs in the Neo4j instance. When trying to resolve out of memory issues with your application, you can work with Neo4j Technical Support to determine the cause and solution for the problem.
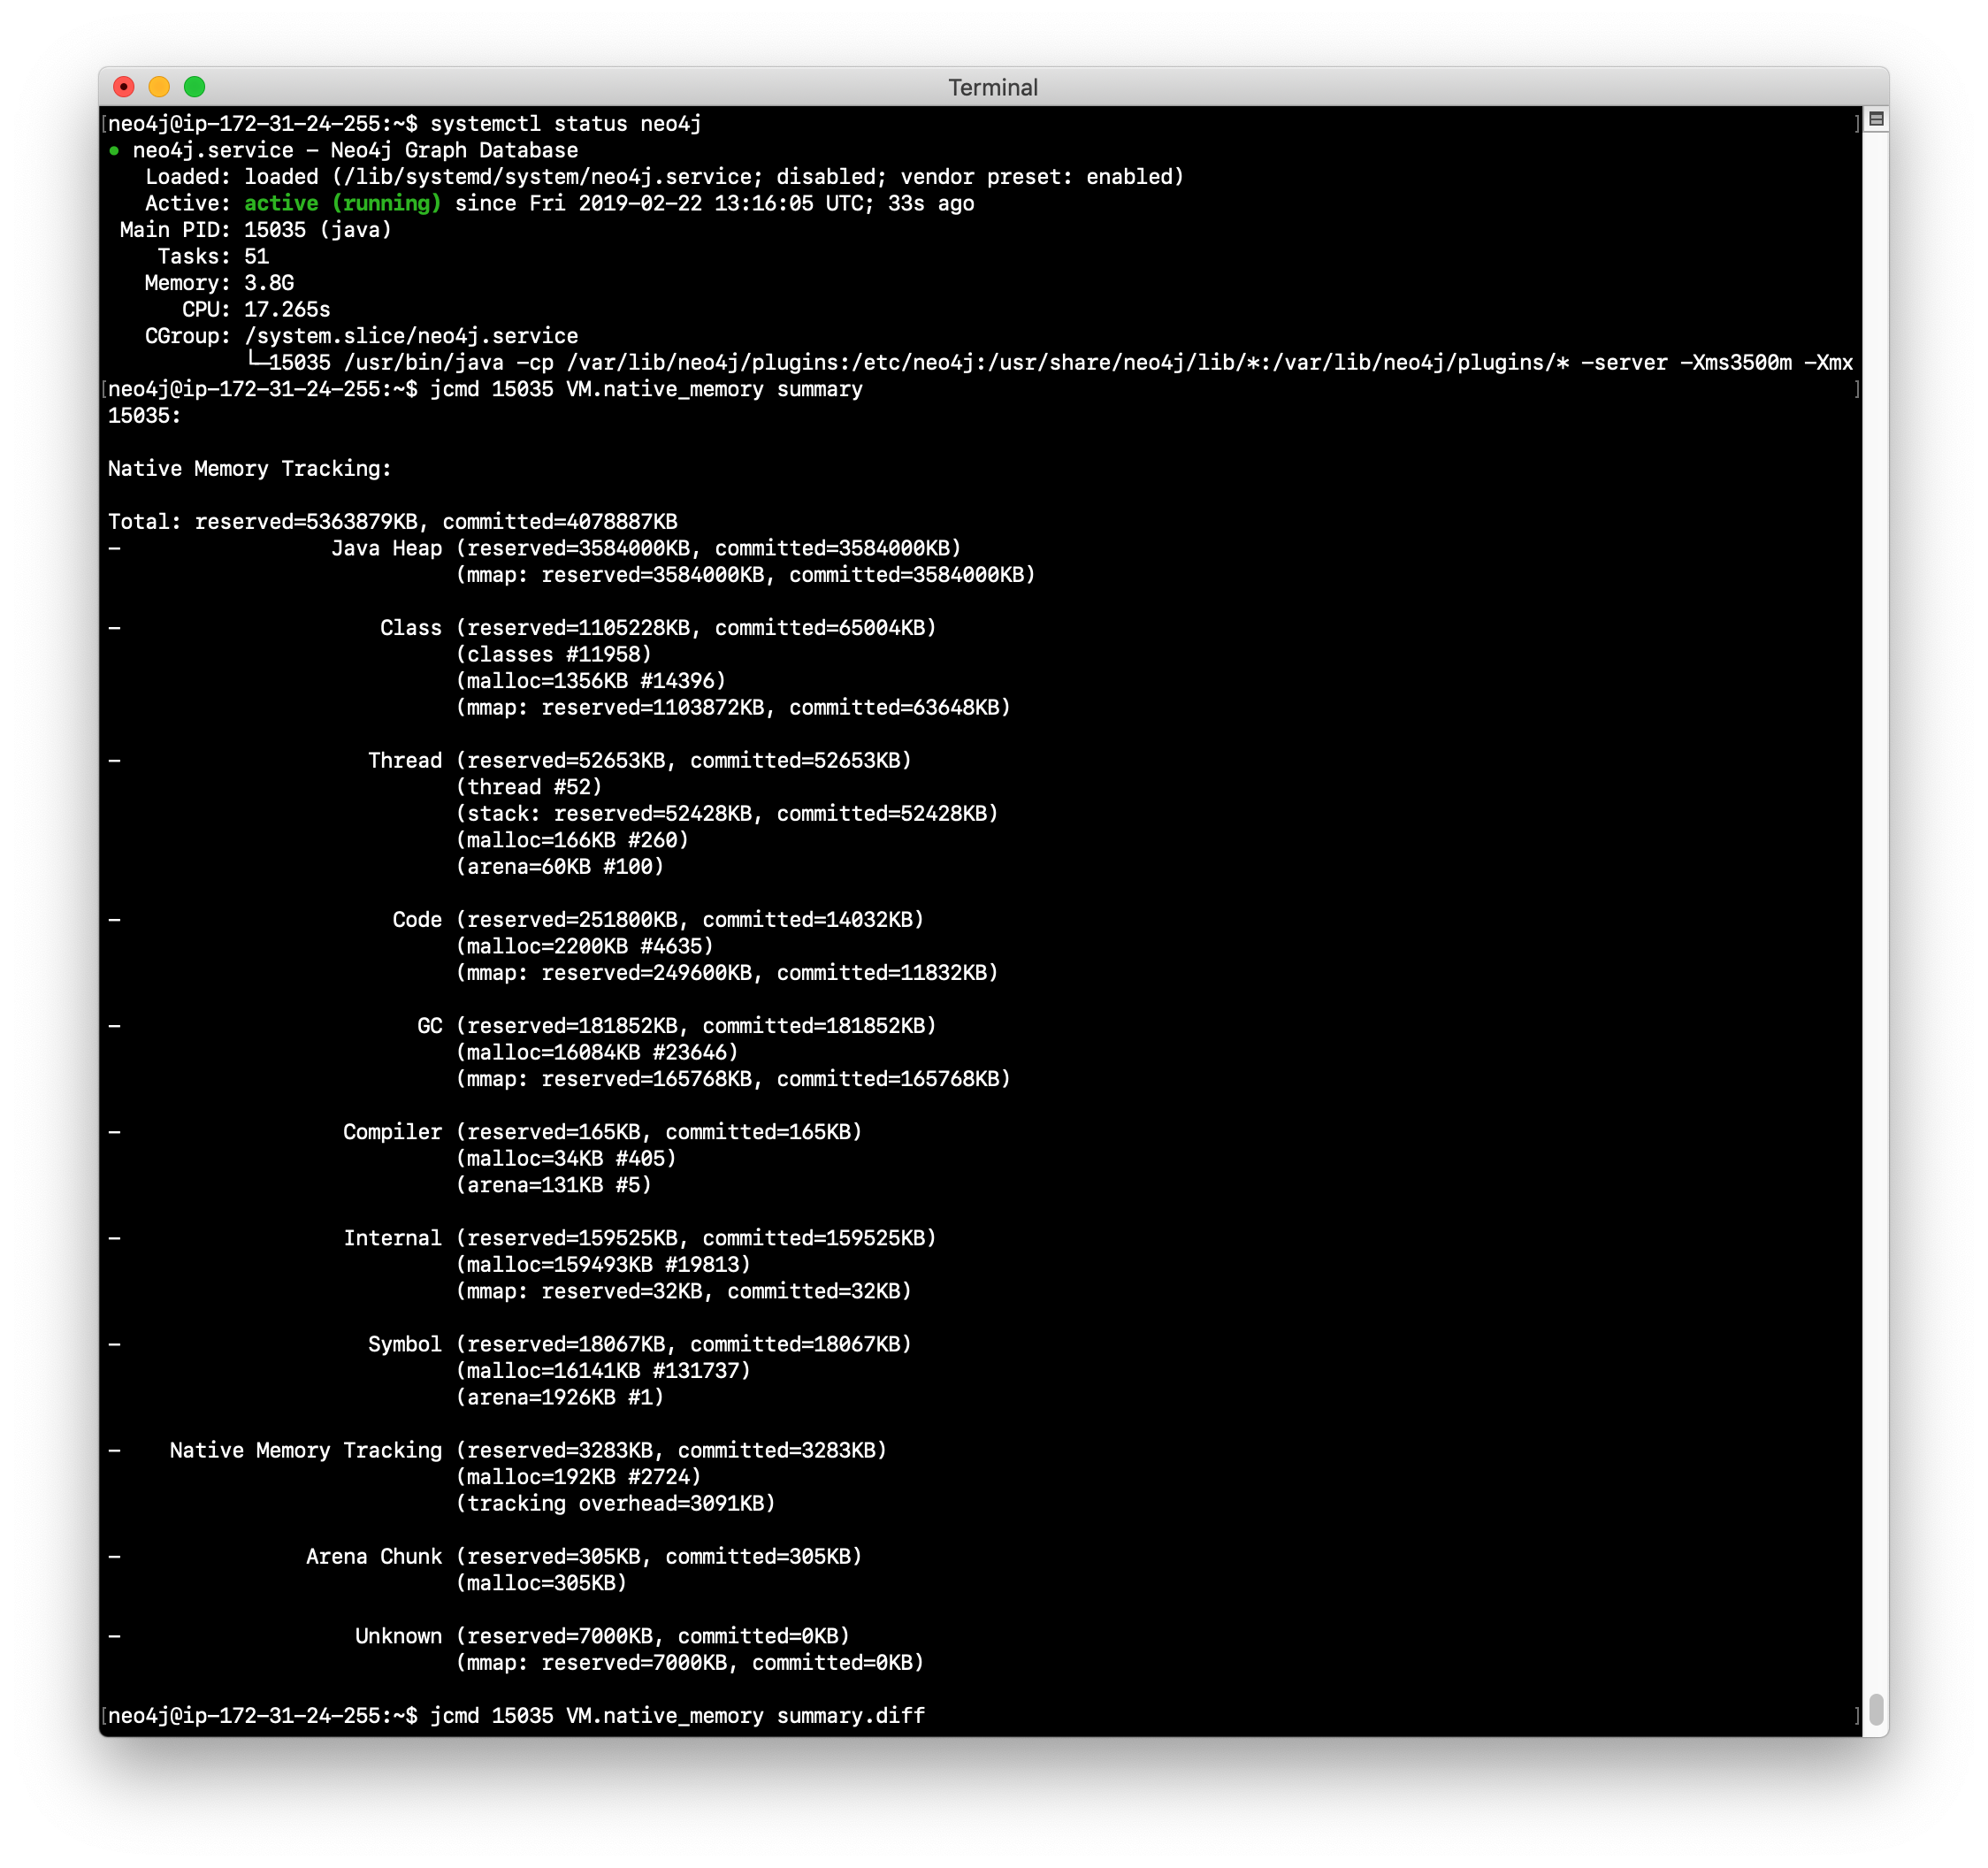
Using jcmd to obtain summary information
One way that you can monitor memory usage for a running Neo4j instance is with the jcmd utility which is described in this Neo4j KB article. To monitor memory usage with this utility, you must set dbms.jvm.additional=-XX:NativeMemoryTracking=detail in your Neo4j configuration.
Here is an example of a jcmd execution to get summary information about memory usage on the system:
Using jcmd in practice
If you suspect that certain parts of the application or a transaction is consuming too much memory, you can run jcmd to get a baseline, and then run it again to compare the differences in memory consumption as follows:
jcmd <PID for Neo4j instance> VM.native_memory baselineWait for some time during transaction, then:
jcmd <PID for Neo4j instance> VM.native_memory summary.diff
In order to use jcmd for a Neo4j instance, you must ensure that the instance is started with the dbms.jvm.additional property set and you must run it as the user neo4j. Hint: sudo su - neo4j.
|
Refer to the Neo4j Operations Manual for guidance about configuring memory, indexes, etc. for the Neo4j instance. In a production environment, you can work with Neo4j Technical Support to ensure that you are monitoring memory usage and have the appropriate settings. The Performance section of the documentation has guidelines that you consider when configuring your Neo4j instance that are beyond the scope of this training.
Exercise #5: Monitoring a memory issue
In this Exercise, you will execute a query that exhausts memory, then you will configure memory settings for the Neo4j instance and execute the query again.
Before you begin:
-
Make sure that you have exited out of any
cypher-shellsessions. -
Stop the Neo4j instance.
-
Modify the Neo4j configuration to not time out if a query takes a long time to execute. Simply comment out the settings you set previously in Exercise 2.
Exercise steps:
-
Start the Neo4j instance.
-
In
cypher-shell, connect to the Neo4j instance as publisher/publisher. -
Enter the following Cypher statement that will attempt to create 1.3 million Person nodes:
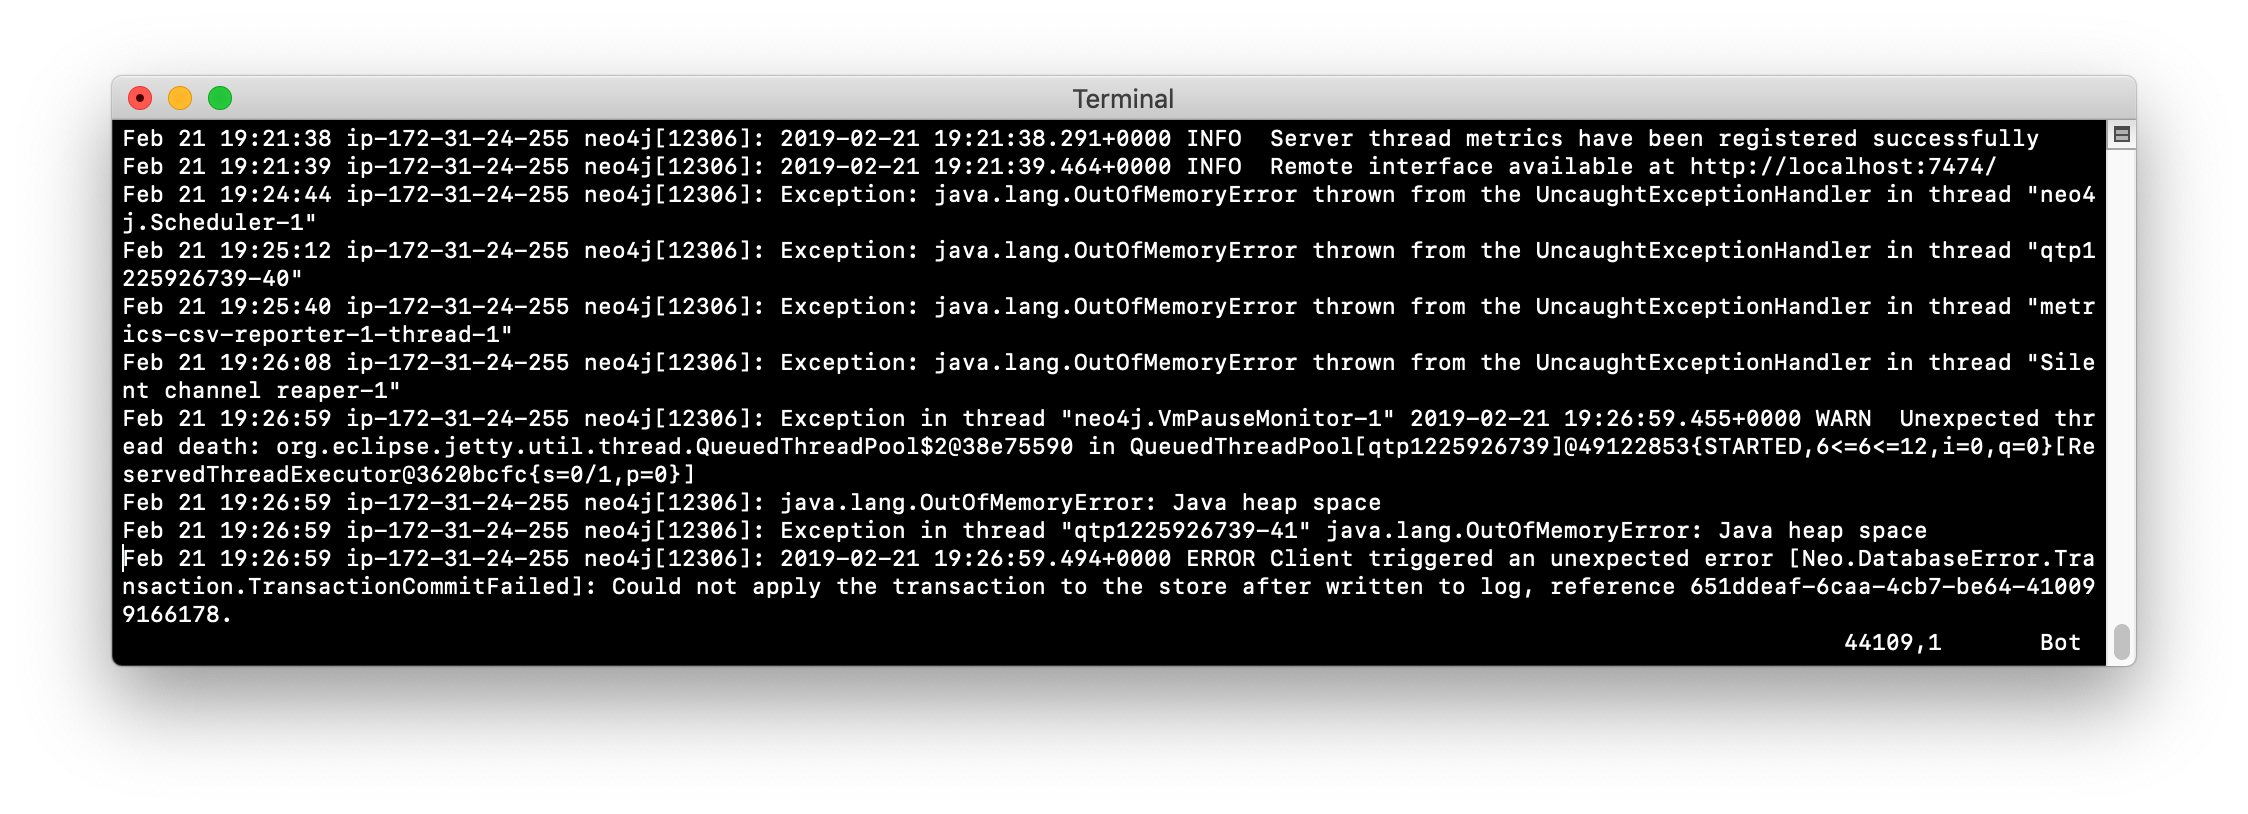
FOREACH (i IN RANGE(1,1300000) | CREATE (:Person {name:'Person' + i})); -
Wait a few minutes. Eventually, you will receive an error.
-
View the the Neo4j log Hint:
journalctl -e -u neo4jon Debian. It will also have an error logged as well as an error in debug.log.
-
Exit out of
cypher shell. -
Stop the Neo4j instance. It may take a few minutes to stop the Neo4j instance as it is cleaning up the transaction log.
-
Execute the command to display the memory requirements for your system specifying the current database which is movie3.db.
-
If we want to add 1.3 million nodes to this database, we need to adjust the memory requirements to be at a minimum what we see from
memrec. In neo4j.conf, modifydbms.memory.heap.initial_size,dbms.memory.heap.max_size, anddbms.memory.pagecache.sizevalues to reflect what you see frommemrec. Make these changes in neo4j.conf. -
Restart the Neo4j instance. This may take a few minutes because the Neo4j instance is cleaning up the transaction log from the previous failed transaction.
-
Log in to
cypher-shellas publisher/publisher and try the Cypher statement again that creates 1.3 million nodes.
Exercise 5: Taking it further:
Perform the above steps while using jcmd to monitor memory consumption.
In your production application, you must work with developers and users of the application to understand the size of the transactions. You may need to temporarily set the heap and pagecache sizes higher during a special operation. In most cases, you will set these properties to a value that will be sufficient for all transactions. You must work with Neo4j Technical Support if you run into problems with running out of memory or even with starting the Neo4j instance. If the heap and pagecache sizes are too large, the Neo4j instance will not start.
Managing log files
As an administrator, you will configure the Neo4j instance to log at the appropriate levels. In most production environments, you will archive log files so that they may be viewed at a later time as part of an auditing process or to troubleshoot a problem. Each type of log file (if configured to use) must have its maximum size defined, as well as the number of log files to keep.
# Number of HTTP logs to keep.
#dbms.logs.http.rotation.keep_number=5

# Size of each HTTP log that is kept.
#dbms.logs.http.rotation.size=20m

# Number of query logs to keep.
#dbms.logs.query.rotation.keep_number=5

# Size of each query log that is kept.
#dbms.logs.query.rotation.size=20m

# Number of GC logs to keep.
#dbms.logs.gc.rotation.keep_number=5

# Size of each GC log that is kept.
#dbms.logs.gc.rotation.size=20m

# Size threshold for rotation of the debug log. If set to zero then no rotation will occur. Accepts a binary suffix "k",
# "m" or "g".
#dbms.logs.debug.rotation.size=20m

# Maximum number of history files for the internal log.
#dbms.logs.debug.rotation.keep_number=7

# Threshold for rotation of the security log.
#dbms.logs.security.rotation.size=20m

# Minimum time interval after last rotation of the security log before it may be rotated again.
#dbms.logs.security.rotation.delay=300s

# Maximum number of history files for the security log.
#dbms.logs.security.rotation.keep_number=7
Collecting metrics
The Neo4j instance automatically collects metrics in the default location for metrics (for example, on Debian, all metrics are placed in /var/lib/neo4j/metrics). If for some reason, you do not want metrics collected, you can disable them by setting metrics.enabled=false in the Neo4j configuration.
Metrics are collected in CSV format by default on disk, but Neo4j supports Graphite and Prometheus as protocols to publish those metrics to remote services. A typical way that customers set this up is to configure Prometheus and then have some external service pull the metrics as needed from Neo4j. In this way, you don’t need to set anything up around CSV metrics, but you can readily integrate Neo4j with any other monitoring application that can utilize Prometheus or Graphite. Examples of those include Stackdriver, Grafana, and DataDog. You typically set up these remote services for 24/7 monitoring and alerting.
Your options for collecting and viewing metrics are described in the Neo4j Operations Manual which include:
-
Publishing to an endpoint using the Graphite protocol.
-
Publishing to an endpoint using the Prometheus protocol.
-
Querying the Neo4j instance using
dbms.queryJMX.
Halin has been developed for querying the Neo4j instance. Here are a couple of screen shots when using Halin for viewing metrics:
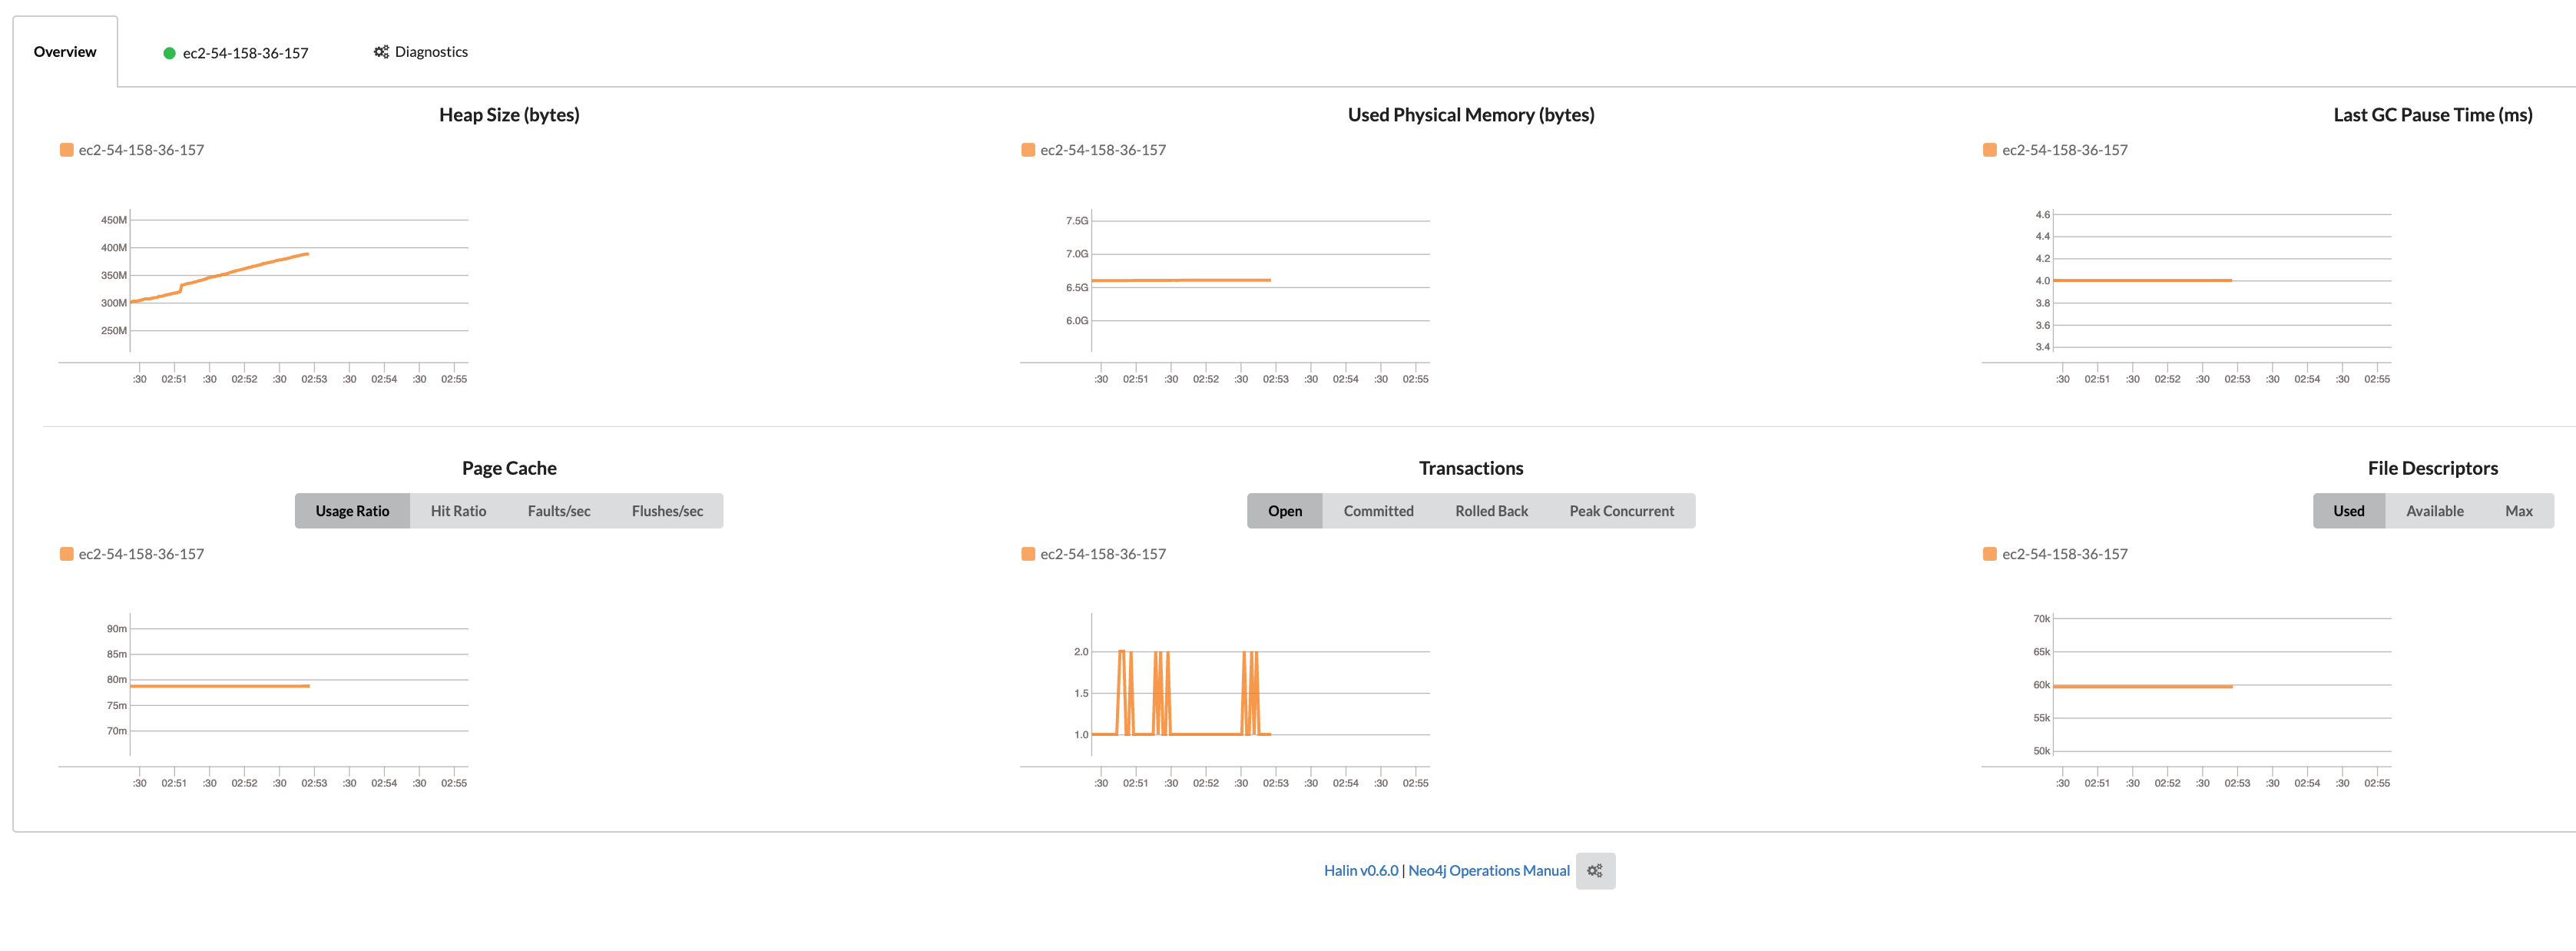
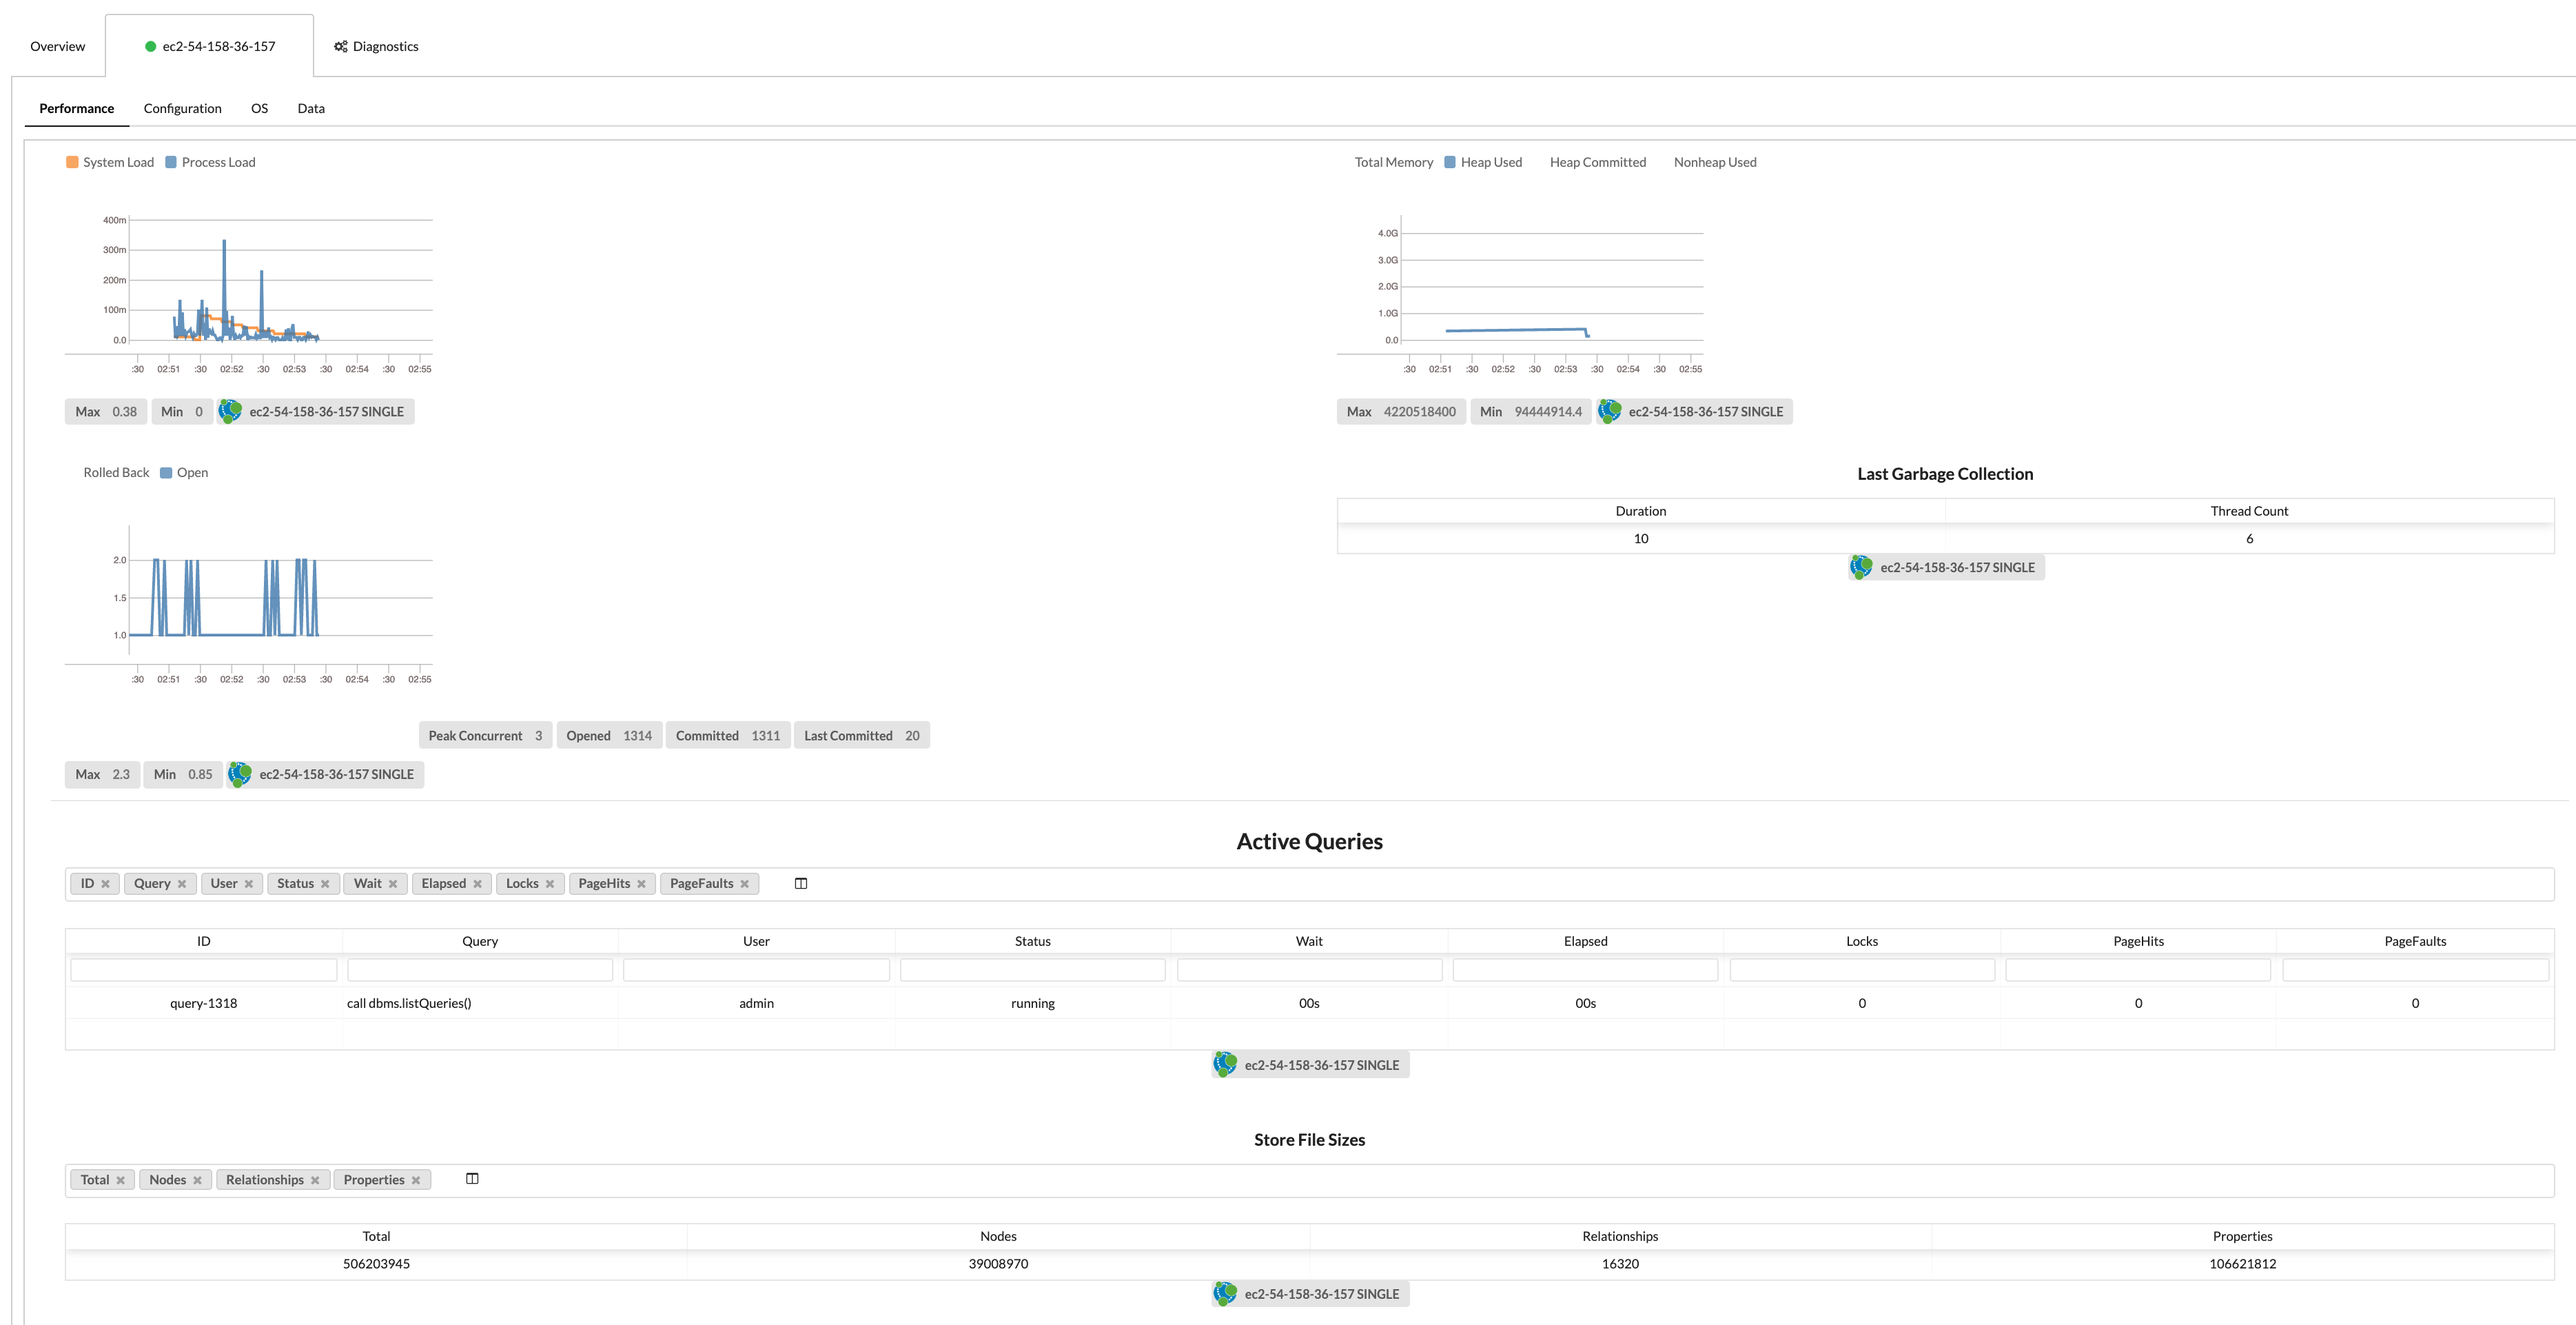
In most cases for a production environment, you will set up a remote service for monitoring and alerting, but then you may also execute ad hoc queries with a tool such as Halin.
Using JMX queries
A Neo4j instance can be monitored with Java Management Extensions (JMX). JMX is a low-level mechanism for monitoring the Neo4j instance. However, a best practice is not to use it for remote monitoring as it is a security vulnerability. In addition, running a tool such as jconsole that uses JMX can use production system resources which is also not recommended.
Neo4j supports the use of JMX in Cypher queries. This is something that is safe to do remotely and does not consume resources locally.
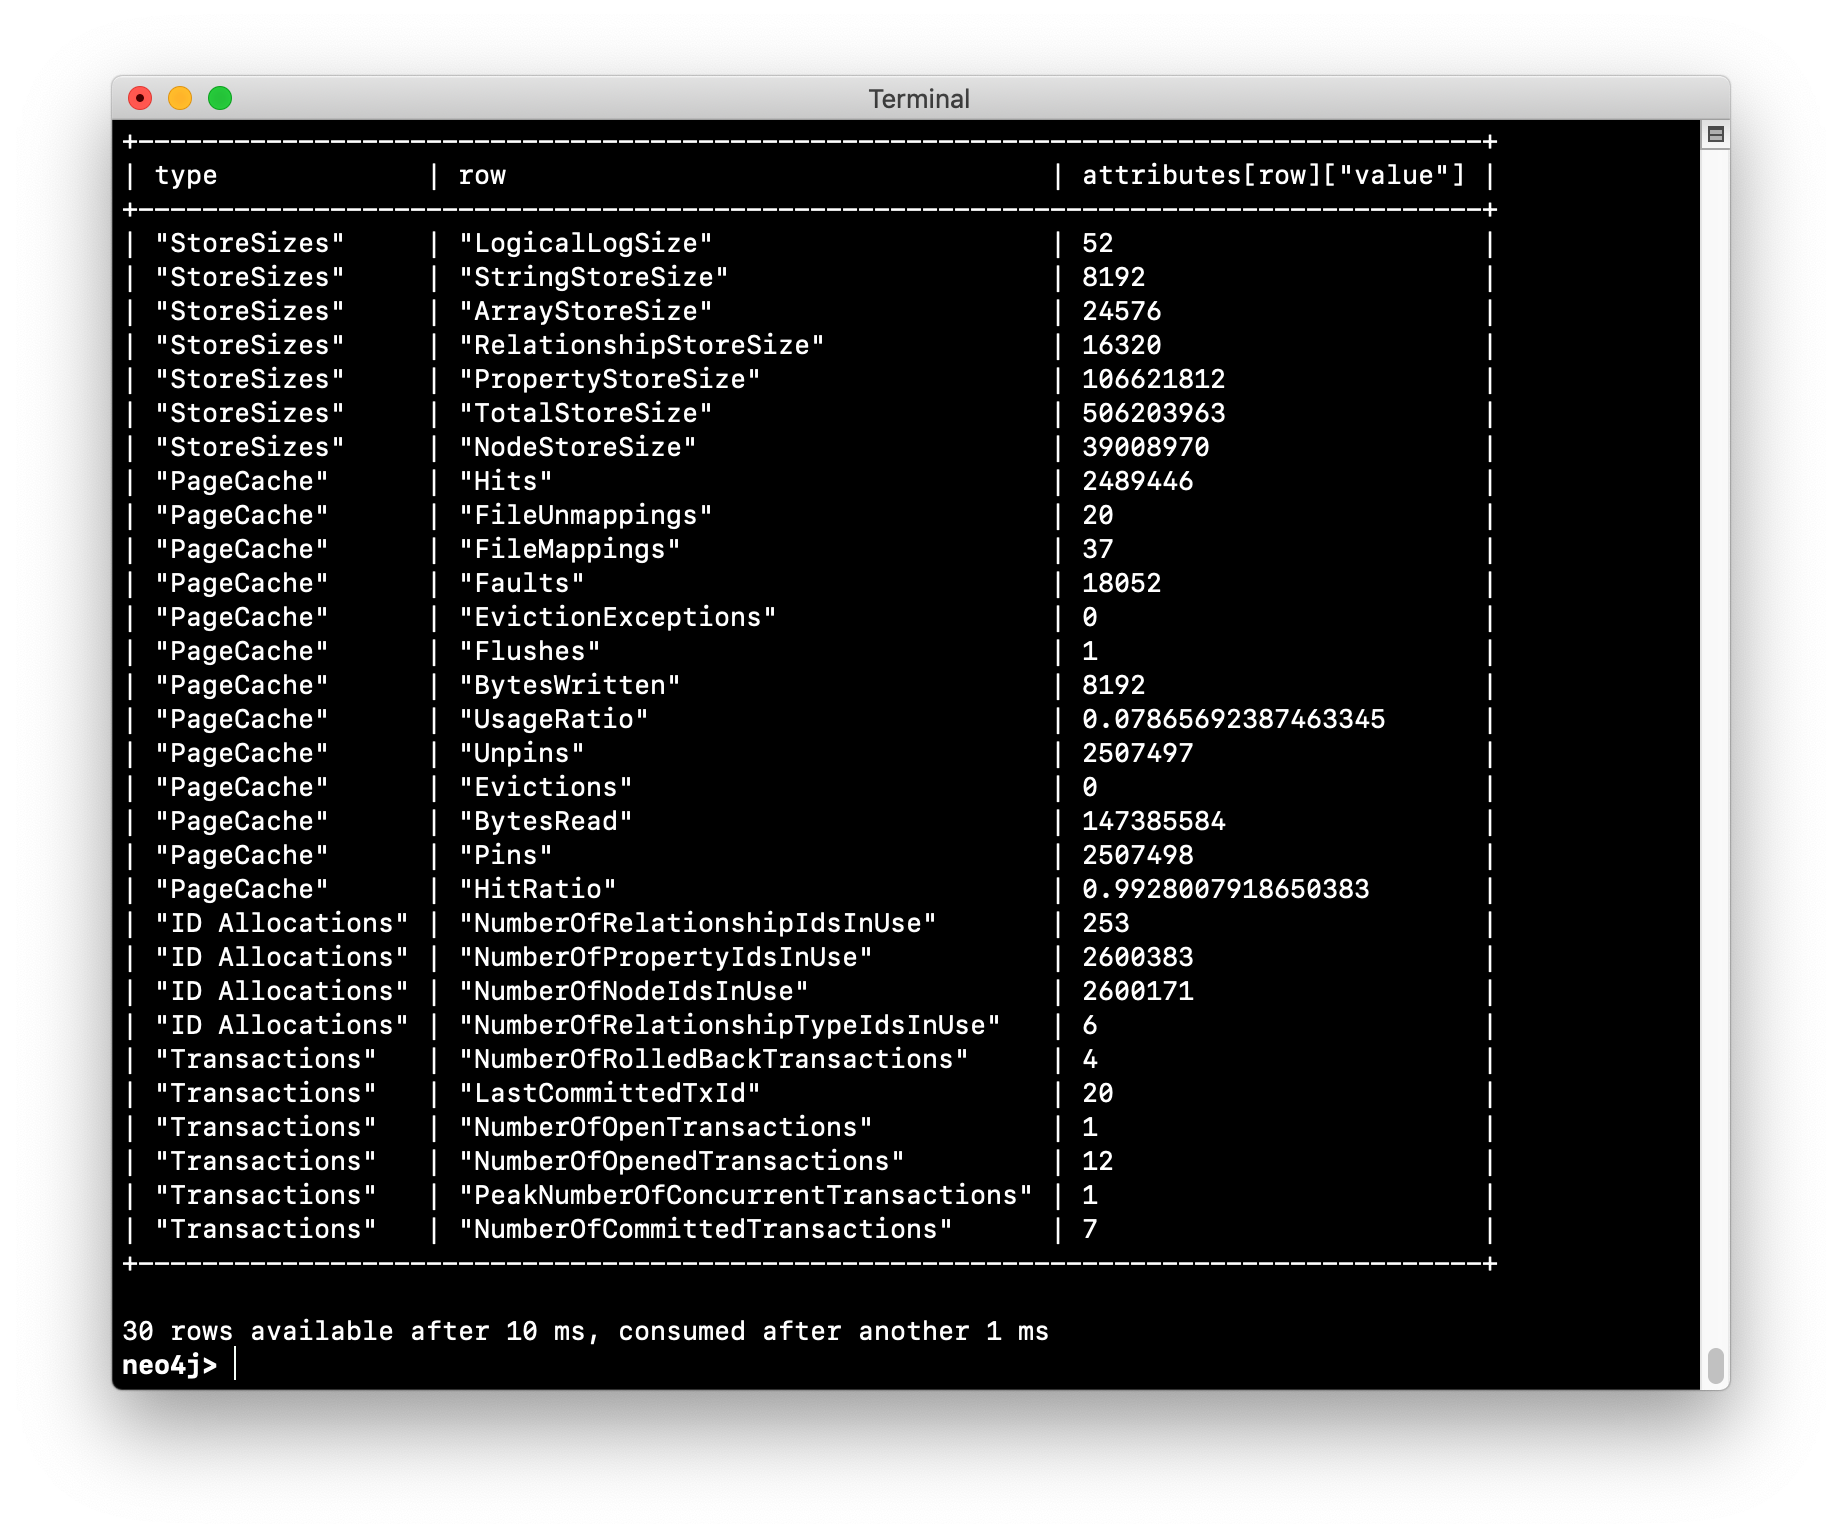
For example, here is a rather long Cypher statement that retrieves the same information that you would expect to see when you run the :sysinfo command in Neo4j Browser:
CALL dbms.queryJmx("org.neo4j:instance=kernel#0,name=Store file sizes") YIELD attributes
       WITH  keys(attributes) AS k , attributes
       UNWIND k AS row
       RETURN "StoreSizes" AS type,row,attributes[row]["value"]

UNION ALL

CALL dbms.queryJmx("org.neo4j:instance=kernel#0,name=Page cache") YIELD attributes
       WITH  keys(attributes) AS k , attributes
       UNWIND k AS row
       RETURN "PageCache" AS type,row,attributes[row]["value"]

UNION ALL

CALL dbms.queryJmx("org.neo4j:instance=kernel#0,name=Primitive count") YIELD attributes
       WITH  keys(attributes) AS k , attributes
       UNWIND k AS row
       RETURN "ID Allocations" AS type,row,attributes[row]["value"]

UNION ALL

CALL dbms.queryJmx("org.neo4j:instance=kernel#0,name=Transactions") YIELD attributes
       WITH  keys(attributes) AS k , attributes
       UNWIND k AS row
       RETURN "Transactions" AS type,row,attributes[row]["value"]

UNION ALL

CALL dbms.queryJmx("org.neo4j:instance=kernel#0,name=High Availability") YIELD attributes
       WITH  keys(attributes) AS k , attributes
       UNWIND k AS row
       RETURN "High Availability" AS type,row,attributes[row]["value"]

UNION ALL

CALL dbms.queryJmx("org.neo4j:instance=kernel#0,name=Causal Clustering") YIELD attributes
       WITH  keys(attributes) AS k , attributes
       UNWIND k AS row
       RETURN "Causal Cluster" AS type,row,attributes[row]["value"];
Here is the result of executing this Cypher statement:

Exercise #6: Querying with JMX
In this Exercise, you will execute a JMX query to view metrics about the Neo4j instance.
Before you begin:
-
Make sure you have a started Neo4j instance.
-
Open a terminal window.
Exercise steps:
-
Log in to the Neo4j instance with
cypher-shellusing the credentials publisher/publisher. -
Execute the Cypher statement shown above for querying for metrics.
-
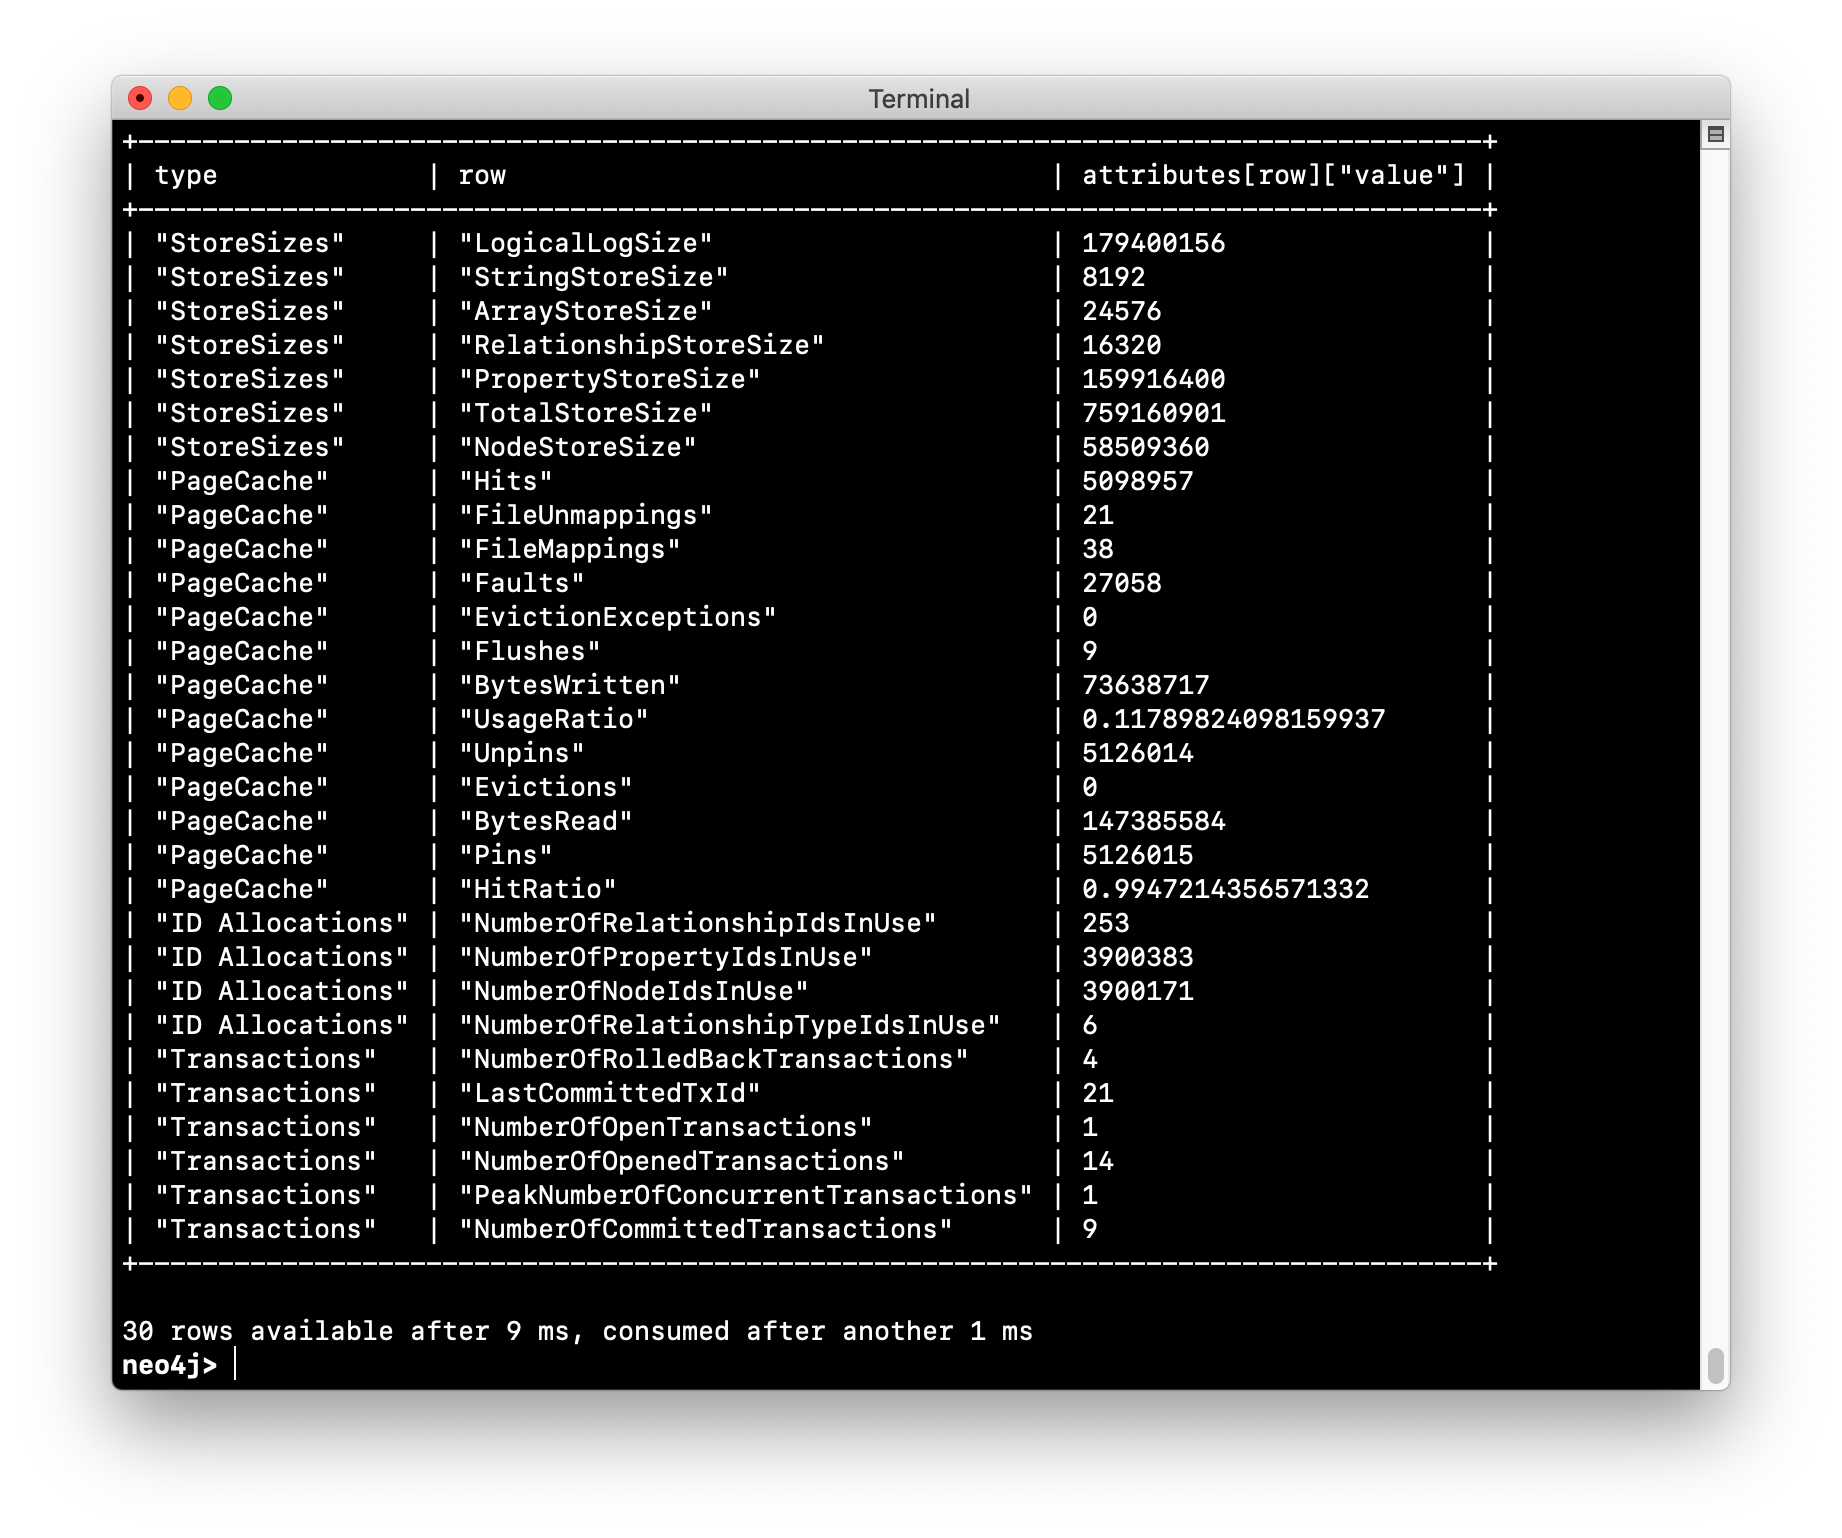
Execute the Cypher statement for creating 1.3 million nodes:
FOREACH (i IN RANGE(1,1300000) | CREATE (:Person {name:'Person' + i}));
-
Execute the Cypher statement shown above for querying for metrics.
Check your understanding
Question 1
What Cypher statements can you run to determine if a query is taking too long to execute?
Select the correct answers.
-
CALL dbms.getStats();
-
CALL dbms.listStats();
-
CALL dbms.listTransactions();
-
CALL dbms.listQueries();
Summary
You can now:
-
Describe the categories of monitoring and measurement you can perform with Neo4j.
-
Monitor:
-
queries
-
transactions
-
connections
-
memory usage
-
-
Manage log files.
-
Manage the collection of Neo4j metrics.
-
Use JMX queries.
Need help? Ask in the Neo4j Community