


We’re all paying close attention to the spread of COVID-19 and its impact on our lives. Neo4j has received a number of inquiries from the global graph community about a wide range of COVID-19-related projects. Many in the community are already using Neo4j to analyze vast amounts of connected data about people, infections, locations, drugs, local response and more to understand everything from potential treatments to modeling disruption of impacted supply chains.
We stand by our mission of “helping the world make sense of data” and are always happy to support projects that use graphs to help the world become a better place. If you’re working on graph projects that pertain to COVID-19 – from disease, vaccine and drug research to supporting local neighborhood tracking services that support at-risk groups or small businesses – we may be able to help by:
- Providing access to our commercial offerings at no cost
- Getting you the mentorship you need to get started
- Connecting you with like-minded people
- Sharing useful datasets
- Showcasing your work to get the word out
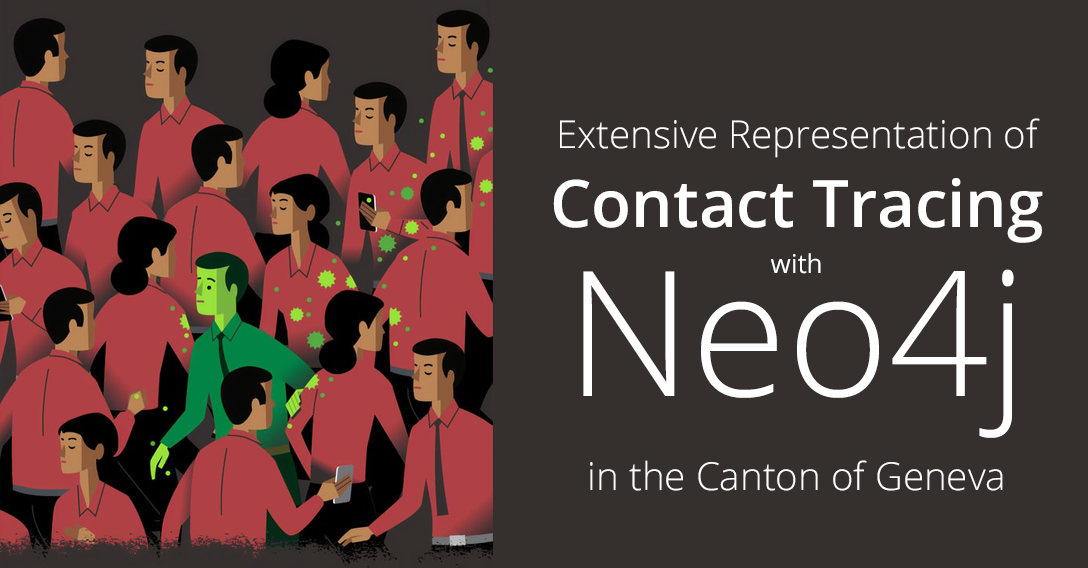
Contact Tracing
In the Geneva canton, Switzerland, the Office of the Surgeon General collects all results from laboratories performing SARS-CoV-2 testing.
Covid Graph
DZD and Researchers Connecting COVID-19 Publications to Drug Repurposing
Project Domino
COVID-19 Intervention Project Tracking Misinformation to Educate Local Communities
Hume-Covid
Using GraphAware Hume for COVID-19 Contact Tracing and Smart Quarantine
Graph.C19
Enabling Researchers to Instantly Access Integrated Knowledge from Coronavirus DataContact Tracing
COVID-19 App Notifies Contacts If You Show Symptoms or Test Positive
Guild1 Canada COVID-19 Response project
Analyzing Large, Diverse Data Streams to Address COVID-19 in Canada
Swiss Scientific COVID-19 Task Force
Swiss Government Task Force with Academic, Industry Experts Fighting COVID-19
NCovi Contact Tracing Vietnamese Government
Developing App to Help Vietnamese Government Fight COVID-19 by Tracking Direct Contact
Neoris “Health Check” App
Using Data Visualization to Track Health and Wellbeing of Employees
KINEVIZ
Graph Visualization to Explore Developing Publically Available Data on COVID-19
Against Covid-19
Graph of COVID-19 in Singapore and Crowdfunding for Other Countries