Gantt Chart
|
This documentation pertains to the unsupported version of NeoDash, as part of Neo4j Labs. For users of the supported NeoDash offering, refer to NeoDash commercial. |
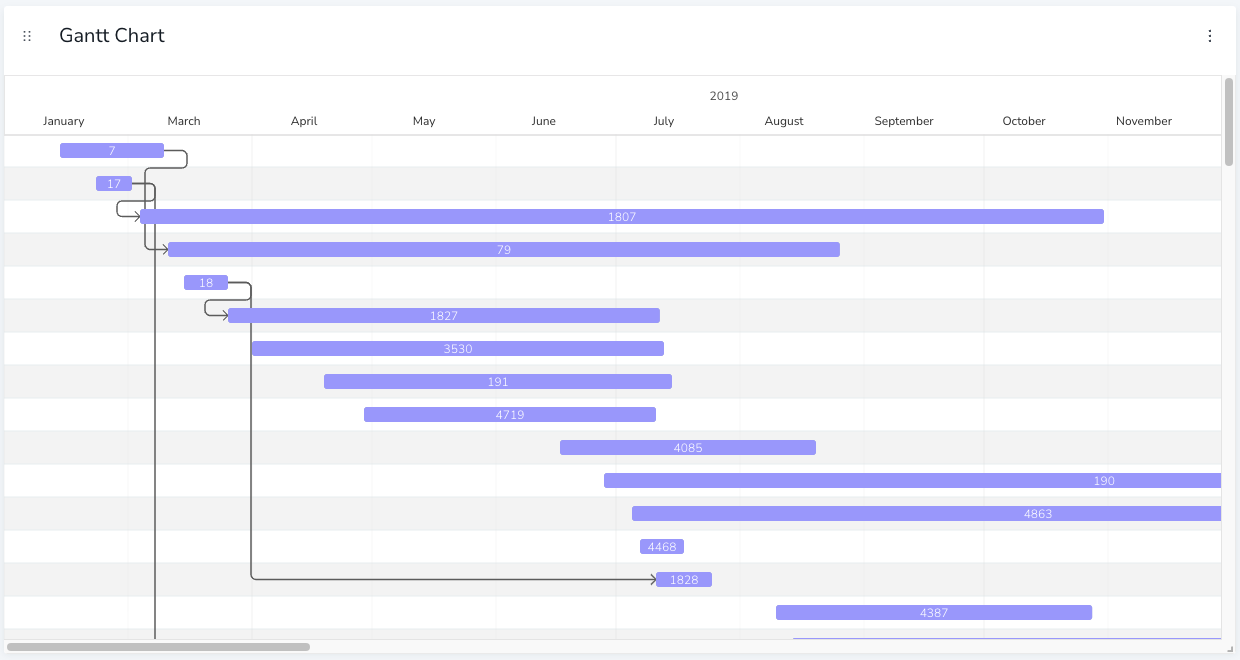
A Gantt chart can be used to visualize tasks on a timeline, as well as their dependencies. The NeoDash Gantt chart views your tasks are nodes in the graph, and your relationships are dependencies between them.
To use the Sankey chart, nodes must have at least three properties on them:
-
A
startDate -
An
endDate -
A
title
In addition, different types of task dependencies can be visualized. The dependency must be stored as a property on a relationship, and can be one of four values:
-
SE: The dependency is from the Start of the origin task, to the End of the next task. -
SS: The dependency is from the Start of the origin task, to the Sstart of the next task. -
ES: The dependency is from the End of the origin task, to the Sstart of the next task. -
EE: The dependency is from the End of the origin task, to the End of the next task.
Advanced Settings
| Name | Type | Default Value | Description |
|---|---|---|---|
Bar Color |
string |
'#a3a3ff' |
Default color for the task bars (with no style rules applied.) |
Task Label Property |
string |
'activityName' |
Node property to display on the task bar. |
Task Start Date Property |
string |
'startDate' |
Node property to use as a start date for the task. |
Task End Date Property |
string |
'endDate' |
Node property to use as an end date for the task. |
Task Ordering Property |
string |
(auto) |
Custom ordering of the tasks. Defaults to use the start date property. |
Dependency Type Property |
string |
'rel_type' |
The relationship property that stores the dependency type. Property values must be one of |
View mode |
string |
'auto' |
Zoom level of the chart. one of |
Margin Left (px) |
number |
24 |
The margin in pixels on the left side of the visualization. |
Margin Right (px) |
number |
24 |
The margin in pixels on the right side of the visualization. |
Margin Top (px) |
number |
24 |
The margin in pixels on the top side of the visualization. |
Margin Bottom (px) |
number |
40 |
The margin in pixels on the bottom side of the visualization. |
Auto-run query |
on/off |
on |
when activated automatically runs the query when the report is displayed. When set to `off', the query is displayed and will need to be executed manually. |
Report Description |
markdown text |
When specified, adds another button the report header that opens a pop-up. This pop-up contains the rendered markdown from this setting. |
Rule-Based Styling
Using the Rule-Based Styling menu, the following style rules can be applied to the Gantt chart:
-
The color of a task bar.