SumoDB in Neo4j: Chaining Multiple Graph Algorithms in Snowflake — Part 3
Senior Developer Advocate at Neo4j
10 min read
Previously we showed how its possible to run Graph Analytics directly in snowflake using our Sumo Dataset from https://sumodb.sumogames.de/Default.aspx. Our analysis highlighted how using only the structure of sumo matches we can discover the approximate rank/community of a wrestler based on the other wrestlers they faced using Louvain Community detection.
In this post, we combine Neo4j Graph Analytics with Snowflake SQL to uncover insights about sumo wrestling that neither tool could surface alone. We’ll show how PageRank reveals true competitive prestige beyond raw win counts, how Betweenness Centrality identifies the wrestlers who act as critical bridges between the division’s dominant and mid-tier competitors, and how rock-paper-scissors-cycles in dominance relationships map the non-transitive rivalries that define the current era of top-division sumo. It is prestige, structure, and chaos that produce a composite view of the competitive landscape that no single algorithm or SQL query could deliver on its own.
The Data — Makuuchi bouts from 2021.01–2025.11
Our data starts from gathering all bouts from Juryou and Makuuchi for the top 42 rikishi of the 2026 Haru Basho. Our original dataset was somewhat skewed as it includes one of the longest fighting Riksihi in Sumo history (Tamawashi — #1 most top division bouts of all time), because of this we will filter our analysis to Makuuchi bouts from the last 5 years. Further, we will only consider rikishi with 20 or more bouts to get better statistical significance on their fighting style and dominance record.
Who is the most dominant Rikishi in the last 5 years?
While raw win count is a straight-forward metric that can highlight dominance among rikishi, it fails to capture the whole story. As rikishi progress through each basho, they face a variety of different ranks, and their winning/losing record at the end of each basho determine if they will advance or be demoted (apart from Yokozuna which reach a permanent status once achieved). This means some wins are more prestigious than others, especially when the win is against the best of the best.

A better metric that considers the strength of schedule is called PageRank.
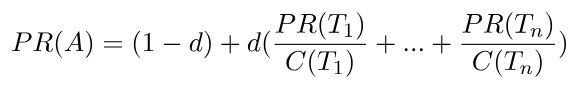
PageRank in our sumo-bout network measures the quality of a wrestler’s victories, not just the count. Beating a wrestler who beat many strong opponents propagates more prestige than accumulating wins against weaker competition. This surfaces the wrestlers who truly dominated the strongest opposition in the 2021–2025 era. We can use weights to represent the prestige of each bout by the rank of the rikishi involved.

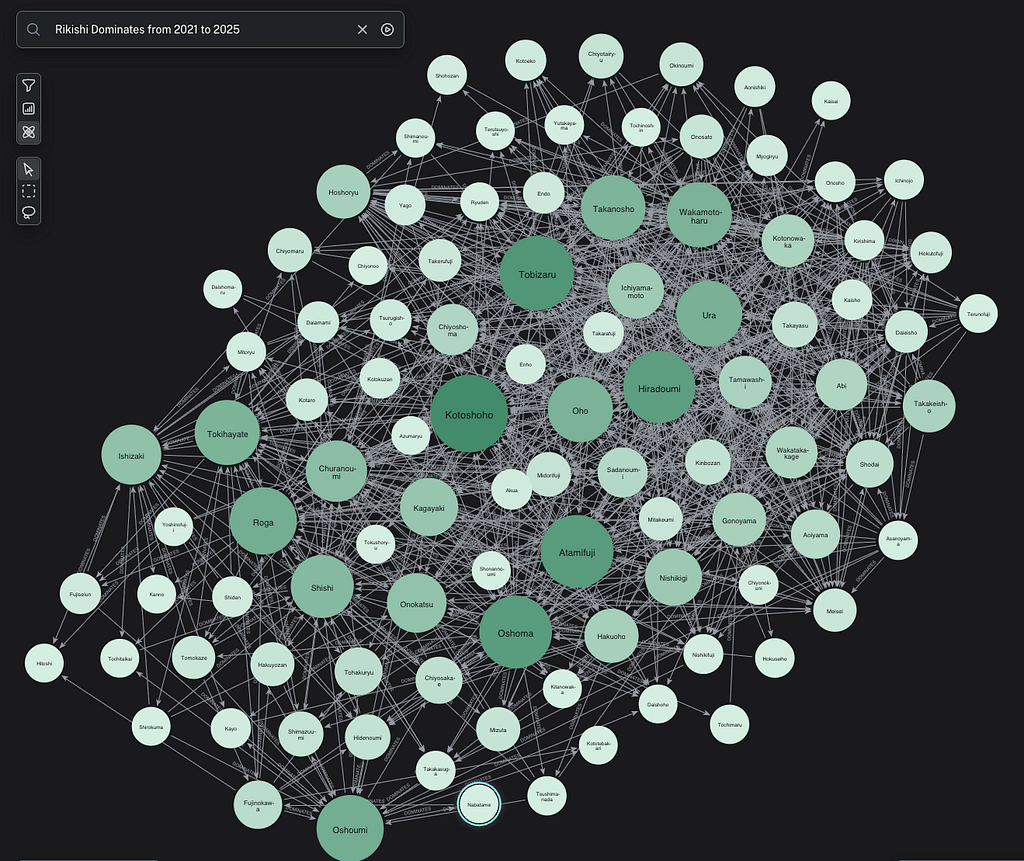
Defining our Input data for PageRank
Using these rank weights we build a directed edge table with one row per bout, flowing from winner to loser. This serves as input to the weighted PageRank algorithm via Neo4j Graph Analytics for Snowflake. Weighting each edge by the loser’s rank ensures that victories over higher-ranked opponents contribute more prestige to a wrestler’s final score.
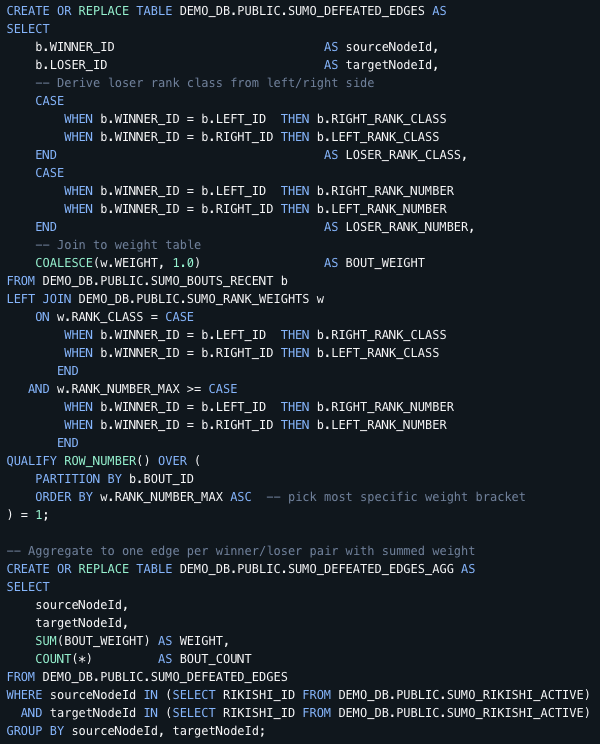
The winner of each bout is assigned as the sourceNodeId and the loser as the targetNodeId. These column aliases are required by the PageRank procedure and must match exactly for the algorithm to recognize the edge table correctly.
One important consideration when invoking the algorithm is orientation. Our DEFEATED relationships point from winner to loser, meaning prestige would naturally flow toward losers under a standard orientation. Since we want prestige to flow toward winners, we use a reverse orientation in the algorithm call, flipping the direction so that incoming edges point toward the wrestler who won rather than the one who lost.
Finally, we create a node table with a nodeId alias, which serves as the second required input alongside the edge table when calling the PageRank procedure. As with the edge table aliases, this naming convention is enforced by the algorithm and must be consistent across both tables.
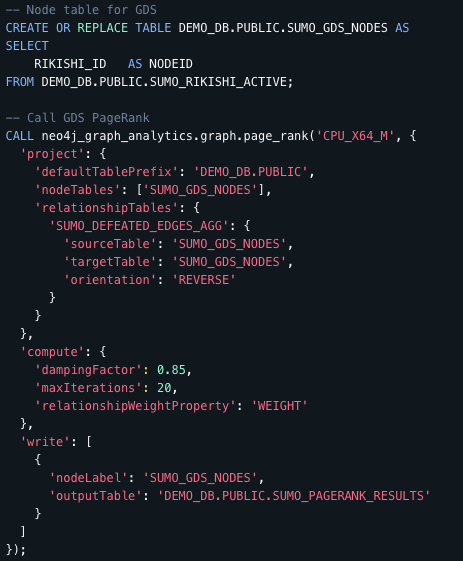
PageRank Configurable Parameters
Two configurable parameters found in the compute section are shown, dampeningFactor and maxIterations. The damping factor models the probability that prestige continues to flow through the network versus “teleporting” to a random node. At 0.85 it means there is an 85% chance that prestige from a defeated wrestler propagates forward to their conqueror, and a 15% chance it resets to a random wrestler entirely.
In sumo terms, a wrestler gains prestige from beating strong opponents, but that prestige chain doesn’t continue indefinitely. The 15% reset prevents a single dominant chain of victories from monopolizing all the prestige in the network and ensures every wrestler retains some baseline score regardless of who beat them. 0.85 is the standard default used in most PageRank implementations including Google’s original paper.
PageRank is iterative. Each pass redistributes prestige scores across the entire network based on the previous pass. Max iterations caps how many times this redistribution runs. With each iteration the scores converge closer to their final stable values, and 20 iterations is typically sufficient for a graph of this size to reach convergence. Together these parameters ensure the algorithm converges to a stable, meaningful prestige ranking rather than amplifying noise from isolated victory chains.

We can now compare each rikishi’s PageRank score against their raw win count over the 2021–2025 period. Ranking by PageRank rather than wins reveals where the two diverge. A positive delta indicates a wrestler whose victories carried more prestige than their win volume alone would suggest, while a negative delta flags wrestlers who accumulated wins against comparatively weaker opposition.
At the top, Hoshoryu, Kirishima, Kotozakura, and Daieisho lead in both wins and PageRank, a strong signal of sustained dominance against quality opponents over the full five year window. Further down the table, Abi, Wakatakakage, and Takayasu tell a different story. All three have significantly fewer total bouts than the wrestlers above them, likely due to injury during the analysis window. Yet their PageRank scores remain competitive. When they competed, they beat wrestlers who mattered.

Building a Dominance Graph: Who Owns Each Rivalry?
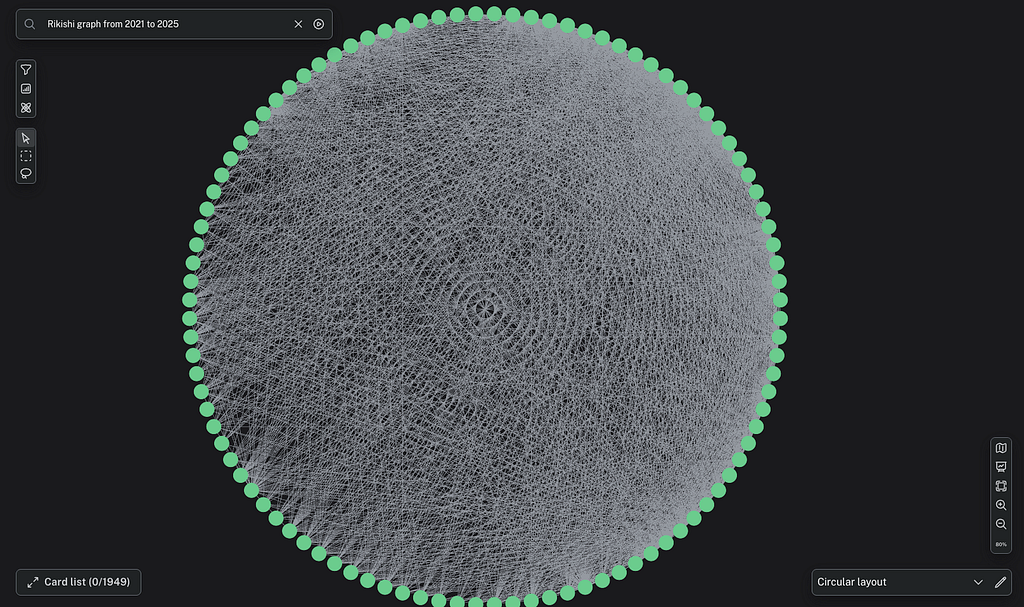
Grand sumo inherently has built in rivalries by the design of the tournament structure. Rikishi regularly face each other repeatedly allowing for some wrestlers to best others in a dominant fashion over time. We can build a directed graph which analyzes which rikishi have significant win advantages over others.
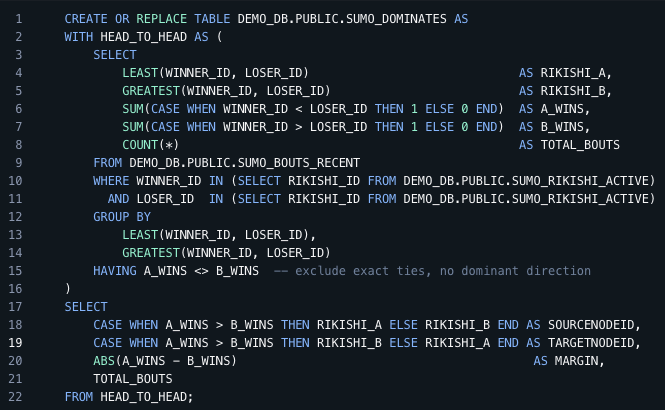
Thousands of individual bouts create a dense and noisy graph where the sheer volume of edges makes it difficult to see the underlying competitive structure. Two wrestlers who have met fifteen times, trading wins back and forth, appear as fifteen separate relationships rather than what they really represent: one wrestler with a slight but consistent edge over the other. Collapsing each matchup into a single directed edge pointing toward the net winner cuts through that noise and surfaces the true dominance relationships that define the division.
While still highly connected, relationships now show who holds the dominant advantage between each rikishi. Overlaying our PageRank algorithm we can see Hoshoryu still leads our ranking followed by Onosato, Kotonowaka, and Takakeisho, seen by the larger and darker nodes.
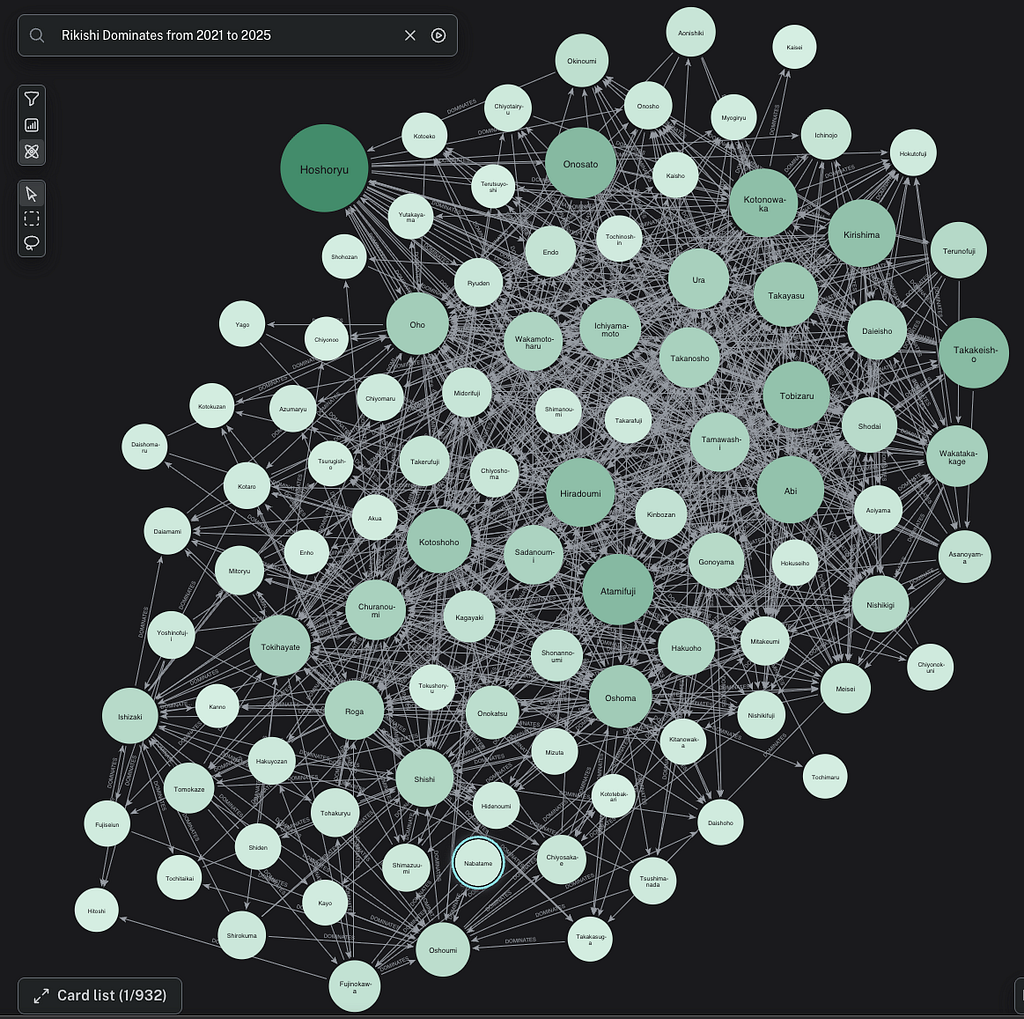
Despite his position at the top of the PageRank rankings, Hoshoryu is far from unbeatable. Several wrestlers hold a net winning record against him, reflected by incoming DOMINATES edges in the rivalry graph. What separates him is not an absence of losses but the quality of the wrestlers he consistently beats. His outgoing DOMINATES edges point toward wrestlers who themselves dominate large portions of the division, and it is this chain of high-value victories that PageRank captures and rewards with the highest prestige score in the 2021–2025 era.
Beyond PageRank: Finding the Division’s Structural Bridges
PageRank tells us who wins against the best, but it doesn’t capture the structure. The wrestlers who define an era are not always the ones at the very top. Often it is the wrestlers just below them, the ones who consistently beat the mid-tier while occasionally toppling the elite. Its these rikishi who shape the competitive landscape most. If these wrestlers disappeared, the hierarchy would fracture. They are the load-bearing pillars of the division. This is what Betweenness Centrality measures.
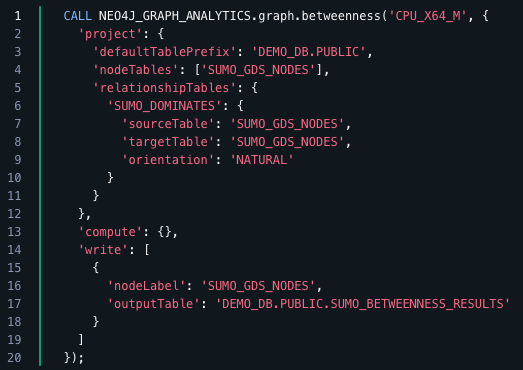
A high Betweenness score identifies wrestlers who sit on the most paths through the dominance hierarchy. They are the wrestlers whose results connect the top of the division to the bottom. In practical terms, a high-Betweenness wrestler is one whose losses matter as much as their wins. When they lose to an elite wrestler it validates that wrestler’s dominance over the whole tier below. When they win against a lower-ranked opponent it keeps the hierarchy intact. Remove them and the competitive chain breaks.
The rikishi that are darker and larger represent those which support this heirarchy the most. They are the most common rikishi among shortest paths between each rikishi in the network.
Rock-Paper-Scissors Sumo: Finding Non-Transitive Rivalries with Graph Analytics and defining Chaos
An interesting aspect of the DOMINATES graph is that it highlights the rock-paper-scissors like structure built into the rikishi ecosystem.

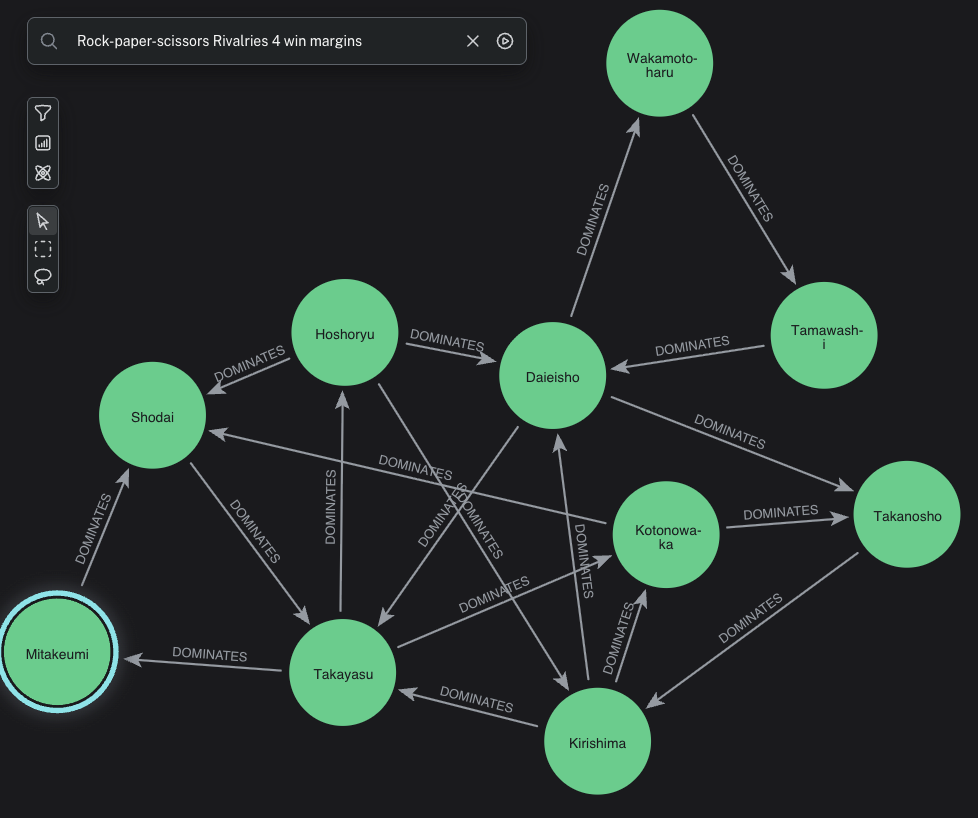
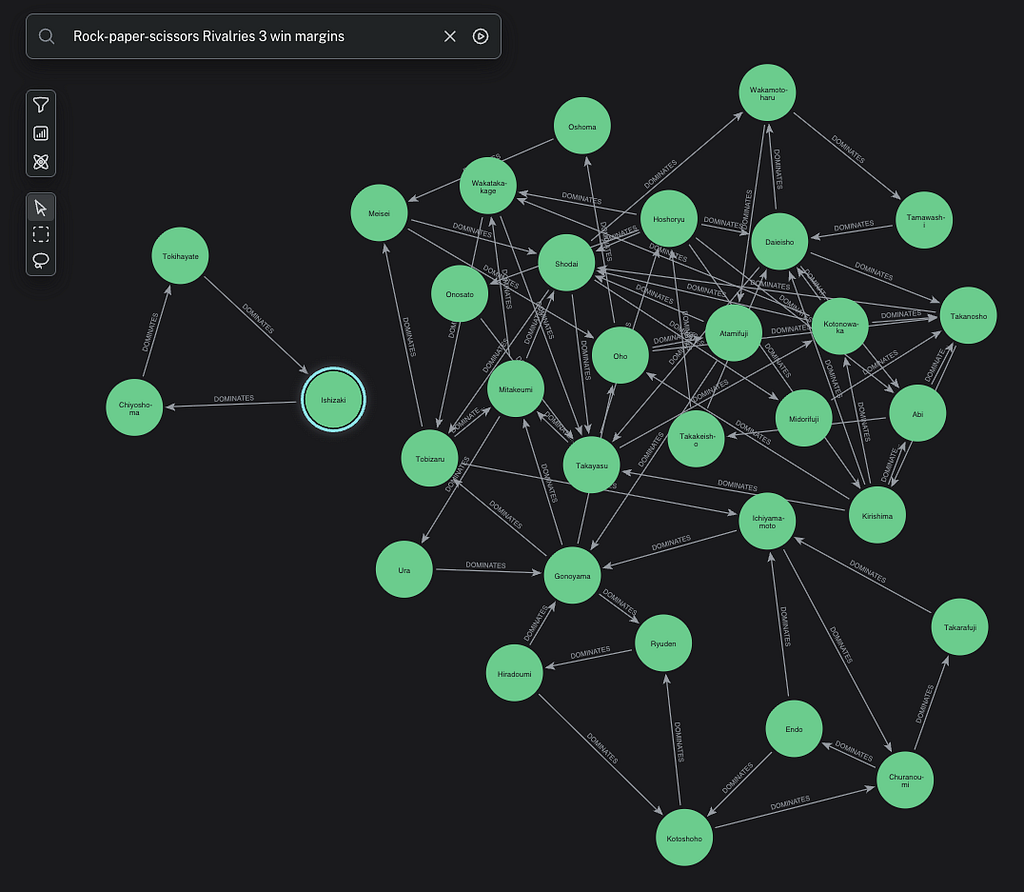
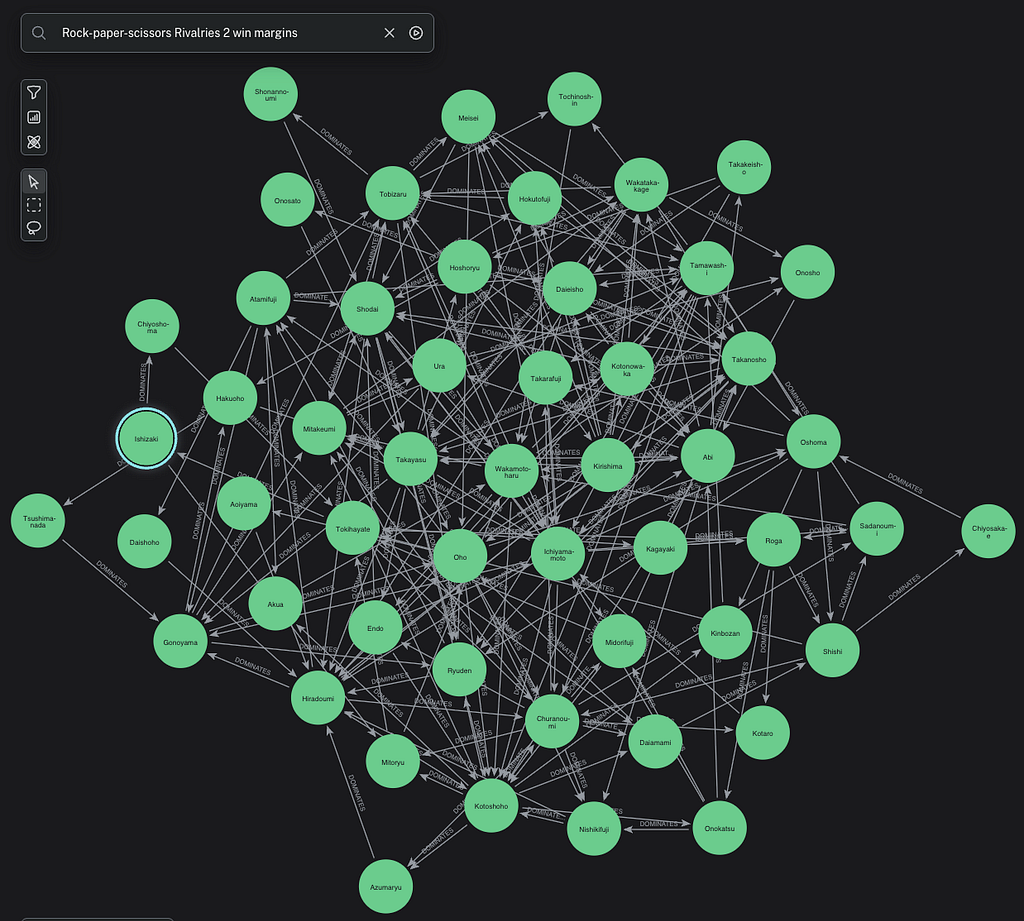
The above graph images show how the win margin of DOMINATES highlight that no single rikishi dominates everyone. Instead, a 3-cycle of rock-paper-scissors exists throughout at various win margin levels. When we run the Betweeness Centrality Algorithm those rikishi that are found in more of these 3-cycles will have a higher score. By using PageRank, Betweeness, and 3-cycle count we can develop a new metric, the Chaos Score.
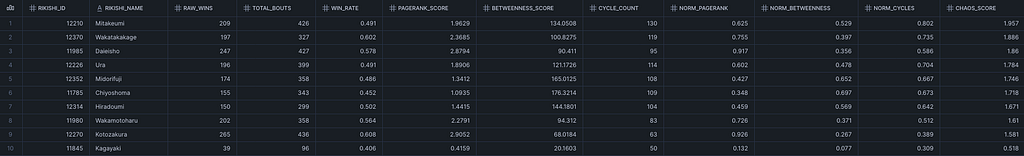
Finding the best wrestlers in the current era of sumo turns out to be a far more complex question than it first appears. Raw win counts favor volume over quality. PageRank surfaces prestige but misses structure. Betweenness Centrality finds the structural pillars but ignores who they beat. Only by chaining these algorithms together through a combination of Neo4j Graph Analytics and Snowflake SQL does a complete picture emerge.
Conclusion
The wrestlers at the top of the Chaos Score are not simply the ones who won the most or beat the strongest opponents. They are the ones who did both while remaining embedded in the non-transitive rivalries that make the division genuinely competitive. That is the insight that graph analytics unlocks and that SQL alone could never surface. The dohyō has always rewarded complexity. Now we have the tools to measure it.
Next time, we will analyze how dominance and rikishi styles have changed across decades. We will utilize our Chaos score in practice to show how the types of kimarite used influences who wins and who lose.
If you enjoyed this blog, feel free to like, follow, and share it with others. You can find the code used in this blog post at my github here.
SumoDB in Neo4j: Chaining Multiple Graph Algorithms in Snowflake — Part 3 was originally published in Neo4j Developer Blog on Medium, where people are continuing the conversation by highlighting and responding to this story.
Share Article


Explore
Related Articles