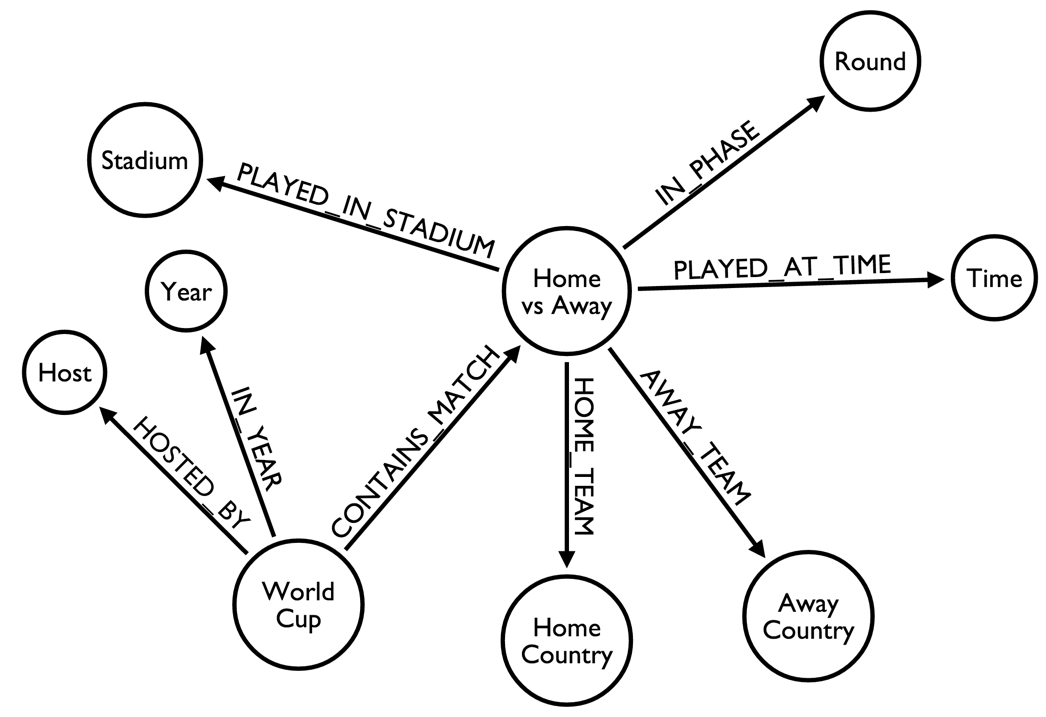
During the matches in Brazil, we’ve been building a giant graph database to explore the tournament in an entirely different way. The use of data in sports reporting is nothing new. However, the data that is used quite often is. Metrics like possession, shots on goal, goal differences and so on, are familiar to most of us. They’re also very conventional analyses based on relational data.

Graphing the same data enables us to identify some altogether different trends based on data gathered by our team. On June 18th, we hosted a Hackathon in London, where we gathered together developers and football fanatics to add data sets to the Neo4j – a graph database and think of weird and wonderful questions to ask it. Since we held the Hackathon just a few days after the opening of this year’s tournament, we used historical data, painstakingly gathered by our team – i.e. nothing from the current tournament.
Here is a rundown of our 5 most interesting findings:
1) Revenge is sweet, but can’t always be hurried…
It took 80 years for Mexico to get revenge on France! They lost to France in 1930 but didn’t settle the score with them until 2012.
2) … except when it can
In the 1954 tournament in Switzerland, Hungary beat West Germany, but later lost to them in the final.
3) There is a ‘Victor’s Curse’!
The current champions haven’t made it out of the group stages this year, and this is by no means an isolated incident. Indeed, only three world champions have ever made it to the finals in the tournament following their victory:
- Argentina won in 1986 and then got to the final in 1990
- Italy won in 1934 and then got to the final in 1938
- Brazil won in 1958 and then got to the final in 1962.
4) Top three countries never to lose a match in normal play
If you exclude shoot outs, England’s form is not at all shabby:
- Brazil’s team has never lost a match in 1958, 1994, 1970, 2002, 1978, 1986, 1996.
- Second place goes to Italy, which suffered no normal play losses in 1998, 2006, 1938, 1982, 1934, 1990.
- England comes in third, as it never lost a match in 1982, 2006, and, of course 1966.
5) The bench list
A substitute’s worst fear is never to be called on to play. These five players suffered this ignominy in no less than three tournaments:
- Anthony Seric (Croatia)
- Antonio Juliano (Italy)
- Marek Kusto (Poland)
- Borislav Mikhailov (Bulgaria)
- Francisco Urruticoechea (Spain)
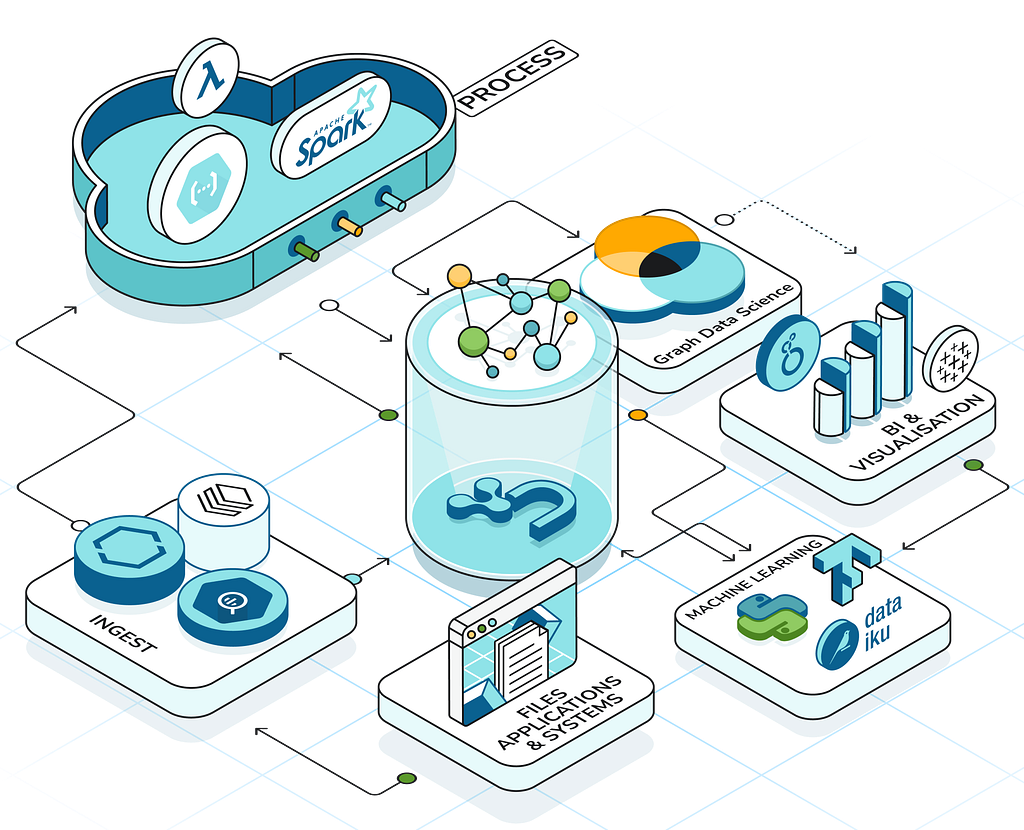
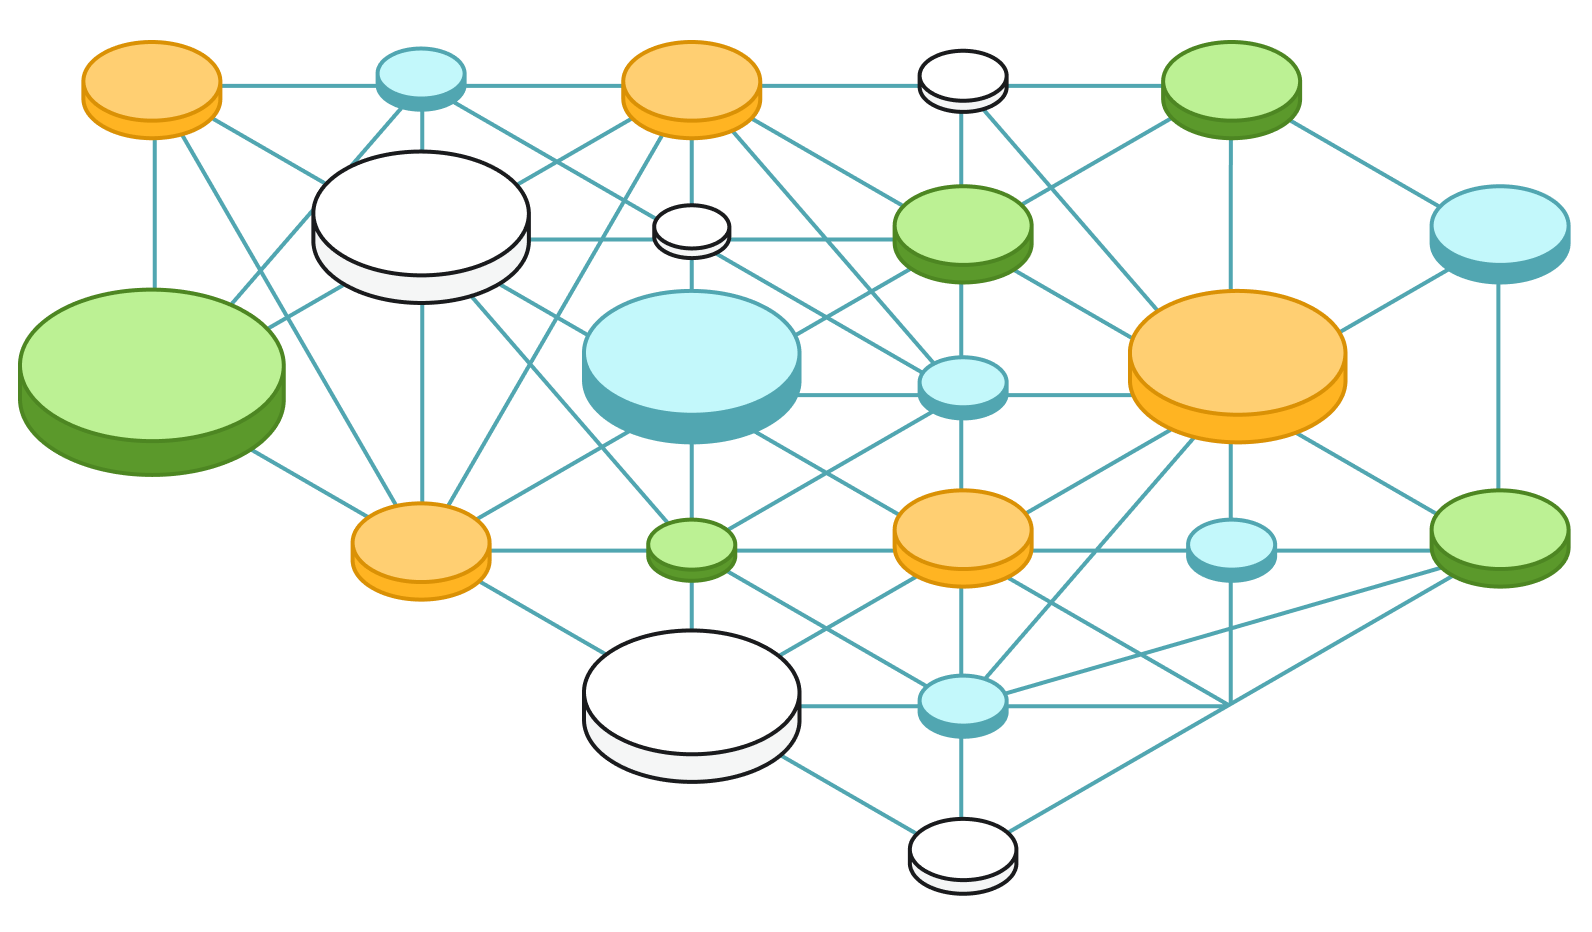
Gathering these insights was a lot of fun, but belies a more serious intent. Organisations can use graph databases such as Neo4j to manage and explore data in ways they would never have been able to, using conventional, relational databases. Critically, they enable us to understand the relationships between different items, not just their quantity, location, etc. Indeed, many leading businesses are already attuned to this and are making the most out of the benefits.
For example, Shutl, an eBay company, is using Neo4j, our graph database, to determine the quickest possible way to deliver an item from sellers to buyer within the same day. When planning routes on its previous, relational database it could take several minutes to crunch the data – now it takes a second, the Neo4j-powered system provides up to fifty different alternative routes.
We think graph databases will change the way organisations think about and harness big data – and our brief look at this summer’s football gives just a hint of what’s possible. Drop us a line if you would like to find out more about our regular Hackathon events.
For more information visit: www.Neo4j.com
Share Article


Explore
Related Articles

Hey LLM, you’re using OPTIONAL MATCH wrong. Here’s the Cypher that actually works.