Accelerating Digital Transformation at CA Technologies with Neo4j

Software Engineer, CA Technologies
9 min read
Editor’s Note: This presentation was given by Peng Sun at GraphConnect New York City in September 2018.
Presentation Summary
CA Technologies was undergoing a digital transformation when they began incorporating Neo4j. They understood that multifaceted problems require different solutions, and sought to cover much more of their extensive data landscape.
They were looking for a solution that could encompass the customer footprint and user journey from start to finish. However, they had a lot of dispersed data in a lot of different locations. It was a challenge to make sense of it all.
With multiple teams trying to reach common and separate goals by sharing information, they knew they had to better manage their data infrastructure.
To approach these challenges, they tackled three key elements. Since CA Technologies are not the average IT department, they had to incorporate people with different skill sets into a cross-functional team.
Next, they found a new approach to their process – a way to make the workflow more interactive and responsive.
Finally, the culture around sharing information across teams would need a comprehensive reboot.
Integrating a graph database has leveraged a lot of technology and information and helped provide a better understanding of the data they are using.
The CA Technologies engineering and data science team is working with more organized data and now have an easier time enriching it.
Neo4j has offered a convenient way to model heterogenous data sources and the relationships that they share. Now members of all teams are having a far easier time accessing data, enriching it with their own external information and sharing it company wide.
Full Presentation
I am Peng Sun, the software engineer leading the research and development work inside the global information systems within CA Technologies.
I’d like to talk about how the IT department and engineering team at CA Technologies accelerated digital transformations with Neo4j and graph technology.
Professional Background
Before joining CA Technologies, I came from an academic background. I started in cosmic ray transportation. These transports could be leveraged to estimate radiation levels.
In the next decade, if we are going to colonize Mars, I may work on predicting solar storms. This could be helpful to suggest if humans should stay underground if there’s a solar storm coming, or if the radiation levels are too high.
When I joined CA Technologies, we were undergoing digital transformations. Today, I’m going to talk about those changes and share with you the experiences and lessons we learned so far.
Understanding the Size of the Problem
I am going to share how we leverage Neo4j and graph technologies to solve graph-related challenges.
The first step is understanding the size of the problem. This is the same philosophy I apply to smaller sized problems. If there’s one take-home message for you, I’d like it to be that if you want to achieve something do it incrementally and iteratively.
When I joined CA Technologies, one of our challenges was wanting to move from the digital sales domain and leverage subscription types of models.
That meant that we, as an engineering team, had to work on the data infrastructure to deal with more data. We wanted to cover as much as we could.
What We Wanted in a Solution
We wanted to cover the customer footprint along the user journey, across digital sales, marketing, support and the various forms of media seen below.
We wanted to understand how users interact with our marketing campaigns, how they visit our websites, how they use our products, and as many footprints as possible.
Dispersed Data
Usually data within a big organization such as CA Technologies is held in different business units, different departments and by different product development teams.
We wanted to work horizontally and integrate this information between departments, business units and teams.
When working vertically with data we have to deal with data coming from different sources, formats and in different versions like you see below.
Those challenges are overwhelming.
Data to Cover Common Goals
Another important point is what differentiates us from a traditional IT department. We do not just provide support for tasks. We provide and deliver business intelligence to our teams to add value to them.
In order to continue to do that, we have to brew our own data science products and services.
Managing Data Infrastructures
To continue to provide the support we add to our team, we need a new way to manage our data infrastructures.
We also have to manage the data science life-cycle of the data science products and services and integrate clearly with the previous types of application development, IT enablement and activities.
The Challenge of Managing Multiple Tasks
How do we approach these challenges?
Out of many activities we have done, and the key elements we have implemented, I want to identify three parts that are very valuable to share. It all comes down to three key elements: people, process and culture.
People
In order to do this differently than the traditional IT departments, we have to incorporate people with different skill sets into a cross-functional team. We have to work together towards a shared target or goal.
That goal could be to raise revenue or to be more cost efficient. We achieve our goals in a very fast and iterative manner when we work together.
Process
The second major part, the process, will differ from company to company. This is going to be how we make the workflow more interactive and responsive. We leveraged HR practices in our application development, infrastructure building and in our data science team work.
Culture
The next point is to have a better understanding of the business problems. In order to do so, we have a good process. We have a clear understanding of the data. We have a comprehensive understanding of our infrastructures and our company structures and we have a culture built around information sharing.
The next step is for the engineers.
We have to choose our best tools for the types of work, tasks, user cases and stories. That’s where we found the problems related to graph.
Integrating a Graph Database
We thought and we experimented. After much deliberation, that is when we chose Neo4j to solve our graph-related problems.
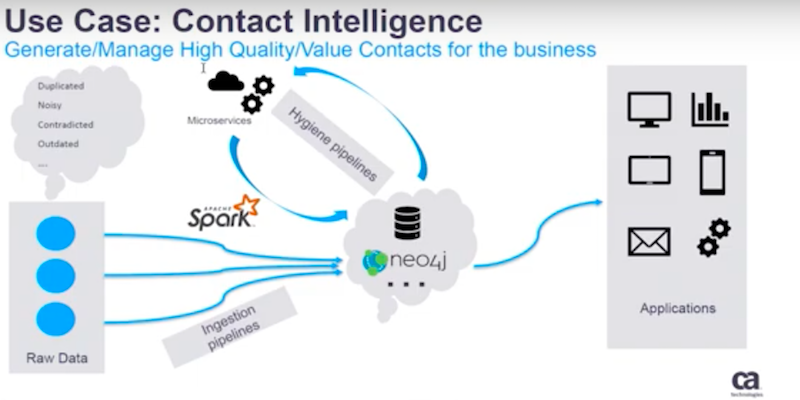
Below is one of the pipelines that are in production today in CA Technologies.
The problem it tries to solve is to generate and manage high-value customer contact lists for our business.
We have leveraged a lot of technologies and micro-services like Apache Spark and cloud. One of the most important points for a company working with graph technology is to give a better understanding of the data.
Next, we want to use that understanding to provide a high quality dataset. As you may imagine, the contact and customer information comes in different sources. It comes in a very noisy, duplicated and sometimes contradicted way.
Our Pipelines
We created ingestion pipelines, hygiene pipelines and duplication pipelines.
These pipelines leverage microserve, micro-services and Spark to solve these problems. Neo4j services are a data persistent layer. This layer is very important to derive insights that will help us to better merge, resolve, organize and manage the contacts and their interactions in a cleaner way.
When we used the Neo4j database to serve the applications we experienced very high level introductions of the production pipeline. This is now one of the product pipelines that we are leveraging in CA Technologies.
Engineering and Data Science
Allow me dive a little bit more into the engineering the data science piece.
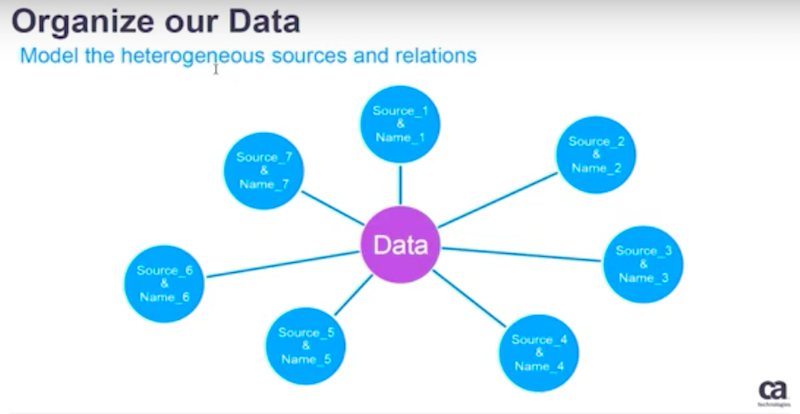
We approach different problems with the same philosophy. We organize the data and then enrich the data to make more sense of it.
If you want reliable data or an intelligence system,the first step is to have a sturdy starting place. You need to create a raw data layer that you could always revert back to if something happens.
The Benefits of Leveraging Neo4j
A great graph database, such as Neo4, offers a convenient way to model the heterogeneous data sources and the relations. I have a list of must-haves below.
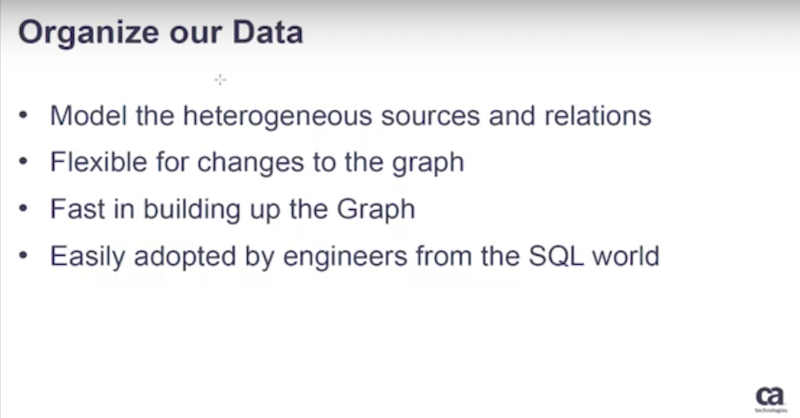
It has to be flexible if you want to make some changes and it needs to be fast to load data in batch mode.
You should be able to instantly recreate your graph database in a proper cadence to your needs based on your data size and transformation characteristics.
When we were first adopting a graph database we asked our engineers to try it out. We wanted to see how easily and quickly they adopted the technology. Some of them are from a SQL background with no previous experience with graph-related technologies.
If the data is coming from multiple sources, the same data might be existing in different areas.
Leveraging a graph provides abstracted mapping between these sources. It is a very easy way to organize and manage varying information.
The abstraction layer provides unified access, and then on top of that we build implementations based on different use cases.
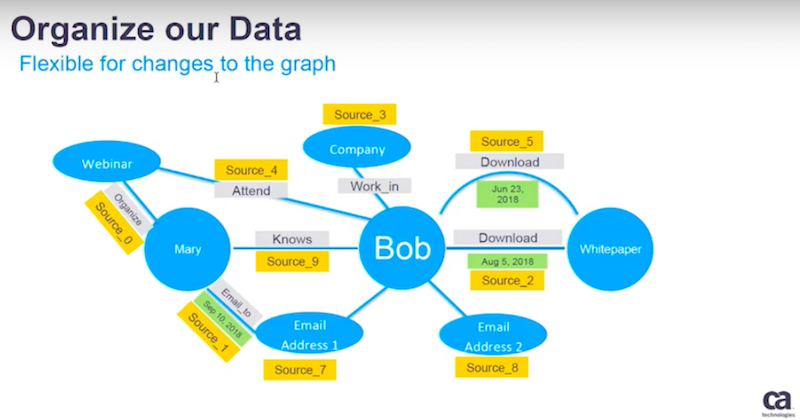
Next, if you want to make a change, instead of coming from different sizes and different sources you just create a new node and edge. You record this new information inside this graph and by doing this it’s very easy to model this data.
All of this could be done in STAR schema. You may also learn how to visualize a SQL in graph. The benefit of doing so will accumulate if you continue. That is how we continuously enrich our data once we have a way to manage it.
If we want to very quickly build our database, a good practice pattern that we leveraged, is to use Spark. We do the transformations from raw to responding files that are ready to be loaded into a graph database.
Then we leverage batch loading to do some of the work. The rest we leverage with Neo4j’s graph libraries. We have found this to be an efficient way to build your data in the proper cadence you choose.
Enriching Data
Let’s go on to the second step.
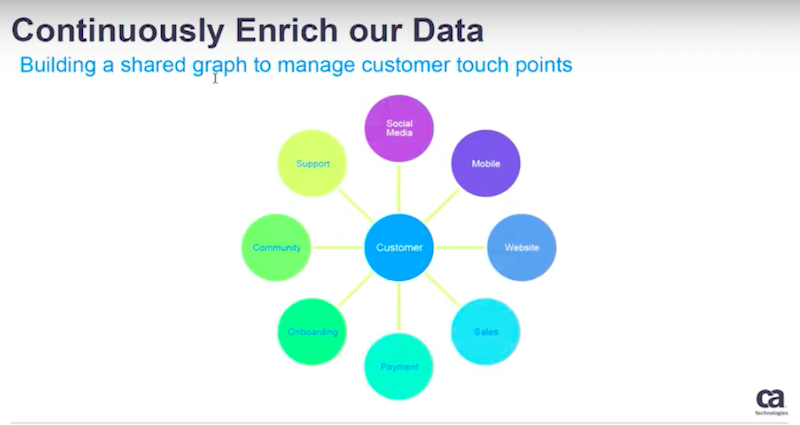
Now that you have a way to record, manage and to represent your data the next big part is to continue to enrich it.
In our case we want to manage the customer’s touch points along the user journey. We have to share the graph database, and then we start to build connections of existing dots.
Our team has to leverage different techniques seen below and work together with the business.

We have to translate their business rules into new connections within this graph, and then add new connections.
This gives us the capability to better understand the graphical connections. In our case, that is a user inside the user journey.
High-Level Case Example
Here is an example of a high-level case.
In this scenario, we have to incorporate data or information from different data banks for a customer. With our system using Neo4j, we don’t have to do the heavy lifting.
You leverage the graph database to connect the data, then enhance your analytics units across boundaries.
Below is another example of how to add more insights in that graph.
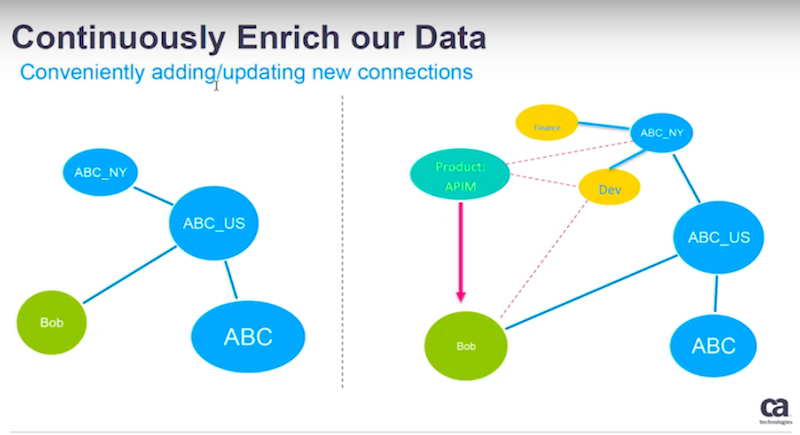
Suppose Bob is an employee of ABC U.S. – a child company ofABC. They also have another child company called ABC New York.
By leveraging other information, your data science team may come up with a better understanding of how Bob is related to this organization and where he fits within the hierarchy.
In this case, the lines below will show the work of the data science team.
Bob belongs to a development department with the ABC New York site and it’s not a financial department.
Another data scientist’s algorithms may help us find out who to reach out to in order to sell a product. That information will be based off of the history and the external information found. Then I recommend to the sales and marketing teams the best approach.
Now your business team knows when it is appropriate to contact Bob for this product. You are also continuously enriching your graph database and building a knowledge graph.
A lot of insightful information could be mined from a knowledge graph. That is why we place a lot of importance on continuously enriching the database.
Once we have a way to manage our data sources, we draw a better understanding from them.
Another part of leveraging comes from graph algorithm libraries. We find community patterns within data. We also find the most important notes that will connect you to more opportunities.
What Neo4j Has Done for CA Technologies
CA Technologies has undergone some exciting changes since working with Neo4j.
We have leveraged a graph, a new natural language, capabilities and graph database to provide a convenient service for our sales and marketing guys.
The sales operations team don’t have to know any SQL or any query languages. They don’t have to call us or a data scientist to figure out the data.
All they need to do is enrich our datasets with their external knowledge. We translate a natural language into a graph query. Then view everything behind the scenes. The final product spits out answers to all of our business teams.
Want to learn more on how relational databases compare to their graph counterparts? Get The Definitive Guide to Graph Databases for the RDBMS Developer, and discover when and how to use graphs in conjunction with your relational database.
Share Article


Explore
Related Articles
Exploring the Neo4j Spatial Plugin: Custom Procedures for Spatial Analysis
Exploring Neo4j Spatial: Path Intersections Using AIS Data
Unleashing the Power of Schema: What’s New in the Neo4j GraphRAG Package for Python