Analyzing the FinCEN files with Neo4j


8 min read
The FinCEN files investigation
The International Consortium of Investigative Journalists (ICIJ) has recently exposed a vast network of industrial-scale money laundering running through Western banks and generally ignored by U.S. regulators – and they used Neo4j to help crack the case wide open.
The global investigation, dubbed the FinCEN Files, reveals how money launderers move their dirty money. From drug cartels and corrupt regimes to arms trafficking and other international crimes, these global banks have turned a blind eye – or even straight up refused to stop – as they earn huge profits from each transaction.

Together with BuzzFeed News and other media partners, the ICIJ spent 16 months organizing and analyzing the FinCEN Files. Using the Neo4j graph database and Linkurious graph visualization, along with many other tools, journalists built a knowledge graph to explore more than 400 spreadsheets containing data on 100,000 transactions and pieced together a nuanced picture of a broken system.
The results draw from more than 2,100 suspicious activity reports (SARs) between 1997 to 2017, which accounted for transactions of more than $2 trillion USD in dirty money. These reports were filed by banks and financial firms with the U.S. Department of Treasury’s Financial Crimes Enforcement Network (FinCEN), but were largely ignored or overlooked.
The FinCEN Files follow other breakthrough reporting and Pulitzer-Prize winning investigations from the ICIJ such as the Panama Papers, Paradise Papers, Swiss Leaks, West Africa Leaks and Luanda Leaks.
In this post, we take a closer look at the graph data model used in the FinCEN Files and walk you through a demo of querying and visualizing the connected data. We also take a deeper dive into the data using graph data science for more nuanced insights.
Some context on Neo4j and data journalism
In the spring of 2016, a big piece of investigative reporting hit the streets: The ICIJ published the Panama Papers. An unprecedented set of publications, events, political revolutions and corporate boardroom changes followed – the ICIJ had hit upon a very dark nerve of the financial establishment.
The offshore constructions used by the rich, famous and criminals alike scandalized many everyday citizens, and in the aftermath, a number of different governmental and regulatory institutions initiated changes to end common tax evasion tactics. During the Panama Papers investigation, the ICIJ used not only a set of invaluable documents obtained by an anonymous source, but they also used an impressive set of technological building blocks that made an impossible task come together. One of these building blocks was the Neo4j graph data platform, and both as a company and as a community we have been proud contributors to this task of data-driven investigative journalism.
This article is about a new, and perhaps more important, piece of reporting just released by the ICIJ – using a very similar methodology and technology architecture. In the FinCEN Files, they don’t uncover offshore tax dodging constructions but instead reveal banking schemes that would and should rock the financial services world.
These banking schemes enable crime, oppression and authoritarianism across the globe. Now they’ve been brought to light thanks to the combined efforts of a global team of journalists and the power of graph technology.
Let’s dive in.
The raw FinCEN files data
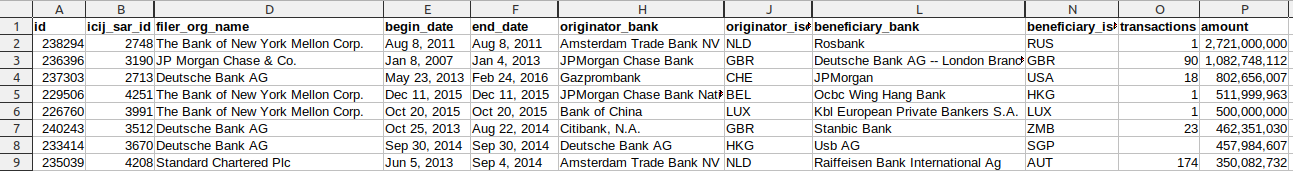
The ICIJ published a small subset of the suspicious activity report (SAR) data that we can use to visualize and query some of the SAR filings.
Much detail has been removed from the published data. Each transaction only includes:
- The involved banks (name, country and geolocation)
- The filer, originator and beneficiary
- The begin-date and end-date
- The monetary volume
- The number of filings
We can turn this tabular information into a graph dataset that represents the participants of the filing via relationships.
The data import process
For each Filing we create a node to store the attribute data. For each entity (bank) mentioned in either of the files for that filing we create an Entity and store its name and geolocation and connect it to its Country. Then we connect the Filing with an appropriate relationship to the Entity:
- originator =>
ORIGINATOR - beneficiary =>
BENEFITS - filer =>
FILED - entity_b =>
CONCERNS
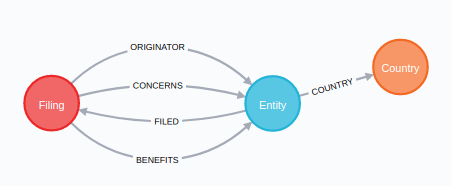
Our FinCEN Files graph data model.
We are providing an import script for the data, and we’re also creating a demo database with the imported data and a Neo4j database dump that you can import into your own local or cloud instance.
For the demo server link use the following login information:
- username: fincen
- password: fincen
- database: fincen
The Neo4j database dump and import script can be found in this GitHub repository: https://github.com/jexp/fincen
FinCEN files data visualization and exploration
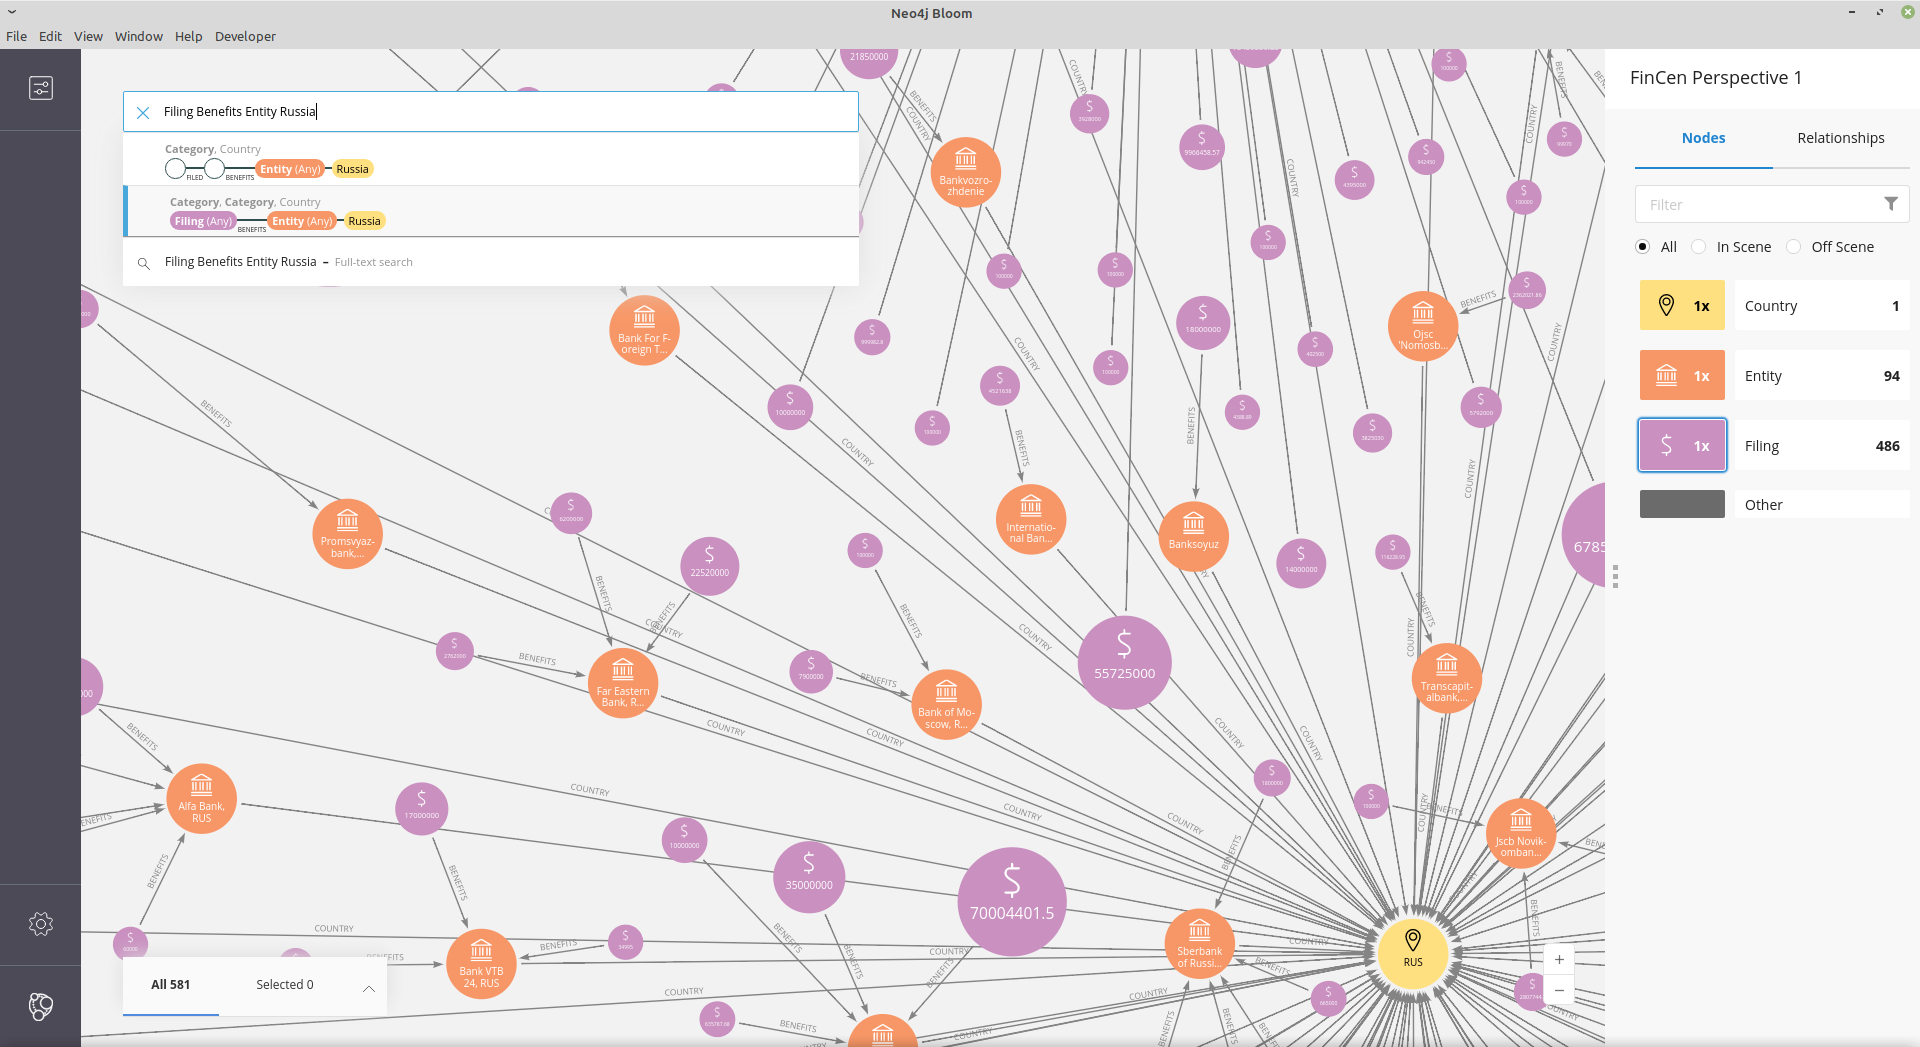
To explore the data after the import, one option is Neo4j Bloom™ – an interactive graph data visualization and exploration tool. With the provided “perspective,” each entity is rendered with a specific icon and caption, and you further investigate the data by just entering the relevant search phrases in the search box.
Visual results for searching Neo4j Bloom with “Entity Deutsche Bank Filing”:

Bloom visualization results for “Filing Benefits Entity Russia”:
Querying the FinCEN files data
In the Neo4j Browser, a number of queries can give us some deeper insight into the data.
Here are the queries and resulting data visualization for the top 10 Filings and their participating Entities:
MATCH (f:Filing)
WITH f ORDER BY f.amount DESC LIMIT 10
MATCH p=(f)--(e:Entity)
RETURN *

MATCH (e:Entity)--(f:Filing)
WITH e, round(sum(f.amount)) as total
WITH e, total ORDER BY total DESC LIMIT 10
OPTIONAL MATCH (e)-[:COUNTRY]-(c:Country)
RETURN e.name, collect(c.code) as countries, total
Other data visualizations
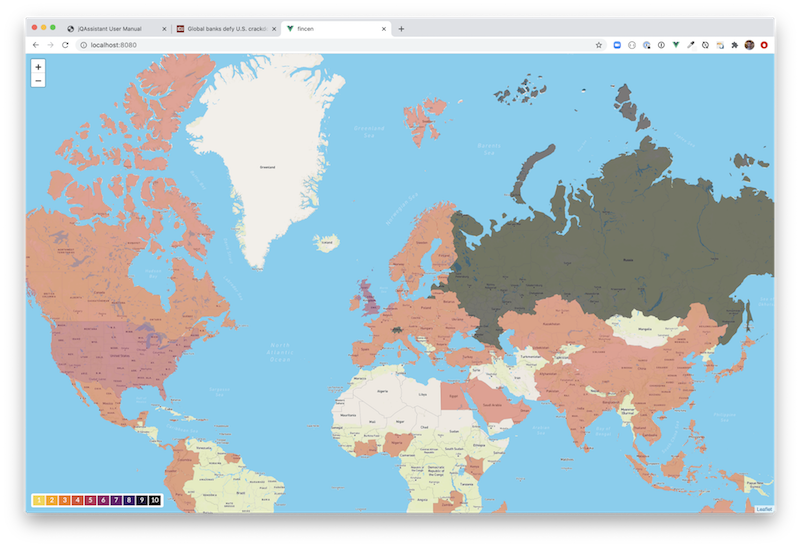
The countries of the beneficiaries can be highlighted based on the aggregate transaction volumes, as you can see below.
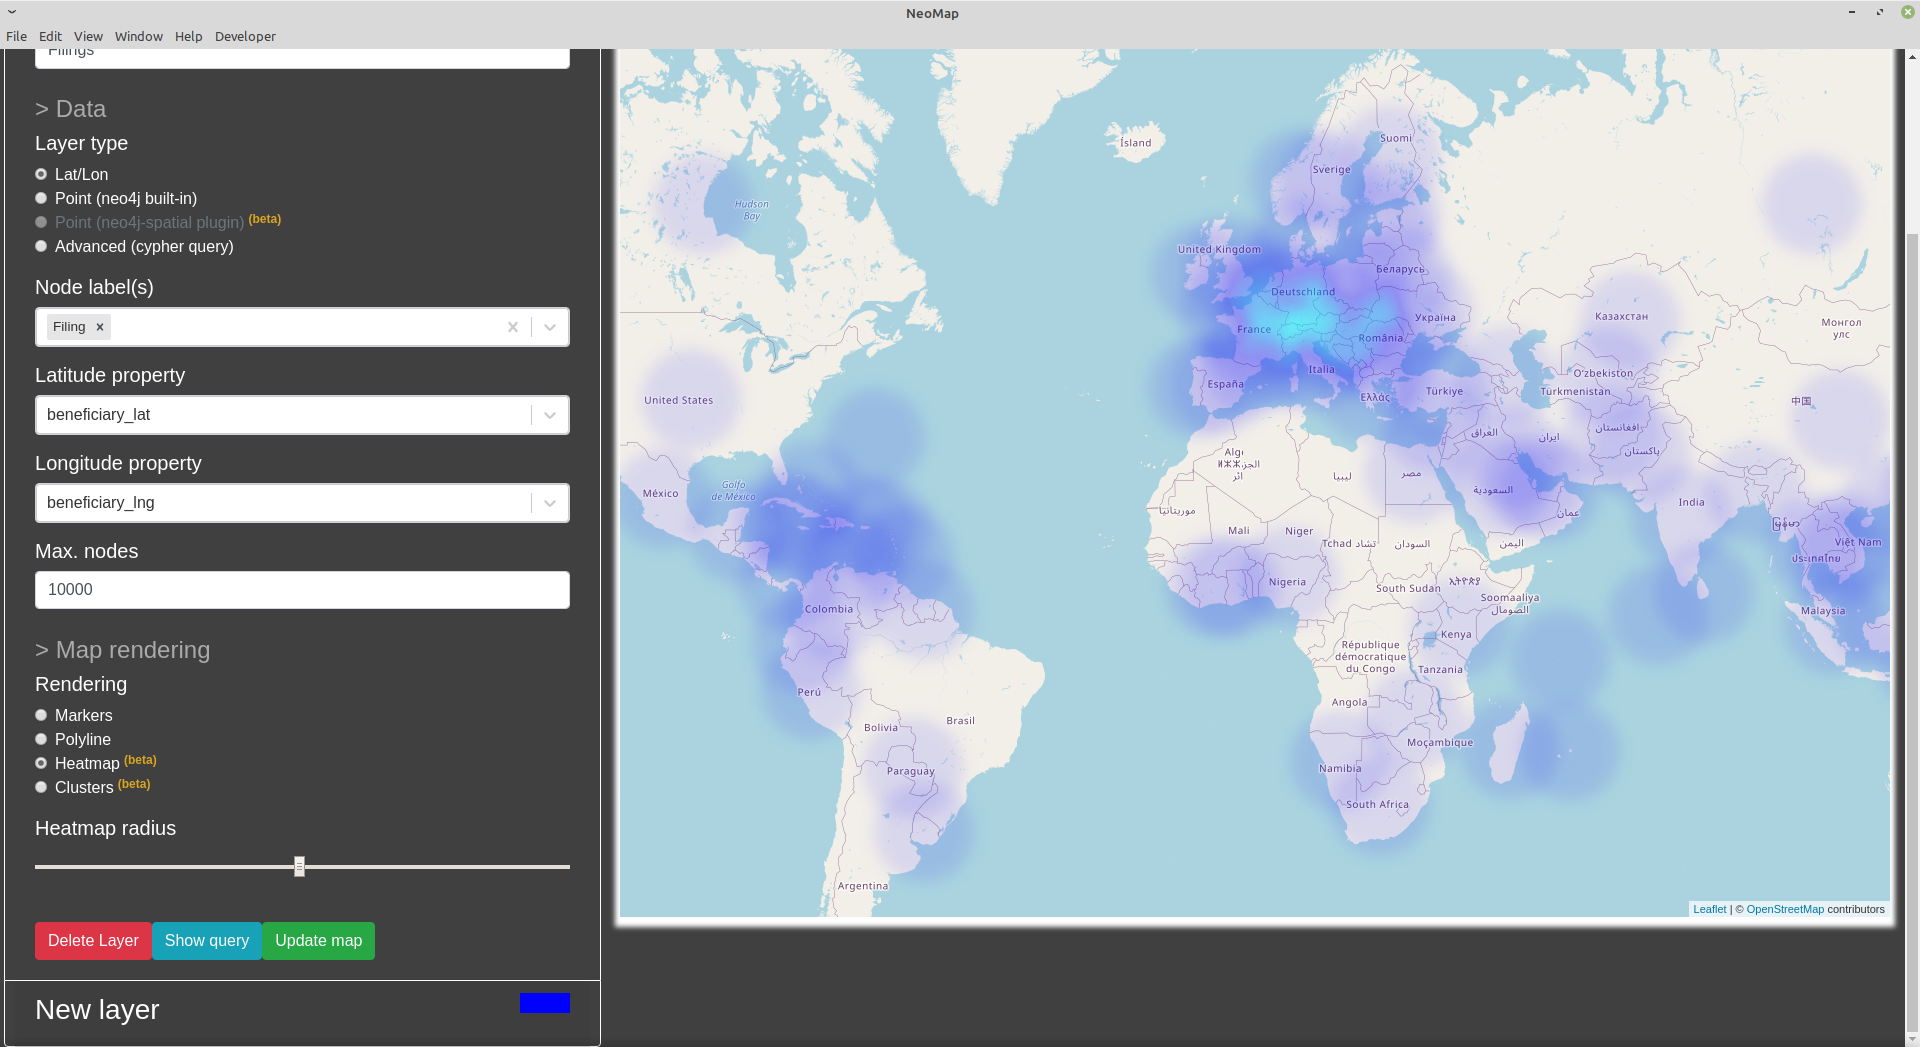
We can visualize the bank-data by geolocation as a heat map, using the Neomap application for Neo4j Desktop.
Using Graph Data Science to analyze the FinCEN Files data
Banks we use the ORIGINATOR and BENEFITS relationships to create a virtual TRANSFER relationship from one bank to another that holds the total amount.
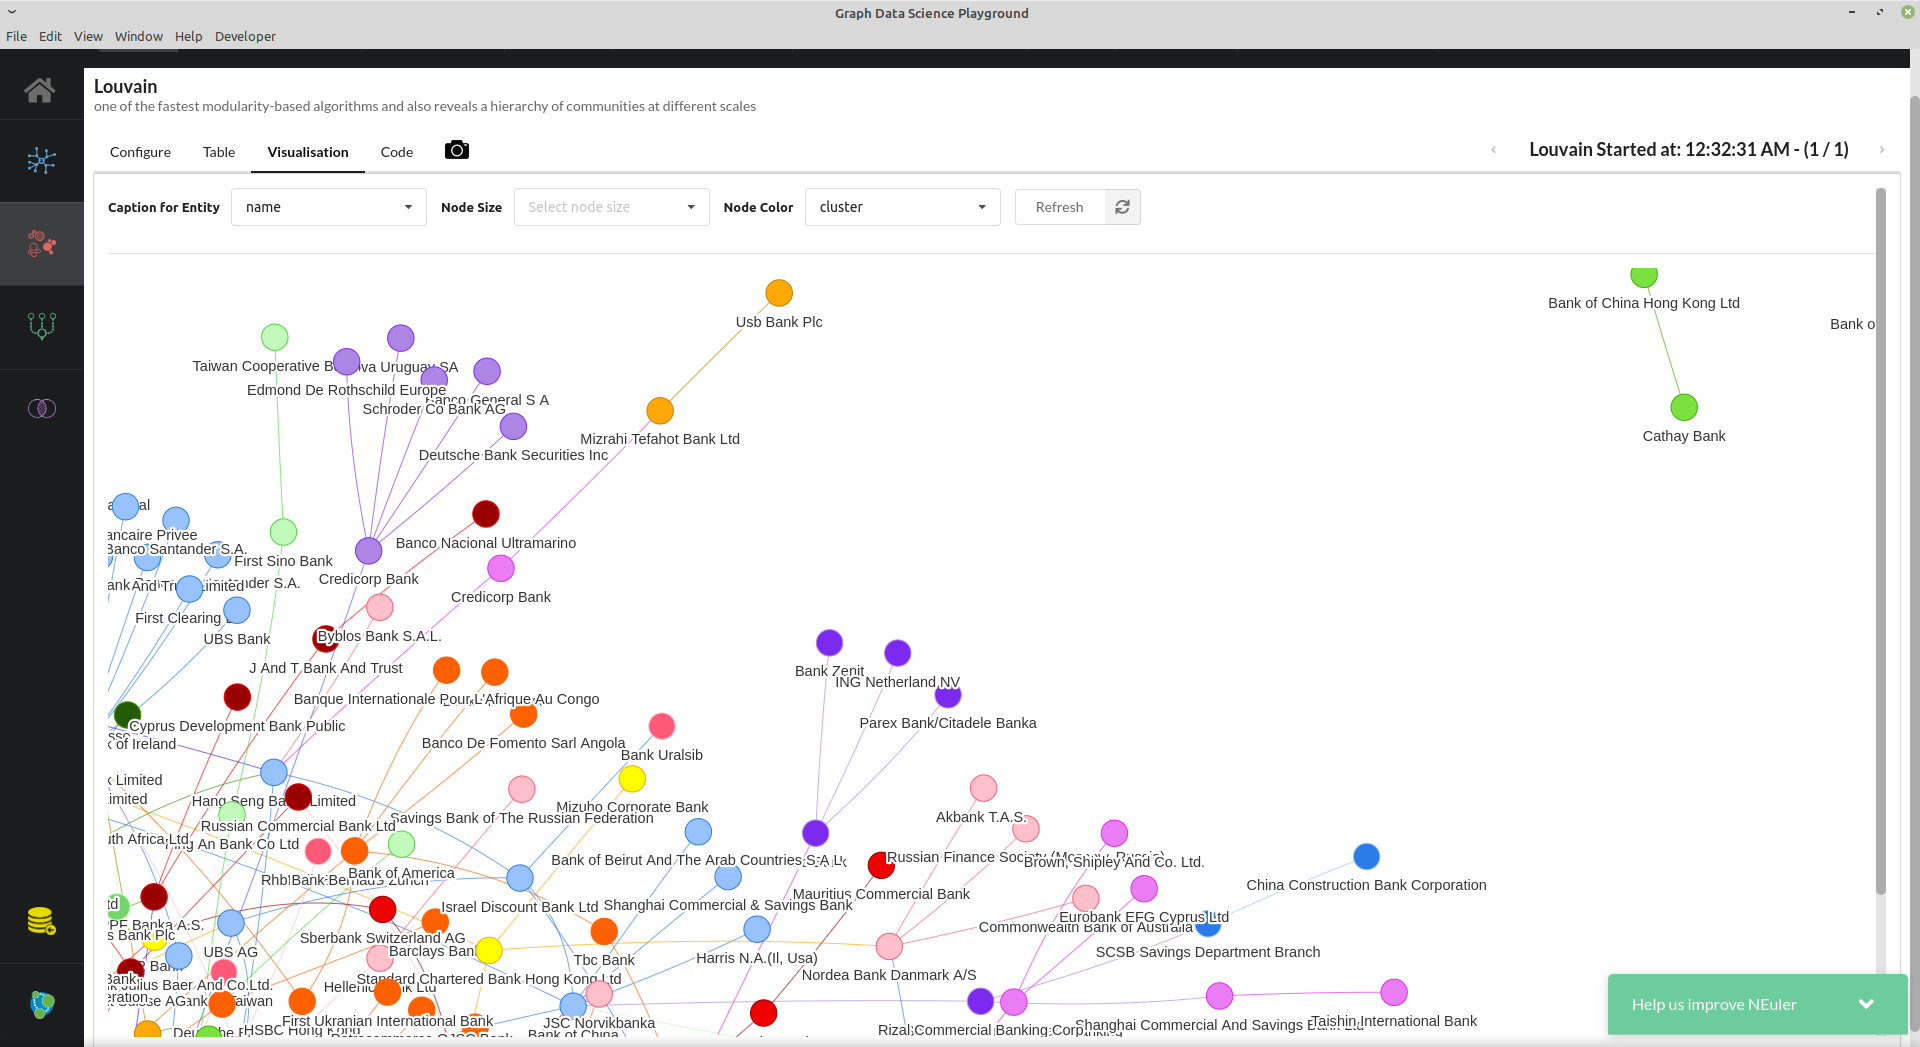
Then, on top of that projected graph, we run a clustering algorithm to identify clusters of banks exchanging money.
MATCH (from:Entity)<-[:ORIGINATOR]-(f:Filing)-[:BENEFITS]->(to:Entity)
WITH FROM, TO, sum(f.amount) as sum
MERGE (FROM)-[t:TRANSFERRED]->(to) set t.amount=sum
Then we can run the Louvain clustering algorithm.

Or we can find the banks who received the most money transitively by using the PageRank algorithm. In this case, these banks include:

Or the banks can be visualized by node size using Neo4j Bloom:

Conclusion
The FinCEN Files investigation is not the first project to reveal international criminal activities moving through the financial system, and it certainly won’t be the last.
Global investigations at this scale – whether conducted by journalism organizations, government bodies or self-policing enterprises – have shown time and again that they require the power of the entire graph technology stack: graph database, graph data visualization and graph data science.
When investigators can store, query, explore and analyze the connections in their data, no dark secrets are safe.
Ready to dig in deeper to graphs and the FinCEN Files?
Check out the Neo4j FinCEN Files Sandbox.
Further resources
News:
- FinCEN Files investigation: https://www.icij.org/investigations/fincen-files/
- FinCEN Files story on BuzzFeed News: https://www.buzzfeednews.com/article/jasonleopold/fincen-files-financial-scandal-criminal-networks
For Developers:
- Explore the data: https://www.icij.org/investigations/fincen-files/explore-the-fincen-files-data/
- Panama Papers Sandbox: https://sandbox.neo4j.com/?usecase=icij-panama-papers/
- Developer guide for Neo4j Graph Algorithms: https://neo4j.com/developer/graph-data-science/graph-algorithms/
- Anti-Money Laundering Solution Guide: https://neo4j.com/whitepapers/anti-money-laundering-framework-solution-guide/
Tools:
- Neo4j Graph Database: https://neo4j.com/neo4j-graph-database/
- Linkurious graph visualization: https://linkurio.us/
- Neo4j Desktop (including Neo4j Browser): https://neo4j.com/download/
- Neo4j Bloom: https://neo4j.com/product/bloom/
- Neo4j Graph Data Science library: https://neo4j.com/graph-data-science-library/
Use Cases:
- Knowledge graphs: https://neo4j.com/use-cases/knowledge-graph/
- Fraud detection: https://neo4j.com/use-cases/fraud-detection/
Past Investigations:
- Analyzing the Panama Papers with Neo4j: https://neo4j.com/blog/analyzing-panama-papers-neo4j/
- Analyzing the Paradise Papers with Neo4j: https://neo4j.com/blog/analyzing-paradise-papers-neo4j/
- Panama Papers Case Study: https://neo4j.com/case-studies/the-international-consortium-of-investigative-journalists-icij/
- Swiss Leaks Case Study: https://neo4j.com/case-studies/icij/
Get Started:
- Graph Databases for Beginners ebook: https://neo4j.com/books/graph-databases-beginners-ebook/
- Graph Databases for Dummies: https://neo4j.com/graph-databases-for-dummies/
- Graph Databases (O’Reilly Media): https://neo4j.com/graph-databases-book/
Share Article


Explore
Related Articles
Fraud rings hide in the connections: Graph-Enriched Detection for Databricks Genie with Neo4j

APRA just put the financial sector on notice over AI. Government agencies need to take notes.
Detect fraud faster with a transaction graph

GraphRAG in action: A simple agent for know-your-customer investigations