Effective Internal Risk Models for FRTB Compliance: Risk Modeling Requires Data Lineage

Senior Director of Global Solutions, Neo4j
4 min read
Where did the data come from, originally? That’s a key question that the Fundamental Review of the Trading Book (FRTB) rules will require banks to answer in real-time. Banks must be able to decompose risk models to uncover the full lineage of investment data. Think of it as Ancestry.com for data.
In this series on the FRTB, we explore what it takes to create effective internal risk models using a graph database like Neo4j. Last week, we looked at the major areas impacted by the FRTB. This week we’ll explore the relationship between risk modeling and data lineage, and next week we’ll describe why modern graph technology is an effective foundation for compliance applications.
Risk Modeling Requires Data Lineage
Risk modeling – especially at large banks, hedge funds and aggressive investment houses – has complex requirements and requires organizations to trace data connections across a web of investment baskets, holdings, financial instruments and pricing data.
FRTB requirements for historical testing require banks to decompose risk models into their individual risk components and trace back through time to available pricing and position information. This requires data managers to uncover the lineage of their investment information, including:
- Which data is relevant
- How the data is sourced or calculated
- Whether data sources are authentic and authoritative
- What risk factors affect all upstream information dependencies
- Whether all calculations are based on approved BCBS aggregation rules
- Where and how the data maps into the bank’s risk model
Banks must be able to trace data dependencies through many levels of complexity before reaching original, authoritative data sources – a crucial requirement that existing bank systems simply can’t address. This shortcoming is a key reason why FRTB compliance requirements have been delayed from 2019 to January 2022.
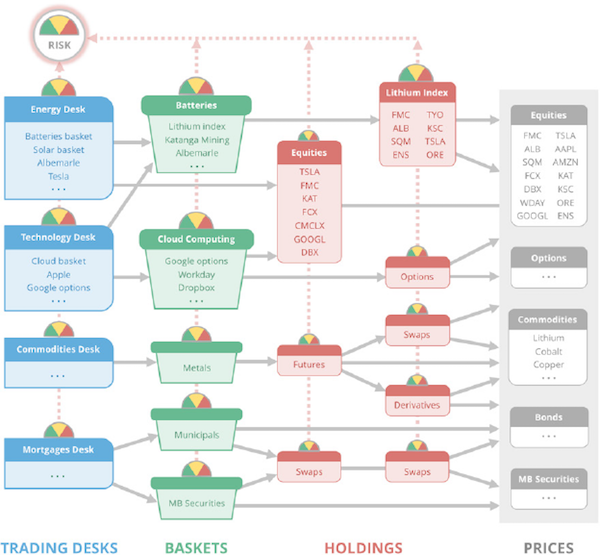
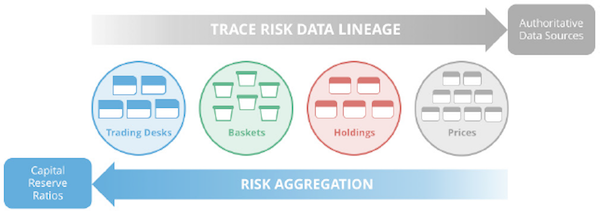
The diagram above illustrates the connectedness of investment data, but it is a gross simplification of the actual interdependencies that exist among trading desks, investment baskets, investment instruments and market prices.
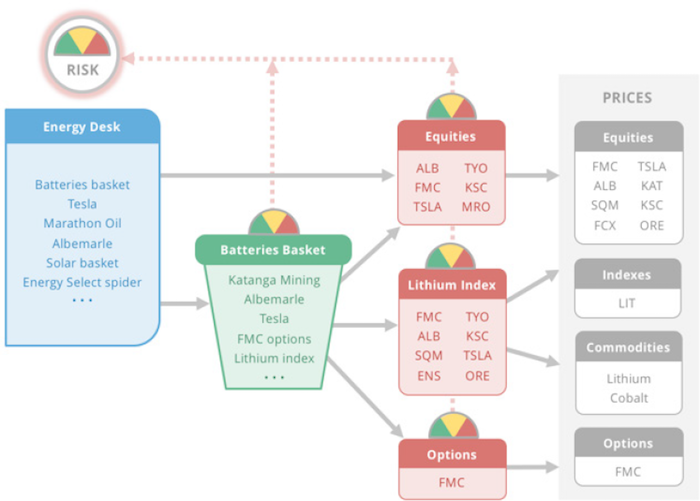
The image below drills down deeper on the Batteries Basket but still presents a high-level picture of the connected data that drives investment risk analysis.
Building and Testing Internal Risk Models
After internal analysts identify risk factors in investment strategies, banks must link all interrelated risk data to ensure they can trace risk inherent in their models now and in the future. In the diagram below, tracing data lineage starts at the trading desk and moves to the right through baskets, holdings and prices, eventually reaching authoritative data sources on the right.
Once the lineage of each investment position is modeled back to its most basic components, risk applications plug prices into the model and move back to the left, aggregating risk back up to the level of the trading desk. At the end of the analysis, the risk model calculates a capital reserve ratio that mitigates the risk inherent in the investment strategy.
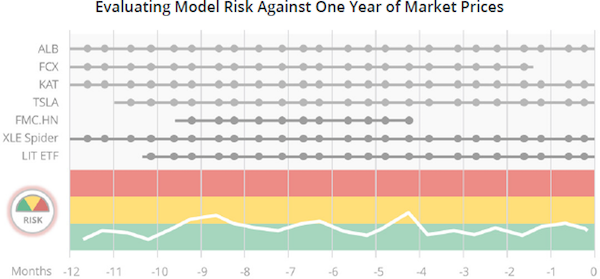
Banks must then prove the accuracy of those models all the way back to 2007 using real data for each individual risk factor to which trading desks are exposed. After the internal risk models are backtested historically and approved by regulators, banks must continuously maintain them by evaluating 24 dates from the last year using real position and pricing data with no two evaluations more than one month apart.
When banks fail to meet this requirement for any risk, it is deemed a non-modellable risk factor (NMRF), and the bank must set aside capital to offset the increased risk.
Data Governance Is Key to Risk Modeling
Modeling bank risk is challenging due to a variety of investment, regulatory and data management factors. At virtually all banks, investment data detailing trades, holdings, historical prices and market prices reside in discrete data silos. And those silos often exist at various trading desks or other locations rather than centralized at the institutional level – making risk data management all the more daunting.
More importantly, the demands of bank risk modeling go far beyond the calculations used in traditional financial and analytic models. The added complexity stems from the interrelatedness and complexity of market information and the ever-rising diversity and complexity of investment instruments and positions.
Those dependencies can cascade many levels deep, making their associated risks all but impossible to visualize or calculate. That very interdependence brought many funds and trading desks down like a house of cards in the wake of the Lehman Brothers collapse a decade ago.
These complexities demand that compliance efforts begin with a bullet-proof data governance foundation. Without such a framework, risk aggregation, reserve calculations and required reporting are nearly impossible to achieve.
Conclusion
Banks need effective internal risk models that can trace many layers of dependencies. As prices and positions change in everyday operations, internal models must reevaluate risk multiple times a day, and more often during market events.
In the coming weeks, we’ll take a closer look at how modern graph technology provides a strong foundation for risk modeling that serves both compliance requirements and drives innovation.
Find out why leading financial services firms rely on Neo4j graph technology for compliance and innovation, Effective Internal Risk Models Require a New Technology Foundation. Click below to get your free copy.
Catch up with the rest of the FRTB Compliance and Neo4j blog series:
Share Article


Explore
Related Articles

Top 10 Graph Database Use Cases (With Real-World Case Studies)

Neo4j Expands AWS Collaboration With New Competencies in Finance, Automotive, GenAI, and ML

Top Speakers to Watch Out for at GraphSummit Europe 2023

Graph for Equitable Financial Opportunities: The 5-Minute Interview With Arthur Zverko
Standard Chartered: Threat Intelligence Using Knowledge Graphs