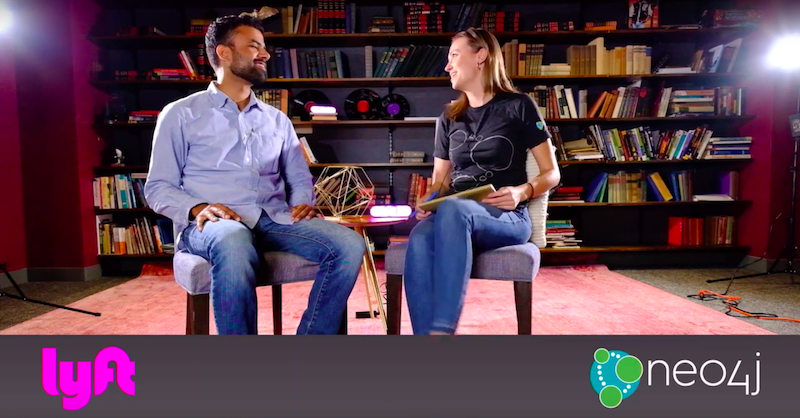
Live from Lyft: Q&A with Mark Grover, product manager at Lyft

Product Marketing Manager, Neo4j
15 min read
For more videos like this one, check out upcoming and on-demand video content in the Neo4j Webinar library.
Mark Grover is a product manager at Lyft, working on data projects. He is a founder of the open-source data discovery platform Amundsen, which we’ll be getting into today.
Grover is co-author of the Hadoop Application Architectures book, which has sold over 10,000 copies worldwide, and he’s also a frequent contributor to many open source projects in the big data space.
Tell us about data discovery at Lyft.
Mark Grover: Lyft has grown a lot over the last few years. Today, we do over 50 million rides a month. As Lyft has grown, the amount of data we store and the amount of data we process in order to serve those experiences for our riders and our drivers has also increased.
This problem obviously is not unique to Lyft. It exists at other places, too. At the same time, the number of people in the company has grown. Smart, capable individuals are joining the company and they want to make a change and drive decisions based on data, but they don’t have the context. They don’t understand the variety of information and data we have available in the organization.
Those two problems, both the growth of data and the growth of the number of employees, and people who want to use that data, has led to this unique problem. You don’t know if this data exists – has someone done this analysis or work before? That’s the first problem.
The second problem is, if you find this data you need to figure out if it’s still trustworthy and the right data to use. That led to this issue of data discovery and data trust, which we embarked on solving.
Who are the people doing this data discovery?
Grover: There are various categories of users. The first kind of user is what I call the analyst, data scientist or an engineer. This person is somebody who’s using fairly raw fundamental datasets to do analysis.
The second category of users is the kind of user who’s consuming the work that’s being done by the analyst persona to make decisions. This is a person who may use a dashboard or a machine learning model that was generated by the analyst to then employ decisions to drive the business forward.
The first user, the analyst persona, is what we focused on in the first version – the MVP of Amundsen. For that persona, our goal was very simple.
The first was to help them find the data very easily, in a very opinionated way, because we know what data is more trustworthy. The second is to expose a bunch of relevant information where possible and have a model for trust. That way, they know when they’re accessing trustworthy data.
How was this data discovery done in the past?
Grover: Previously, they were going around and asking a bunch of people on Slack. Questions like, “Is this the right table for me to use?” Even if I understood the table, questions still remain: “Is this column the right column to use? Is it still getting populated?”
If you were a little more savvy, maybe you’ve been in the organization long enough, you could go to the tools like Airflow, which is our ETL tool, and try to figure out if this table is still being populated.
It was based mainly on tribal knowledge and maybe some skillset in the amount of time you had in the organization to figure out which tool or which person you need to ask.
Tell us about the decision to build Amundsen.
Grover: We reached a crossroad. We had to decide if we wanted to build, buy or adopt. With adoption, we had the choice to adopt an open source project to do the same work.
We wanted to have trust embodied in the solution itself, so things more relevant or trustworthy to users showed up earlier in the search results.
We wanted there to be very little manual curation. As the company is growing, we can’t rely on a lot of manual intervention of metadata and curation to drive trust. We wanted to rely, as much as possible, on automated factors to drive that.
The third criteria was a slight preference to it being open source. We believe in not being locked down; we want to be driving the open source community forward.
Ultimately, we decided that the experience we wanted wasn’t out there. There wasn’t any open source project that we could rely on and we decided we wanted to build this ourselves and build it open source from the get-go. That project is what became Amundsen.
As this process began, we realized we were gathering all this interesting metadata that we wanted to use for data discovery trusts. Then we saw that we could use Amundsen for other applications as well.
We ended up building a data discovery application on top; but at the bottom is this metadata engine, the core of all the information that people need to use to power the data discovery application.
How is Amundsen being used today?
Grover: The first application of Amundsen is data discovery.
You go to Amundsen. The main flow of the experience is a discovery or search experience. Let’s say you were a new data scientist who joins the estimated time of arrival (ETA) team and you want to improve the ETAs for riders all across the country.
The first thing you want to do is see where’s the ETA’s dataset and if someone has done that analysis before. You type ETA in the search box and you get a list of results. These results are powered in a way similar to PageRank. These are rated based on how commonly a table is queried.
If a table is queried more often, you would find that up on the top of the search results. If it’s queried less often, it’s down at the bottom. Search results are also based on other queries, as in when was the table last populated or who else is using that table within your team, so on and so forth.
You click on the first result that’s super relevant to you, and then you go on to the table detail page. Here, you have up-to-date information about the schema of the table. It has descriptions that are fetched from the underlying source of the table.
Then, we have some additional metadata around this. You have information around who owns this table, which is one of the very small pieces of information that’s curated. So someone actually has to go and own the table. We have a list of who frequently uses that table. Oftentimes, those people act as a good proxy for the owner of the table.
We have a quick preview of the data if you have access to the dataset, we have information about various stats of the column so a profile of the shape of the data, so you see standard deviations, the means and maxes and so on.
The goal is that you come to this page and you’re able to quickly figure out if you trust this data or not. Then, if you do trust it, then you move on to the next step of your journey. The next step is doing the analysis or writing a Python notebook or writing a sequel query on top of this data.
That is what the Amundsen experience is like today.
This process is heavily focused on the first node of the graph, which is tables. That’s not the only node we have in the graph. The other node in the graph are people. People like Greta and myself are nodes in that graph. If I join your team, I go to your page and see what tables does Greta own, what does she bookmark, and what is she a frequent user of.
What does the Lyft tech stack look like?
Grover: There are four big components of the architecture for Amundsen. The first component is a crawler. We call it data builder. Similar to how Google has these robots that crawl the internet, we do the same thing.
We crawl our databases, our dashboard systems and our HR systems to get information about which tables were newly created since the last run, which columns were added, who are the new employees who got into the system, who are the ones that left the company… and we need to archive them. That’s the first piece of the architecture.
The second piece of the architecture is a search engine. We based it on top of Elasticsearch and this powers our search by providing relevance to you based on search terms, your position in the company, as well as the popularity of the tables. This is called a search service.
The third component is a front-end service that hits this search system to get the information. It also hits the fourth component, which is the most interesting one – the graph database. That’s called the metadata repository and has all of our information about tables and people and the linkages between them and the lineages.
Can you talk about the decision to bring in graphs?
Grover: We have different kinds of nodes. The first node we tried to put in our graph was tables and then we added people. Then there are linkages if you own a table, if you bookmark a table, if you use a table – these are all linkages in our graph.
Within the table space, you would notice that there’s lineage across tables.
I could use one table to create another table, and then across these spaces I could create or use a table or a collection of tables to then create a dashboard. This lineage could have been represented in any system. However, it was very obvious that this was a graph relationship, both within a certain type of node as well as across these multiple nodes.
We wanted to continue in the graph database direction. We added the first node of tables and then went for the second one. The second node of tables were people, and the third one was dashboards.
What does the future of Amundsen look like?
Grover: I think we are right at the beginning of this journey. We try to solve this data discovery problem with trust and we ended up gathering a whole bunch of metadata.
To give you a flavor of the metadata, we gather information from our ETL systems and our databases. Keep in mind, this is just the metadata around tables, schemas and audit logs. We hook onto who’s accessing what tables and when to power this search interface within Amundsen. Then we add people. Then, you have links between ownership and bookmarking and so on and so forth.
What we realized along the way is we have this great metadata around who’s using what tables when, we also have data around what data exists in the organization, right? Now, we start building other applications on top of this.
Can you share an example?
GDPR is top-of-mind for many of the European folks who work in the data space. CCPA, California’s version of GDPR, is rolling in on January 1st, 2020. A lot of us in California are thinking about that: If I know all the information about where our data is stored, if I am able to tag all these columns with, whether this is personal and private and then use this information.
I already know who’s accessing this data, I have a governance system based on this and that’s the second application that’s being built.
The third application that’s top-of-mind is around ETL and data quality. As data is flowing through the system, we have profiles of all the tables and we use heuristics based on those profiles to see whether the data that’s going in today is meant to be along the lines of what it was yesterday.
We allow for some percentage differences, then build heuristics around that. One could augment these heuristics with some manual tests as well.
The future, as I see, is that we’ve got a full-fledged metadata repository on which we’re building many applications on top of. Discovery and trust is one application, compliance is another application, and then ETL and data quality are a third to the same.
Initially, I was talking about the first category of user, the analyst. The second category of users are the consumers, the decision-makers of this data. These people don’t necessarily want to write SQL. Actually, they want there to be standard, canonicalized dashboards that they make decisions off of and drive the business forward.
All of a sudden, you see from this variety of different dashboards you have – which ones are trustworthy, which ones were last populated, who’s the owner for them, who are the frequent viewers, who are the frequent editors – and install that same problem of data trust in a new space of dashboards.
Within that application, you could also see streams. As we’re doing more stream and compute, we need to discover streams and see which streams are trustworthy, find which streams actually map to the datasets so you know that this stream and this table are actually the same thing.
Users need to know they’re always consistent so you use them in the streaming equivalent of this batch application you may have had. Not only are we going broad, we’re also going deep in those applications and solving for trust across various different areas.
What’s coming next for data productivity?
I imagine a world in which you go to your computer, as an analyst or a data scientist, and you open this page where you are able to see a search for information and also see push information that is relevant to you.
If you own a table or you’re a frequent user of a dashboard and any changes happen, you get notified. This becomes your hub of information. You would be able to search for new things, tag, move things around, learn about any changes that are happening, if there’s an incident… that information gets pushed too. Instead of you searching around for tribal knowledge, that experience really needs to be personalized to you.
The second part is, as the amount of data is increasing, we need to really think about trust and have an opinion on trust. No longer will we say, “Hey, you figure out on your own if this is trustworthy.”
That comes with the caution. I can’t tell what could be trustworthy for everybody. I know for some people this may be trustworthy but others may have to decipher that on their own. In such cases, I show the underlying markers. However, in general, I think tools need to be more opinionated where you showcase your experience and all the relevant information.
What’s been the adoption for Amundsen?
Lyft measures adoption in a few metrics.
The first metric is the number of users use this tool every week, and then the second one is a CSAT score to see how well people love this tool. The third metric is how much improvement and productivity we’ve seen based on this tool.
We currently have about just over 200 scientists in the company, and the weekly active users of Amundsen are actually more than twice that.
You’ve got these scientists whose day job is working with data and being that analyst profile. We have more people who are coming to this tool and loving it. These people are coming from various different domains in the company. An operations analyst or a customer service analyst are finding data, asking others about how to find data, and reaching out as a tool and coming to this tool every week.
Adoption has been superb and we’ve seen that growth very organically within the company. The CSATs also represent this. It’s over 8 1/2 out of 10 and people are just coming up and saying it’s a great tool. We’ve got a lot more work, but the initial uptake has been amazing.
In terms of productivity, that one is a harder-to-manage metric and also to instrument. Based on qualitative research that we have done, we found that data scientists and research scientists are over 1/3 of their time, 33% more productive just because they have to spend less time on discovery.
Anything you can tell us about open source?
We’ve recently open sourced this, and one thing we feel very strongly about is elevating the rest of the data community with us. We have learned a lot from them and we want to share it back to the community. We have over 10 companies contribute to Amundsen.
ING has been the first company to deploy Amundsen in production after Lyft, and they’ve been using it for the same data discovery and trust. There are many others who are contributing integration with other databases, like BigQuery and PostgreSQL and Redshift and building systems that integrate really well. The open source adoption has been really pleasantly surprising as well.
Click below to register for access to the Neo4j Webinar library and master the world of graph technology.
Share Article


Explore
Related Articles

SumoDB in Neo4j: Chaining Multiple Graph Algorithms in Snowflake — Part 3


Why machines need embeddings: Turning graph structure into features
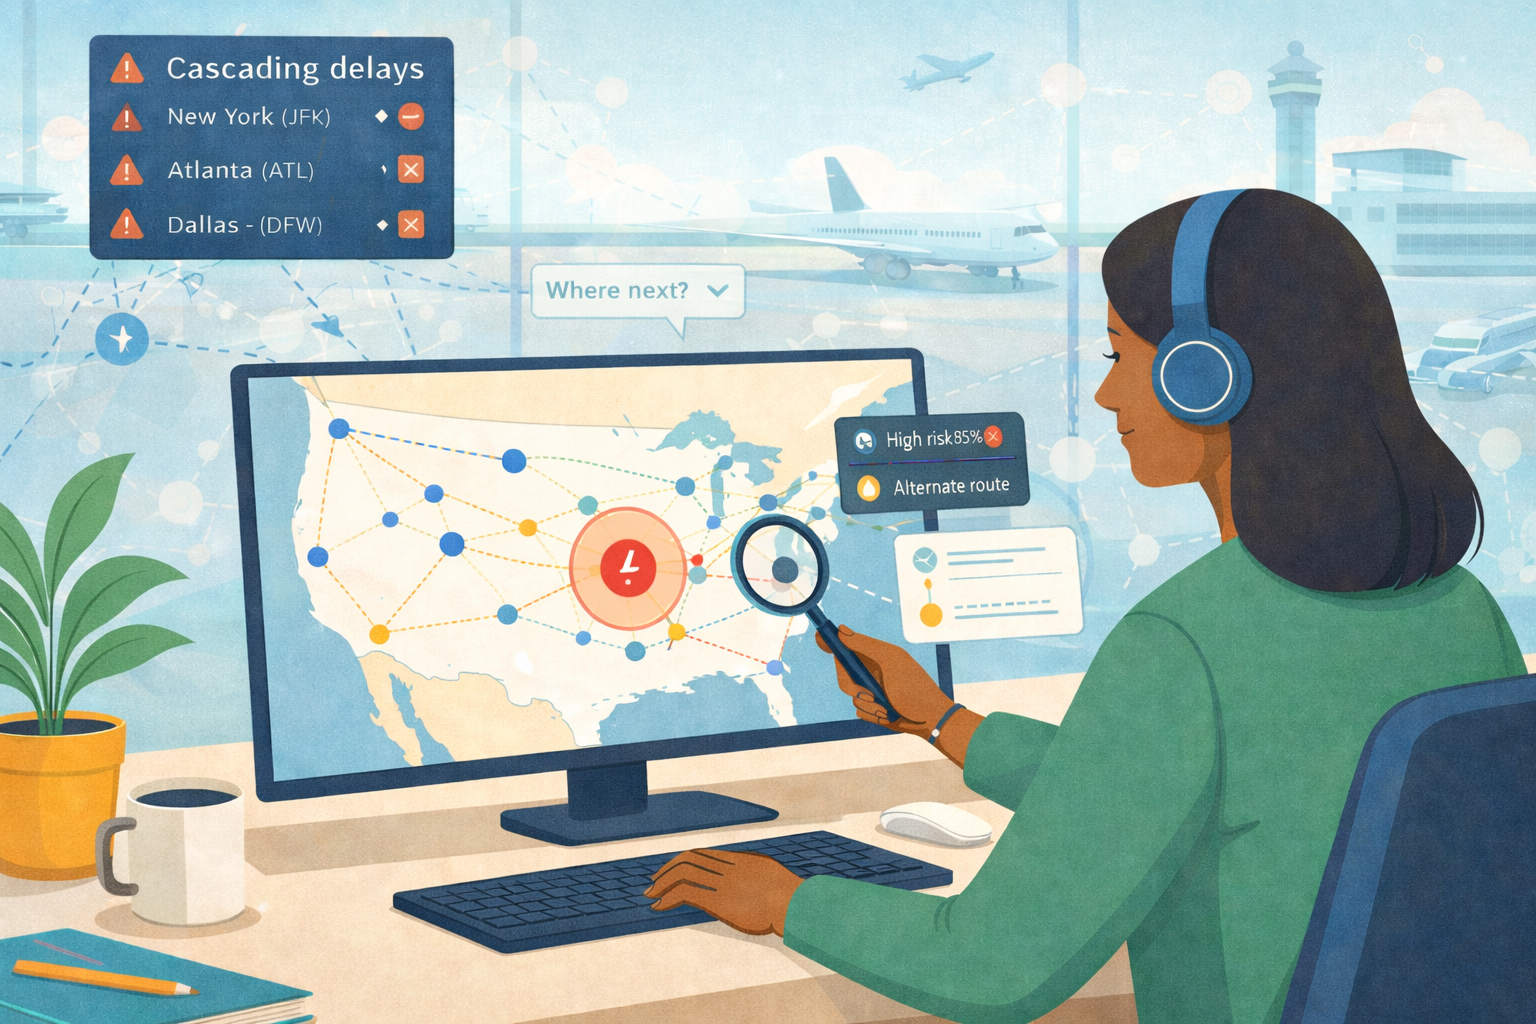
Finding hidden bottlenecks in flight networks with Aura graph analytics on Databricks