Predictions for 2023: What’s on the horizon for graph technology?

Vice President, APAC Marketing
32 min read

It’s always a pleasure speaking with Jim Webber, Neo4j’s Chief Scientist. I got the opportunity to sit down with him for an extensive conversation that touched on everything from the challenges of the COVID years, some recent product launches at Neo4j, the graph ecosystem in APAC and beyond, and his predictions for what’s in store for graph in the year 2023. (Hint: Graphs aren’t going away.)
His perspective on the past, future, and current state of graphs offers you readers an expert take on this technology that will soon seem ubiquitous. Take a read through it and brace yourself for a big year ahead for us graphistas. Enjoy!
Daniel Ng: Happy New Year everyone. To kick off 2023, we have the great pleasure of having Dr. Jim Weber with us here today, the Chief Scientist at Neo4j, to review what we did and how graph technology has grown in 2022, and second, what he is thinking about in 2023. Welcome Jim, and Happy New Year to you and your family.
Jim Webber: Thank you, Daniel. Thank you for inviting me. Happy New Year everyone. I mean, 2022 was kind of an insane year, right? Coming out of lockdown and then hyper acceleration, and then conflict, and recession, and it’s like a whole decade’s worth of events condensed into a single year. I’m hoping 2023 might be slightly more relaxed in pace than 2022’s frenetic levels of activity.
Daniel Ng: Is that a prediction or a hope, Jim?
Jim Webber: It’s a hope, Daniel. I mean, look, we’ve all lived through the last few years of insanity, and I think that it would be a bold prediction to say that 2023 was going to be a chilled out year, given the last few years of craziness that we’ve all managed to live through. So fingers crossed, It’s a hope, but if I was forced to make a prediction, I think 2023 is going to be just as insane as 2022.
Daniel Ng: Or even more.
Jim Webber: Or even more.
Daniel Ng: And if flights are anything to go by, it’s not going to get any easier than 2020.
Reflecting on these COVID years
Jim Webber: It’s not going to get any easier. Look, I think at the business level, which is ultimately the domain we serve as technologists, providing tools for people to build resilient digital businesses, I think the business level is increasingly challenging in 2023. Here we are, we’ve got major economies in recession.
I’m here in the UK. We’ve had a disastrous run of form. Some might even say slightly self-inflicted, but we’ve had a disastrous run of form here. But we are not alone in finding the headwinds there. I think what that means for businesses – small, medium, and large – is that they’re looking for their technological backbone to provide resilience and efficiency through these more difficult times.
So we are all slightly hunkering down, looking for that opportunity when we can start to perhaps creep out from under the shelter we’ve been in. And in order to do that, we increasingly depend on a robust kind of digital nervous system, and I think those businesses that have those robust digital nervous systems are going to be the ones that accelerate out of these weird times more quickly.
Those that haven’t invested in that, those that are still manually processing, blah blah blah – they’re going to struggle striking when the iron’s hot. They’re either going to be premature, and that’s a significant risk, or they’re going to be laggards missing out on significant opportunities. So I guess what I’m hoping we’ll do in 2023 is see the acceleration of competent digital businesses, even those businesses that do significant real world things. We’ll see the acceleration there I’m hoping, which can then spur the rest of the economy into something resembling its former self.
Daniel Ng: Yeah, I guess over here in APAC, we are blessed in a way to be the first region that faced COVID, and probably the first region to recover from it. I’m here in Singapore and we’re seeing a lot of transformation to digital – some force it, some just ride the wave. But you are absolutely right – I mean that’s not a prediction, that’s a reality today in terms of how the government and businesses are transforming themselves. And I think after COVID everyone’s thinking, “What’s next?”
Jim Webber: Well, I think you’re right across the whole region, from Australia and New Zealand, too, right? Across Asia we’ve had a very heterogeneous response to COVID, at least from a governmental level. Some governments were more cautious, some were less risk averse, and so on. But I think coming out of it, it’s almost an even starting line.
I think those regions, those countries, those states that are ready to seize the opportunity that they’ve embodied in their data are going to do faster, better, and more resiliently than those that aren’t. For what it’s worth, I don’t think that’s unique to the Asia Pacific region, but the Asia Pacific region, it seems to me, is prime to accelerate. You have economies in Asia Pacific, for example, the Aussies or the Indonesians, that always feel they’re about to just burst through and be the next big thing right now.
The region as a whole, I think, is laden with promise, and that promise will only be a reality if they can leverage the infrastructure to make it so. I think that’s why companies like Neo4j as a data provider are a key block of that infrastructure. I’m hoping that in the coming year we’ll be able to help people build compelling systems with that graph infrastructure that will help them kind of accelerate away from the starting line when things start to revert back to slightly normal. Although even now I realize saying the word “slightly normal” seems a bit more of a wild guess than a considered opinion.
Daniel Ng: I think we’ve heard of terms like “new normal,” and I really am more biased towards a term of “no normal.”
Jim Webber: I think you could be right. I mean, who knows what “normal” is for us in the coming years because since 2008, normal has evaporated – it feels like we’re in between paradigms now, right? So in 2008, at least for the west, the financialized world, the wheels fell off and then we struggled along for a while trying to figure out how to repair that. Then we were battered by the politics of nationalism, a pandemic, and so on. And I think the world here in 2023 – 15 years after the global financial crisis – looks substantially different, and it would be a tremendous mistake to go back and start to repair 2023 with a 2008 view, and a 2008 technology probably.
Graph milestones of 2022
Daniel Ng: Absolutely. So let’s kind of double click from a macroeconomic standpoint to a more technological standpoint, which I really want to pick your brain on. A little bit of a review on 2022. What are the major milestones, Jim, of graph technology in 2022? And what do you think is impacting businesses and governments in the world, and also in APAC in particular, which you are very familiar with?
Jim Webber: Yeah, I think 2022 was an incredible year. From Neo4j’s point of view, it was the most engineering intensive year we’ve ever had. So in 2022, we managed to invest, give or take, 200 engineers’ years worth of effort in the product, which is astonishing, right? Because when I joined Neo4j way back when – 12, 13 years ago – the very notion that we could put 200 engineering years into the product seemed like science fiction to us.
When we were a team of fewer than 10 people, the maximum we could do, if everyone was engineering, would be 10 engineer years per year. And of course we never managed that because one of the team members was way too stratospheric to be coding with us anymore.
But look, I think what’s happened for us is manifold. We released Neo4j 5, an incredibly important release of the core graph database of Neo4j. It’s very much aimed at the kind of businesses that I mentioned earlier, those people looking to get a dependable digital backbone, or nervous system as you will.
Neo4j 5 is a huge step forward for graph database tech. It has a refresh effectively across the board in all layers of the stack – from the query language stack, some queries will now be two or three orders of magnitude faster, down through the clustering stack, where we now have a feature called autonomous clusters. I’ll come back to that in a minute, but it really means that you can run very large clusters of Neo4j single purpose or multi use. And even at the bottom, our storage engine – the core of the database that deals with the movement of your graph data as bytes between various devices in a computer – is completely revamped and faster as well.
Neo4j 5 and the autonomous clustering gamechanger
Jim Webber: if I zoom slightly out of the weeds, I think autonomous clustering was one of the big features of Neo4j, and it addresses a common enterprise need. So what we’ve seen increasingly during my tenure at Neo4j, and actually quite a lot in 2022, are businesses – particularly towards the medium and large businesses – doing more graphs.
A few years ago, they dipped their toes in graphs, and they kind of liked it. A few projects emerged kind of organically around the business, as word of mouth spread. Then they institutionalized it. So Neo4j is the graph database of choice or the default graph database, but for many large businesses we made them run each graph as a separate cluster. Logically at an architectural level, you could say, “Well, that’s fine.”
It turns out that what they really wanted was to run one cluster and have many graphs on it, each that serves a particular department or business need. And that’s what autonomous clusters do. So now you’re in the position where you can say, “Look, my business needs 10 or a hundred servers that will run my graph workload.” Okay, I’ll bring those into being from the Cloud or from my data center. Nnow onto those servers, individual users can – security permissions permitting – effectively declare databases into existence.
They say, “Look, I’m one of the product catalog folks and I need a database please. And I’d like it to have a redundancy of three.” So that means there’s always three copies of my data somewhere around these hundred servers. And you in the sales department, for example, Daniel, you say, “Well, I need my sales graph and that needs to have redundancy of five because I need a bit more safety, and also I need a bit more scale from this thing.”
That gets declared onto those hundred servers. And then what autonomous clustering does, it makes sure that invariant, the redundancy invariant, is always present, even when machines die and get replaced and that kind of thing. It also moves the databases around so that they never contend for access to resources.
So if you’ve got two particular databases that are, for example, doing very heavy writes, autonomous clusters will try to separate them out so they are on a mutually, lightly used server so you get better throughput. What this means, particularly for the larger businesses, is you can bring that single cluster into being and then let your folks self-serve. And for the most part, the cluster manages itself – it moves things around, it heals when bad things happen, and so on. Now accompanying that, like I say, autonomous clusters gives you a good flavor of what it does.
Neo4j operations manager for users and businesses
Jim Webber: On top of that, we released a very ops focused product called Neo4j Operations Manager. We call it NOM, which sounds delicious. For those cases where you actually want to have some human operational input into that cluster, the operations manager now gives you a rich dashboard on the system.
We’ve started to collect a bunch of useful metrics and data to present to the operations professional in a very meaningful way, so they can intervene in the system. Bring more machines online, drop old graphs, bring new graphs into being, and so on, and do low level things around grabbing hold of security logs, and making sure they’re all fine, that kind of stuff. I think what you’ll find now as an operator of someone that’s in a graph-friendly, graph-amenable business, is that your job just got a lot more pleasant – you’ll be able to get a lot more work done with a lot less effort.
Indeed, your end users will be able to bring graphs into fruition, bring graphs into being, much more easily, which is a really happy thing, right? Because I think there’s a lot of valuable graphs, and as much as I helped build the Neo4j clustering software, and I love that stuff – it’s very technical and nerdy and wonderful, but the value’s not there. That’s not where the value’s released. The value is released when we solve a business problem. So the ops stuff and all the technical nerding makes it that much closer to solving the valuable business problem.
Daniel Ng: Now that we have NOM, NOM, NOM on a lot of the technical part of it, what would be the biggest impact of that on a use case or an industry? From a business standpoint, if you could explain, that would be wonderful.
Jim Webber: I’ve always maintained, and I think this is increasingly evident, that graphs are a horizontal technology. When I first started in graphs, my first graph project prior to joining Neo4j, when I’d heard of the technology and was using it in the business, I was working in a telecoms business, and my problem was product recommendations. It turns out that’s really humanely modeled as a graph.
Over the years before I joined Neo4j, as a user I was doing similar things around product recommendations, fraud detection, single points of failure in telecoms and data networks, and so on. And then over the years at Neo4j, I’ve seen things like healthcare pathways, logistics, fancy finance things, governmental things – both at the local government and national government level. I’ve seen policing, intelligence services. I’ve seen train and municipal public transport systems built with graphs – they are a very horizontal play.
If I was a business now looking to solve a difficult data problem because it would drive some opportunity for me, I think the question for the technical people involved in that business would be, “Well, why wouldn’t you choose graphs?” If you have a system that needs a high fidelity model – and many systems have high fidelity domain models in them – then graphs are far and away the most pleasant, humane, and performant way of capturing that data model, of bringing a high fidelity, complicated real world data model into your system.
Try to capture all of that interconnectedness, all of that model where parts of it are uniform, parts of it are not uniform, parts of it are dense, parts of it sparse, parts of it regular, parts of it irregular – try to capture that with a relational database or a document database or a column database.
By the way, I believe each of those three other categories are excellent databases. But trying to capture that real world model, where data is never conveniently square or never conveniently columnar, it’s an absolutely terribly hard task for those databases, and you’ll get performance penalties because those databases don’t understand connections.
As a technologist, if I’m tasked with building a new data system, something that has a complex domain model, the question in 2023 would be – and I would challenge all of the technologies listening to this – “Why wouldn’t graphs be your first choice?” That’s very different from where we’ve been perhaps historically, where as a community we’ve been increasingly comfortable with graphs. I’ve been comfortable with graphs for a decade or more and I’ve always said, “Well, why wouldn’t graphs be one of your choices?”
I think now, given the operational foundation that we have and the knowledge about graphs that spread around the community – which, of course, is itself a graph – now I’m confident to say, “Why wouldn’t graphs be your first choice database for this project?” In a lot of cases, if you look at your project as a technologist and you set aside your biases and the tools that you prefer, and the tool chains that you today feel comfortable with, I think a lot of the time you would honestly say, “Actually a graph would meet my needs very well.”
Why businesses should be up for the Graph Challenge
Jim Webber: Now of course, Daniel, there are practical things here. Not everyone on their team will know graphs and there’s going to be a learning curve. That learning curve may not be to the taste of some people, and they will fall back to documents or relational what have you, and they will just have to work extra hard to make those systems vaguely work using those technologies.
But for those folks up for the challenge, and it’s not a huge challenge to up-skilling graphs, I think once you get over that learning curve as millions of people have, it really isn’t so difficult. I think it’s going to make you feel happy once you get over it.
Daniel Ng: You were here last year helping us with GraphSummit, helping people understand “Why graphs and what do we do with them, and how therefore can we use them?” We will repeat GraphSummit this year and hopefully we’ll see you here as well.
If you look at the lay of the land in APAC, I have a very simple mind, Jim – the more people, the more data, because people produce data. As a factoid, three of the world’s four largest populations are here in APAC, including India and Indonesia. So that becomes a very important impetus where people say, “Hey, I need technology at scale because I’ve got so much data I need to ingest and play with.”
Graph predictions for 2023
Daniel Ng: Let’s move on to a little bit about predictions. Let’s not be greedy and go for 10 or whatever – maybe a trilogy would be good. What would you think the graph world would see as a prediction of how it would help businesses scale, and run faster vis-à-vis the kind of market that we inherited from 2022 into 2023?
Jim Webber: I’ll reflect that back. You just mentioned the time I was fortunate to spend with the team over there in Asia Pacific, and there were definitely cohorts amongst the people I met – there were a whole bunch of graph aficionados. So it’s very clear there are a bunch of people across the region who are seriously good at graphs to the point where I fear for my job. They are really very, very good.
And then there are a bunch of people that I guess would consider themselves journeymen, or novices who’ve kind of done a bit of graph and they’re intrigued to maybe upskill or learn more. Then there’s a third set of people who are completely new, curious people who’ve heard of graph, perhaps understand a little about what it might do for them, but generally they’re an open page and would like to learn.
What I saw across the whole region when I was out there with you was a genuine sense of some motion building. People were coming to us because they were interested in graph databases or they were a relatively new community coming from the data science world. They had this inkling that graphs could do something for them. None of them really came to us, much to my great sadness, and said, “Hey, tell me about the low level bite buffers in this.” Or “How do I access backups?” That kind of stuff.
Most people were focused on the meat of the business problems across the board, and that was wonderful. It just felt like such a great mix of community across the region, but it led me to believe that there are perhaps three things – thank you for giving me a trilogy because it matches the three things that are in my head.
Jim Webber’s trilogy of trends
Jim Webber: Three things are going to be incredibly important. One is the graph database. I think that goes without saying because that’s Neo4j’s bread and butter. When we started the business, we were focused on building a novel kind of database that could solve difficult business problems. I think the graph database is going to grow tremendously this year as more people pick it up.
If I think about the cohorts in the APAC community, the novices are going to become experts, the new folks are going to become novices and journeymen, and so on – it’s going to grow. The base of that pyramid is going to grow, and graph databases underpin all of that. Huge value for businesses picking up this tech.
The second thing I’d say is graph data science. Now, I think graph data science will grow faster than graph database, albeit from a smaller starting point. The idea of graph data science is where you can bring in the topology of a graph, and be able to use that topology to analyze your data in a much richer way than you can in other data models that lack topology.
I’ll throw the machine learning elements into that bucket, because once you’ve got a topology, and if you want to extract, for example, features to build a predictive model, then the topological features of the graph, a page rank, or a centrality score or what have you, can also be used as a feature to make better predictive models.
So I’ll couple those together. I think graph data science and the machine learning motion are going to be huge as well. People already have a bunch of data – it’s going to encourage them to see that data as a graph because they’re going to get business benefits from it. Even improving the score of a classifier by 10 percent is going to bring enormous business benefits. That’s the kind of thing you can do when you mix graph features in with your other features.
I think the third thing that’s going to increase, and this is somewhat validated by metrics we see here at Neo4j, is that increasingly people are moving to the Cloud first. For most of Neo4j’s history, we built a database and we logically posted a CD ROM to you and you installed it. Double click setup.
Daniel Ng: Don’t remind me of computers.
Jim Webber: The good old days. But of course, that’s really very good for those organizations that have infrastructure – the large financial organizations, governments, and so on – that for whom having ownership of one or more data centers is perfectly normal. I think for a lot of other people who perhaps don’t want ownership of a data center, or that’s not in their strategic interest, they really want to be able to just switch on a graph database in their Cloud provider.
Now here we are in 2023. Neo4j has kind of climbed that hill now and we have a system called AuraDB, which is a Neo4j database as a service that runs in the three big western Clouds – AWS, Azure, and GCP. And the kind of twin of that is a service called Aura DS, or Aura data science, which is our graph data science as a service.
Those things are available to you, and I think increasingly in 2023 – particularly when people are newer to graphs, and the biggest part of our community is newer – they’re going to default to using the Cloud. I think Cloud’s going to be big for us this year. I think data science is going to be big for us, and of course it would be remiss of me not to say that the database itself is going to be big, because that’s still on a growing trend, Daniel.
The growth and endurance of the graph database
Jim Webber: By contemporary measures, graph databases have been growing up to 400 percent for the last decade or more, and they show no signs of letting up. Now, the statistically minded amongst the people listening in will say, “Well, look Jim, back in 2012 going 400 percent on an install base of 10 is pretty easy.” But now the install base is many, many tens of thousands and growing 400 percent there. I’m not even including the open source stuff here, the people using Neo4j and open source motions. But growing 400 percent year over year with an install base like that – it’s no longer a niche or a micro trend, it’s a visibly macro trend in data that is going to, I believe, explode in 2023 onwards.
Daniel Ng: And Neo4j is also making it easier for people to consume graph databases, right? We’ve got AuraDB free, which you can actually just log in and try for free.
Jim Webber: Absolutely. So if you don’t want to download Neo4j to your laptop using the Neo4j desktop app, you want to just use a free Cloud service, AuraDB free will get you there. It’s nice of you to mention that Daniel, because you remind me of why I like working at Neo4j. Not that we give away free stuff, although that’s close. There’s a certain level of humane behavior at Neo4j that I’ve always appreciated.
For example, “Hey, look folks out there, there’s a free database, and you can build small systems on it.” Right? It’s capable of running small systems. I think about the Cypher Query language. Sorry to go back into the technical weeds a little bit here, but the Cypher Query language was designed specifically to be easy to use. We all have experience with other query languages.
We’ve all seen SQL – in fact, Neo4j developed Gremlin, the first kind of modern graph query language, but we also built Cypher. And the reason for that was, we looked at those other languages and we found that they were difficult to reason about, they were difficult to read, they were difficult to debug. What we found was that as an engineering team, we liked Microsoft VISIO actually. We used to draw pictures of graphs, circles, arrows, circles, and we used to write little labels in the arrows.
Then one of the engineers said, “Hey, wouldn’t it be nice, because we share a lot of diagrams, if we could draw pictures in our query language and be able to use those to store data in the database and query data?” And of course everyone laughed and said, “Well, visual languages don’t work.” I mean, my PhD was in visual languages.
I’m firmly of the belief that you struggle to get them to work. But actually a few folks diligently dug away at this idea and created this lovely ASCII we see now in modern Cypher, which means that the gap between end users, even non-technical end users, and the data that belongs to them is greatly diminished. I think a really humane warm thing about working with graphs and Neo4j is that we constantly try to lower the barrier to entry so that regular people can get access to their data.
Even if they can’t perhaps reach the heights of building Cypher queries, they have the Bloom visualization tool, which allows them to type natural language queries, which under the covers are being turned into Cypher for them. Correspondingly, the underlying graph is able to surface recommendations for them. It’s really kind of a graph based autocomplete, and it’s a really nice way of interacting with your data as well.
Actually I was with a customer here in the UK earlier this week – there are big telecoms and media companies here – and they were telling me, “The first time I showed my boss the graph and they could see their data, they were blown away.” Breaking down those barriers between humans and data is such a lovely thing to be able to do.
Daniel Ng: Doesn’t it bring forth the saying “A picture’s worth a thousand words”?
Jim Webber: “A picture’s worth a thousand words” or the more technical version of that is “What you draw is what you store.” Which is something that we live and die by in the engineering team at Neo4j.
Daniel Ng: I like that. We also have AuraDB professional, which is very meaningful for us here in APAC because a lot of SMB businesses are here, and it’s a very different type of business compared to the enterprise. Even with enterprise, departments may look at our graph AuraDB professional as an entry point and say, “Let me try, I don’t want to go full flat yet.” So we’re making it easier for people to consume.
Jim, will 2023 be a pivotal year where graph technology explored a richer inflection point?
2023: A pivotal year in graph technology
Jim Webber: Inflection points are hard to pick because as you’re heading towards one, it just looks linear. So in the micro, the inflection point looks like a line, with a gradient. And it’s only after you’ve passed the inflection point and you can zoom out is when you can retrospectively see an inflection. The answer is, I don’t know, Daniel. What I do know, as I mentioned earlier, is that graphs have been growing at 400 percent year over year forever. If we can continue to grow at 400 percent year over year in the future, then yes, by implication you get what the Silicon Valley folks call “the hockey stick curve.” Whether that happens in 2023, I don’t know, but I am confident that graphs are going to grow tremendously again.
If we end up growing at 4X this year, that’s a huge market. That’s a huge number of people that are coming to graphs and getting value from graphs, and hopefully also enjoying their use of graphs. Maybe it reinvigorates their love for data tech. Well, is that an inflection point? Hard to know. Ask me again in 10 years about 2023 and I’ll have a great answer for you, because then it’ll be obvious that 2023 was the inflection point.
But certainly graphs are going to be strong in 2023 and I see no prospect of them diminishing in the near future. Certainly when I look – and I’m biased, I love graphs and I’m deeply wedded to them – but when I look now at the industry analysts, folks like Gartner and so on, I find those folks to be very conservative actually. I think those folks don’t want to trouble their clientele with niche technology that might be gone in six months.
They wait to see if a technology has legs, if it has legitimacy, if it has longevity. And now all of those folks are talking about graphs. They have been for the last couple of years, but now we’re seeing crazy things like 50 percent of ML by 2025 will involve graphs. These amazing statistics somewhat testify to how fast graphs are growing globally. I think in the APAC region, there is every reason to believe, given the technical undercurrent there, that graphs will grow more quickly in that region than they will over here in the old world.
Daniel Ng: Thank you. I think there are a lot of key drivers, like cybersecurity, fraud detection, as we go into gambling online or even e-commerce online. APAC’s a huge market for that. That’s why I’m really bullish – you combine the number of people we have in APAC, you combine the drivers, inflection point or not – we will grow and we will grow very, very well.
Jim, for your last words in summary – you have talked about graph database, you have talked about graph data science, you’ve talked about the delivery mechanism through Cloud. You’ve talked about a lot of the elements that would drive graphs forward. What is your final summary on this webinar?
Jim Webber: I’m genuinely quite excited about this year. The community is astonishing, both in APAC and globally. People are building systems that frankly astonish me. People tell me – and that’s a wonderful thing about my job, people tell me what they’re building – and they’ve been astonishing me for 12 years. I think in 2023 this is going to be no different. People are going to tap me on the shoulder when I come visit GraphSummit and they’re going to tell me something and it’s going to puzzle me for a minute, and then it’s going to click and there’s a light bulb moment.
I think in 2023 people are going to build phenomenal systems with graphs, things that seemed impractical or possibly not even possible in 2022 or earlier. People are going to pick up graphs, they’re going to build amazing things. I think throughout the region we are going to see more of this.
I mentioned Australia or Indonesia earlier. I think things are really starting to kick off in both of those countries. I said there’s the right technical underpinnings, there’s the right hunger for new stuff, and there is a culture of, well, we don’t have to be constrained by what’s gone before, and that’s going to help propel them forward.
I think broadly in 2023 that graphs are coming. In your business, if you haven’t seen graphs yet, they are around somewhere, some of your colleagues are dealing with them, and they’re coming your way, and be prepared. Get ready for them. Come to Neo4j.com, take some of the GraphAcademy courses, grab some of our free eBooks, talk to some of our folks. We have a community in your area, which we’d love to help upskill you. That’s happening, and for people like me, people who are data professionals of old, we have to realize that the compute side is now coming, that graph data science is graph compute.
For those of us who studied computer science at university, dusting off our memories of things like graph algorithms are going to be warranted, whether we loved or hated those sessions. For the business decision makers, the folks that ultimately have problems they’re asking their IT folks to solve, I think you need to be aware that you are no longer constrained by data models that don’t meet your business needs.
Graphs are a flexible data model that will meet your business needs. And I think if your IT folks are saying, “No,” you should be able to say, “Well, look, have we considered using tech for this? Because I understand from listening to that English bloke that they are flexible enough to deal with even complex domain models.” And if your IT folks are saying, “No,” I think you have a legitimate reason to say, “Well, why haven’t we tried this? Because I think this could do something special for us.”
So everyone – the wave’s coming. Daniel, to your point earlier, is it an inflection? I don’t know. I’ll tell you in a few years whether it was an inflection, but it certainly isn’t going away. It’s only growing. So across the spectrum of deep technical nerds and analysts and business users, I think we’re going to see significant graph impact this year.
Daniel Ng: Great, Jim, brilliant as always. I learn so much every time I speak with you and I’m sure our audience has picked up a few things as well. We hope to see you soon in Asia Pacific. And again, Happy New Year to you and your family and to everyone here listening in as well.
Jim Webber: Absolutely. Happy New Year folks, and hopefully catch up with some of you this year as travel and time permits.
Share Article


Explore
Related Articles

A workbench for teams to query, explore, and visualize graph data

1 of 3: The difference between a graph, a knowledge graph, and a context graph

2 of 3: Why graphs, knowledge graphs, and context graphs matter to customers
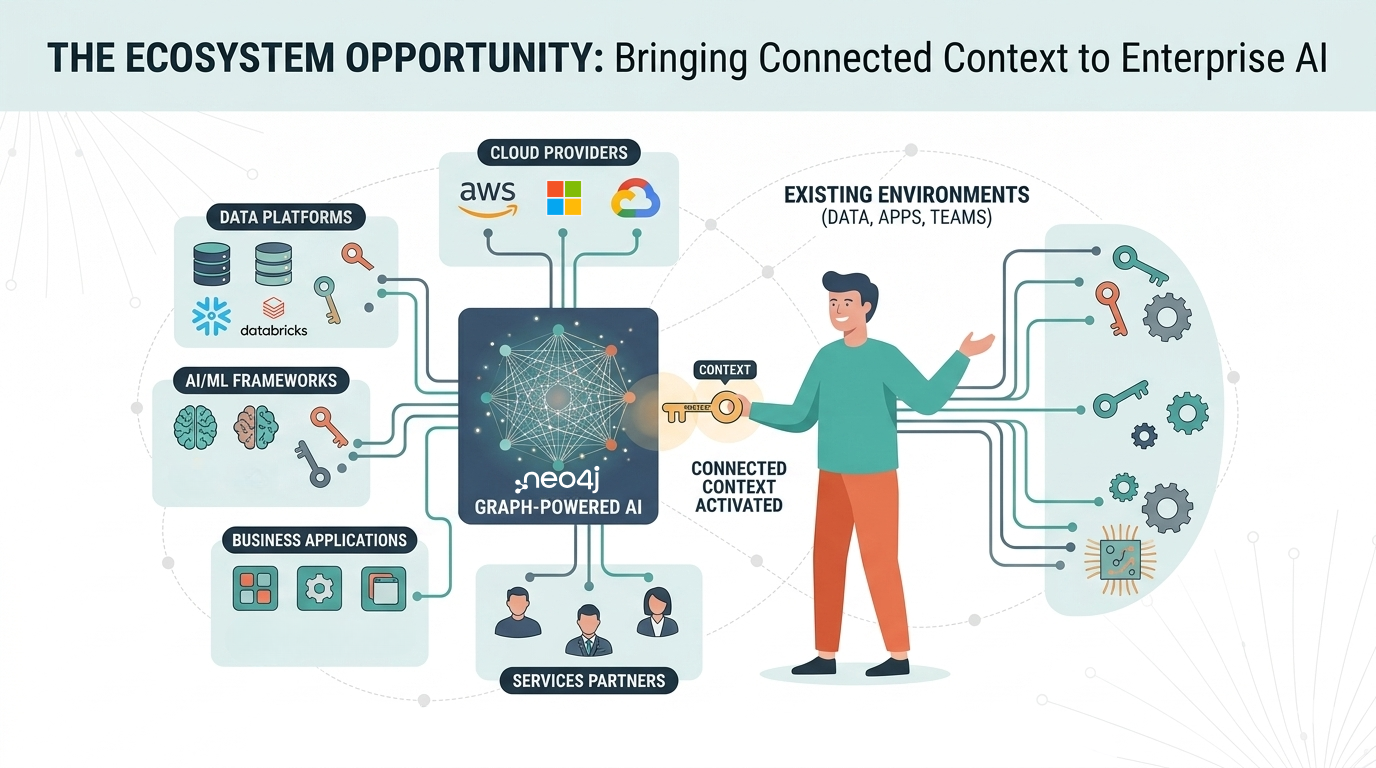
3 of 3: The graph ecosystem: Bringing connected context to enterprise AI
Digital twins that learn: connected asset intelligence with Neo4j and Databricks