
Ravi Anthapu and Matt Holford: 5-Minute Interview

Product Marketing Manager, Neo4j
4 min read

“The second exciting part, which is even more exciting, was to see how using graph technology we were able to very quickly aggregate these individual patient journeys and look at patterns of treatment across very large populations, up into the millions of patients,” said
Matt Holford, Consulting Engineer at Neo4j.
In this week’s 5-minute interview, we are speaking with Ravi Anthapu, Principal Consulting Engineer at Neo4j, and Matt Holford, Consulting Engineer at Neo4j, about the Graphie Award winner for the Patient Journey project, in which the graph database is used to analyze a large population of patients’ treatments and the effectiveness of those treatments.
How are you using Neo4j?
Ravi Anthapu: We take the patient medical records – like doctor visit, hospital visit, medical procedures, prescription, diagnosis – and connect them like a graph, based upon the time they happen. This gives us a patient journey graph that can be analyzed pretty quickly to see patterns of good and bad outcomes, and the part that’s most prevalent during those outcomes. This computational power of graph allows us to quickly read the aggregation of the patient journey without losing any of the individual details.
How were you solving that problem before Neo4j?
Matt Holford: Medical records data has typically been stored in relational databases and so analyzing and aggregating it has usually been a relational database problem. There are a couple of troubles with this historically. One is that it requires a lot of specialized knowledge to know how to query and present this information. Two is that it’s often time-consuming and expensive in resources to do so. It requires a lot of heavy JOINs and typically batch processes.
What we wanted with the Patient Journey was to be able to present this information dynamically to the user. So with just a couple of mouse clicks, a user can see across a population of patients and what the treatment patterns are, given particular criteria.
Why did you choose Neo4j?
Ravi: Neo4j is the established leader in graph technology. So it gives us
Cypher, a simple declarative query language, and also the ability to add custom plugins for doing complicated driver cells and graph algorithms. With these approaches we are able to analyze a million patients, about a hundred million nodes, and a billion relationships almost instantaneously, and provide results.
What have been some of the surprising results you’ve seen?
Matt: So there are two really exciting points in the sort of journey of the patient journey project. The first was when we started to look at patient journeys visually – instead of as just rows of data in an Excel table – to see the events of the patient journey represented sequentially, visually. This allowed us and our customers to see an individual patient’s health start to improve over time and what the individual steps were that were being taken to allow this to happen.
The second exciting part, which is even more exciting, was to see how using graph technology we were able to very quickly aggregate these individual patient journeys and look at patterns of treatment across very large populations, up into the millions of patients.
What is your favorite part about working with Neo4j?
Ravi: We really love the vibrant and supportive user community, the ability to start a quick PoC (Proof of Concept) using Cypher, and moving to advanced analytics using custom plugins. The whole process was smooth and supported by knowledgeable people from Neo4j. There’s also a ton of information available on blogs and Neo4j’s YouTube channel, which helped us a lot.
What is next for your project?
Matt: Currently there are a number of customer projects that are implementing the patient journey model to look at various treatment problems. I think a big part of this project moving forward, is going to be the addition of enhancements in support of those projects. I should also mention that patient journey is being taken up as part of the Neo4j support framework.
I think one particularly interesting area of exploration would be to use graph algorithms and machine-learning technology to start to identify patients that are similar to one another, based on having similar journeys. Once we do this, we can start to look at communities of patients and communities of similar patients, and we can use this community information to start to drive predictive analytics. We can look at treatment patterns that are effective for some within a community and we can predict that they’ll be effective for other members of the community.
What do you think the future holds for graph technology?
Ravi: The journey concept is a powerful paradigm and can be applied to a number of business articles besides healthcare. For example, by capturing shopper behavior – clickstreams, patches, page views – the retailers can analyze customer interests for the effectiveness of marketing strategies. We see modern problems that don’t fit well into the boxes, but they will in some indexes. They are better understood as chains of connection of events. Graph databases offer the ideal technology to address these sorts of problems.
Want to share about your Neo4j project in a future 5-Minute Interview? Drop us a line at content@neo4j.com
Share Article


Explore
Related Articles

What Is Data Lineage? Tracking Data Through Enterprise Systems
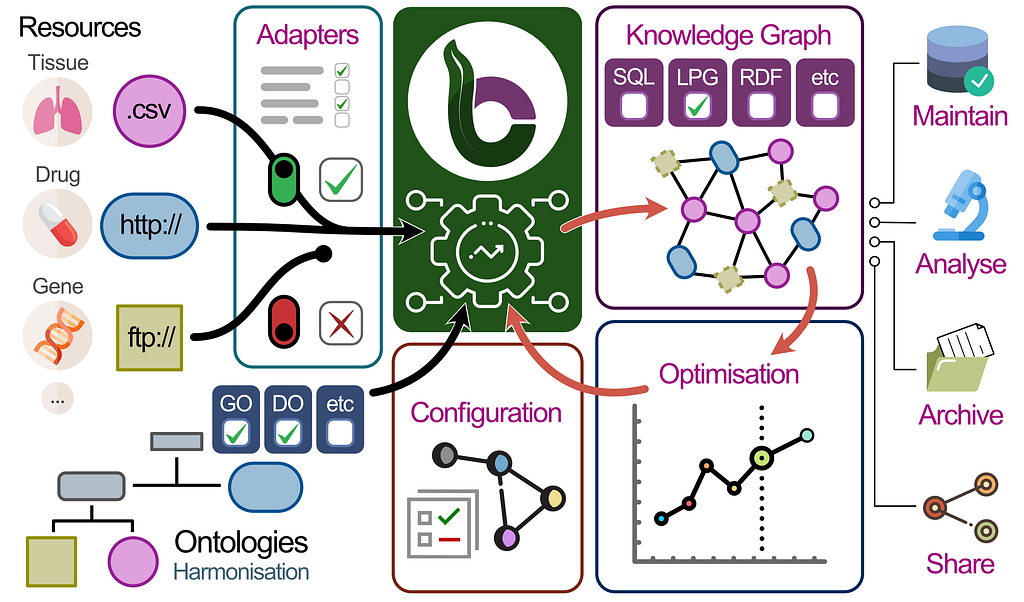
BioCypher: Unifying Framework for Biomedical Knowledge Graphs
Graph Data Science for Drug Discovery: The 5-Minute Interview With Ufuk Kirik


Graphs for Information Services: The 5-Minute Interview With Cyndi Streun
