
Rethink Your Master Data: How Graphs and MDM Intersect

Senior Director of Global Solutions, Neo4j
1 min read
Data is both our most valuable asset and our biggest ongoing challenge. As data grows in volume, variety and complexity, across applications, clouds and siloed systems, traditional ways of working with data no longer work.
Increasingly, businesses are recognizing a need to harness all of their data, particularly their data around customers, products, partners and more – often called master data. Pressing business priorities such as compliance and digital transformation require a holistic view of this master data.
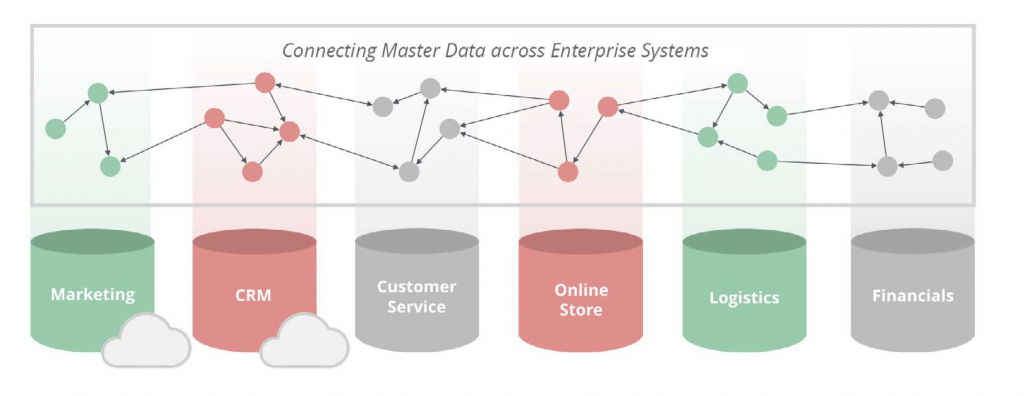
Achieving that holistic view requires connecting data across a myriad of sources and silos. Connecting data using flexible graph technology offers a proven approach to solving these data challenges, capturing not only data but an unlimited number of connections and relationships between data.
This blog series describes the power of connecting your most important data about customers, products, employees, business partners and more using graph technology. Along the way, real-world use cases from global enterprises to disruptive startups illustrate the power of connected data.
This week, in blog three of our five-part blog series on rethinking your master data, we show how graphs and MDM intersect, with examples that show the power of using graph technology to connect master data across existing systems and silos.
How Graphs and MDM Intersect
Relational databases are not going away, so there’s no need to rip and replace. A more practical approach is to add a solution that complements your existing system and allows you to continue to reap the benefits of past investments. Neo4j provides the missing connections and insights.
Just ask the global booking platform Airbnb.
Internal MDM for Increased Productivity: Airbnb
Airbnb had more than 3,500 employees across the globe and faced the huge challenge of managing the volume and complexity of its data. The company managed more than 200,000 tables in its data warehouse, all spread across multiple clusters.
“It wasn’t evident how you even found the right table,” recalled Airbnb software engineer John Bodley. In surveys, employees gave the company poor reviews when asked whether they had the right information to do their jobs.
Using Neo4j, the company created an internal MDM tool called the Dataportal to connect all these silos, enabling employees to find the data they need with ease. Neo4j served as the perfect fit for the company’s operations. As Bodley explained, “Our company is a graph.”
Ask yourself: Is your company – and your company’s data – a graph?
Connecting Silos to Fight Diabetes: DZD
The German Centre for Diabetes Research (DZD) sought a way to bring together all the information spread across the organization and its various research activities. The DZD wanted a centralized data and knowledge management system for technical reasons and human ones too – especially to promote cross-disciplinary collaboration.
DZD’s research network accumulates a huge amount of data distributed across various locations and consolidates it into a single, master database. This central database provides DZD’s 400-strong team of scientists with a holistic view of available information, enabling them to gain valuable insights into the causes and progression of diabetes.
With Neo4j, DZD runs queries across many locations – and already has discovered intriguing connections and patterns for future research.
“Creating the first data models with Neo4j was very fast,” said Dr. Alexander Jarasch, head of bioinformatics and data management at DZD
“In the first week, I was able to connect metadata from our scientists into a data model, test the model and show the added value of the graph database,” said Jarasch. “Thanks to the high scalability and performance of Neo4j, the data integration possibilities are limitless.
We’re employing AI and graph analytics to find connections with other diseases, including cancers.”
Ask yourself: What could you do in a week by connecting your data silos?
Product 360: Lockheed-Martin
You don’t have to be a rocket scientist to see the strategic value of graph databases. But it doesn’t hurt to be one either.
Lockheed Martin Space (LMS) builds satellites, space vehicles and other astronautical equipment. As the premier government contractor for NASA, it has built more interplanetary spacecraft than all U.S. companies combined. The company had many silos – all filled with
data.
Ann Grubbs, LMS chief data engineer, described the environment as “hundreds, maybe thousands of data systems and tens of thousands of datasets.”
Lockheed Martin Space connects all of its data silos by storing the relationships between the data and those systems in a graph database. This lightweight manner of connecting data silos by storing the pointers between them made it possible to quickly answer questions that
formerly required weeks of querying different systems.
Graph technology now reveals connections never visible before. In one case, LMS analyzed which spacecraft parts were most important.
“To our surprise,” chuckled Grubbs, “it turned out to be a tube of adhesive that had the most influence.”
Ask yourself: What questions could you answer if your data sources were connected?
Transformative MDM: Pitney Bowes
For some organizations, graph-based MDM has been transformational.
Although best known for postage meters and mailing services, Pitney Bowes actually is one of the top software companies in the world. Having built a slew of back-end processes to run its global business (routing mail around the world requires a lot of coordination), it is effectively a tech company
“The main go-to-market focus we have is around the single view of customers, which is the Master Data Management (MDM) use case at its heart,” said Aaron Wallace, principal product manager, Pitney Bowes.
Pitney Bowes had more than 150 different systems spread across the globe. The number grew constantly as the company made up to a dozen or more acquisitions every year. The company needed a centralized hub that all of these systems could plug into. At first, the company took a typical silo approach with an MDM stack that was highly centralized, controlled and governed.
They then realized that a single-system solution to MDM wasn’t conducive to making their systems efficient. Seeking an enterprise-wide solution, Pitney Bowes became an early adopter of graph databases and a Neo4j partner.
Built on Neo4j, the solution provides a visualization of data moving through the organization. For example, the Pitney Bowes data-matching engine generates a record from multiple data repositories and matching algorithms resolve discrepancies. One individual may appear as “Charles Kane” in one data record, “Chuck Kane” in another and “Citizen Kane” elsewhere. Similarly, an individual’s address may reside in one database, the email in a second database and mobile phone and social media information in a third. The system merges all those records into a single graph.
The efforts proved so successful that Pitney Bowes began offering an MDM solution to its own customers called the Spectrum Data Hub Module – powered, naturally, by the Neo4j graph database.
Ask yourself: Could you productize your company’s secret sauce?
Conclusion
As we have shown, there is power in using Neo4j to discover connections and insights across your systems and silos. Instead of rip and replace, think about blending graph technology with existing databases to get more value from your data.
Next week, in blog four of this series, we look at how rethinking MDM with graph technology streamlines compliance with regulations such as GDPR, the European data privacy act.
Fuel your success by connecting all of your data across silos. Click below to get your copy of Rethink Your Master Data Management.
Share Article


Explore
Related Articles

Top 10 Graph Database Use Cases (With Real-World Case Studies)

Connecting Data Across the Enterprise: The 5-Minute Interview With Simone Novali

Neo4j as an Embedded Database: The Key Use Cases of Graph Databases
Neo4j as an Embedded Database: When Does Embedding a Graph DB Make Sense?
