The Neo4j BI Connector: Performance

Senior Director of Developer Relations, Neo4j
5 min read

Graph data platform adoption is on the rise. But does this mean that people have to give up their favorite BI tools? The answer is a resounding no.
The Neo4j BI Connector delivers direct access to Neo4j graph data from business intelligence (BI) tools such as Tableau, Looker, TIBCO Spotfire Server and Microstrategy. It’s the first enterprise-ready, supported product to deliver connected data results to BI users avoiding
coding, custom scripting and ungoverned access.
In this fifth and final blog of our five-part series on the BI Connector, we describe the basics of performance tuning and troubleshooting.
Performance considerations
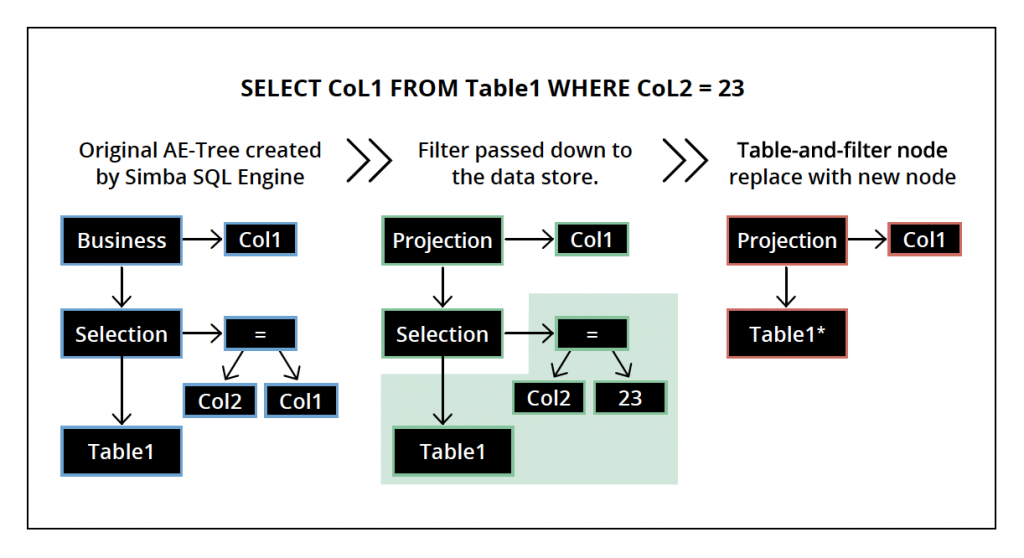
The BI Connector works by taking SQL queries from a client, transforming them into Cypher and fetching the results. In some cases, a tool might express a SQL construct that does not have an equivalent in Cypher, the BI Connector has an in-memory SQL Execution Engine that can be used to satisfy any standard SQL query.
So while you’ll find that you can throw just about any SQL query at the BI Driver and it will
work, in some cases the query may be answered by pulling back more information from Neo4j
than is strictly necessary to process the results on the client side.
As the BI Driver evolves over time, one of the key priorities is to increase the number of push-down operations to get the best possible performance and fetch the minimum data. Subsequent releases will have more efficient push-down operations, thus improving performance.
If you ever want or need to see what the BI Connector is doing in great detail, enable query
logging on your Neo4j server and use a Neo4j monitoring tool to even track those queries while they are in flight.
Inside of the SQL Execution Engine, there are a number of memory management techniques
that can affect performance for large datasets.
The SQL engine attempts to keep as much data in-memory as possible for performance, but of course there is a tradeoff between execution speed and not consuming too much client side memory. As a result, the SQL engine may spill to disk if the data set gets too big, which can slow down query response times as a tradeoff for not consuming too many resources.
If you would like to read more about the technical details of how query execution takes place, we recommend you consult the Overview of Collaborative Query Execution.
During query execution, the driver will cache intermediate data in memory up to 1 GB and starts spilling to disk if it goes beyond that limit. The driver looks at the java.io.tmpdir system property to determine where in the file system to create the swap files. Users can control the swap file location via the -Djava.io.tmpdir JVM property. Currently, the driver does not have a configuration for the users to control the memory limit.

Troubleshooting
When issues arise, it’s a good thing to start with a visualization of what’s happening in our technology stack, so we quickly isolate what the issue is and move to resolution.
The following image shows a flow of data from a Neo4j database at the bottom to BI Tooling (such as Tableau) at the top.
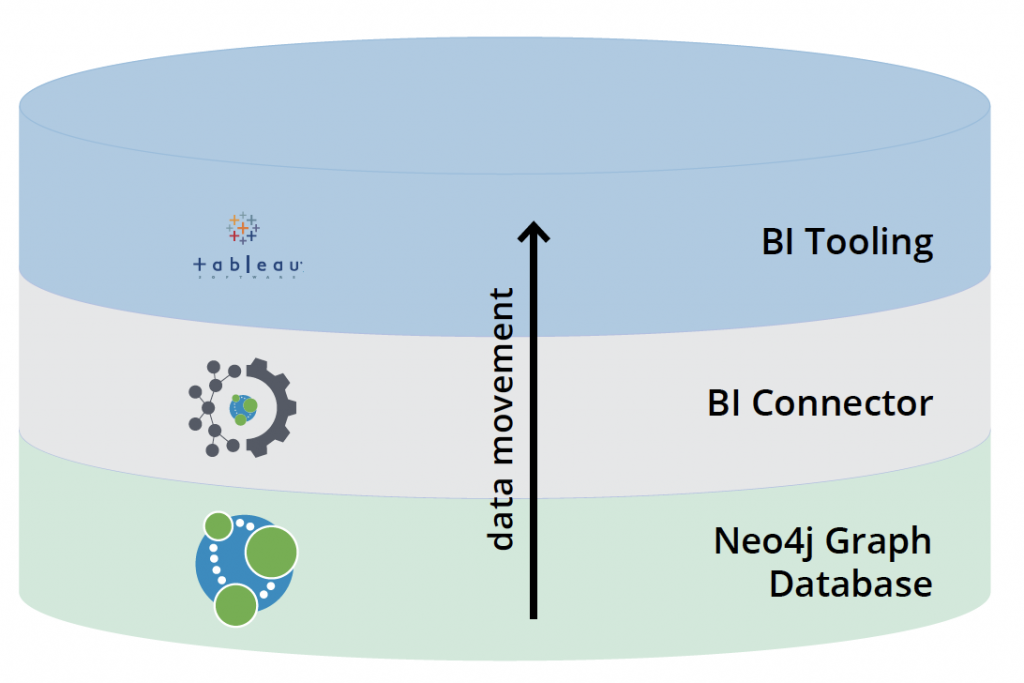
Let’s address each layer individually, starting at the bottom, to provide some troubleshooting tips and tricks for when things aren’t working correctly.
Neo4j database
- At the database layer, you may wish to enable query logging to see the direct Cypher
queries the BI Connector is sending to the database. - The use of a Neo4j monitoring tool such as Halin provides valuable advice on how
much free memory your graph cluster has, and what overall throughput is like. This is
important context; if the cluster is overloaded, the BI Connector as another client cannot
perform correctly.
Neo4j BI connector
The use of connector logging is highly recommended to help troubleshoot; in the event that
you need to submit a ticket to Neo4j, it’s likely you would be asked to provide these logs. Connector logging is enabled by adding something to the JDBC connection string, like so:
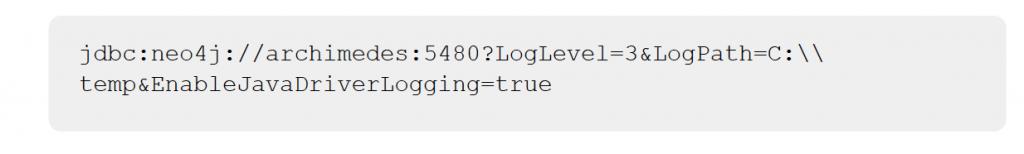
This instructs the driver to keep logs of its interactions with SQL clients and store those text
logs in the temp directory. The EnableJavaDriverLogging flag tells the BI Connector to log its
interactions with Neo4j (as a Bolt client) as well.
When inspecting these logs, there are several things to look for:
- Actual SQL sent to the driver, and whether or not the driver could respond /
encountered an error - Evidence of any driver communication errors to the Neo4j database
- Evidence of the use of connections; some bad-behaved SQL clients may create an
excessive number of parallel open connections, which can slow things down
BI tooling
Ultimately, there are as many ways of troubleshooting these tools as there are tools. For the
most popular Tableau installations, we recommend looking at these instructions to change the
log level associated with the product, which gives some insight into what Tableau is doing.
Refer to the appendix for more information on coding for the BI Connector.
Conclusion
It’s powerful to be able to query and analyze your data in Neo4j in your favorite BI tool. The Neo4j BI Connector is just one of the ways that Neo4j plays well with others in your architecture. Learn about how Neo4j connects with Spark, Kafka and more.
This concludes our five-part series on the BI Connector.
Share Article


Explore
Related Articles

SumoDB in Neo4j: Chaining Multiple Graph Algorithms in Snowflake — Part 3


Why machines need embeddings: Turning graph structure into features

Finding hidden bottlenecks in flight networks with Aura graph analytics on Databricks