Query log analyzer
AuraDB Professional AuraDB Virtual Dedicated Cloud
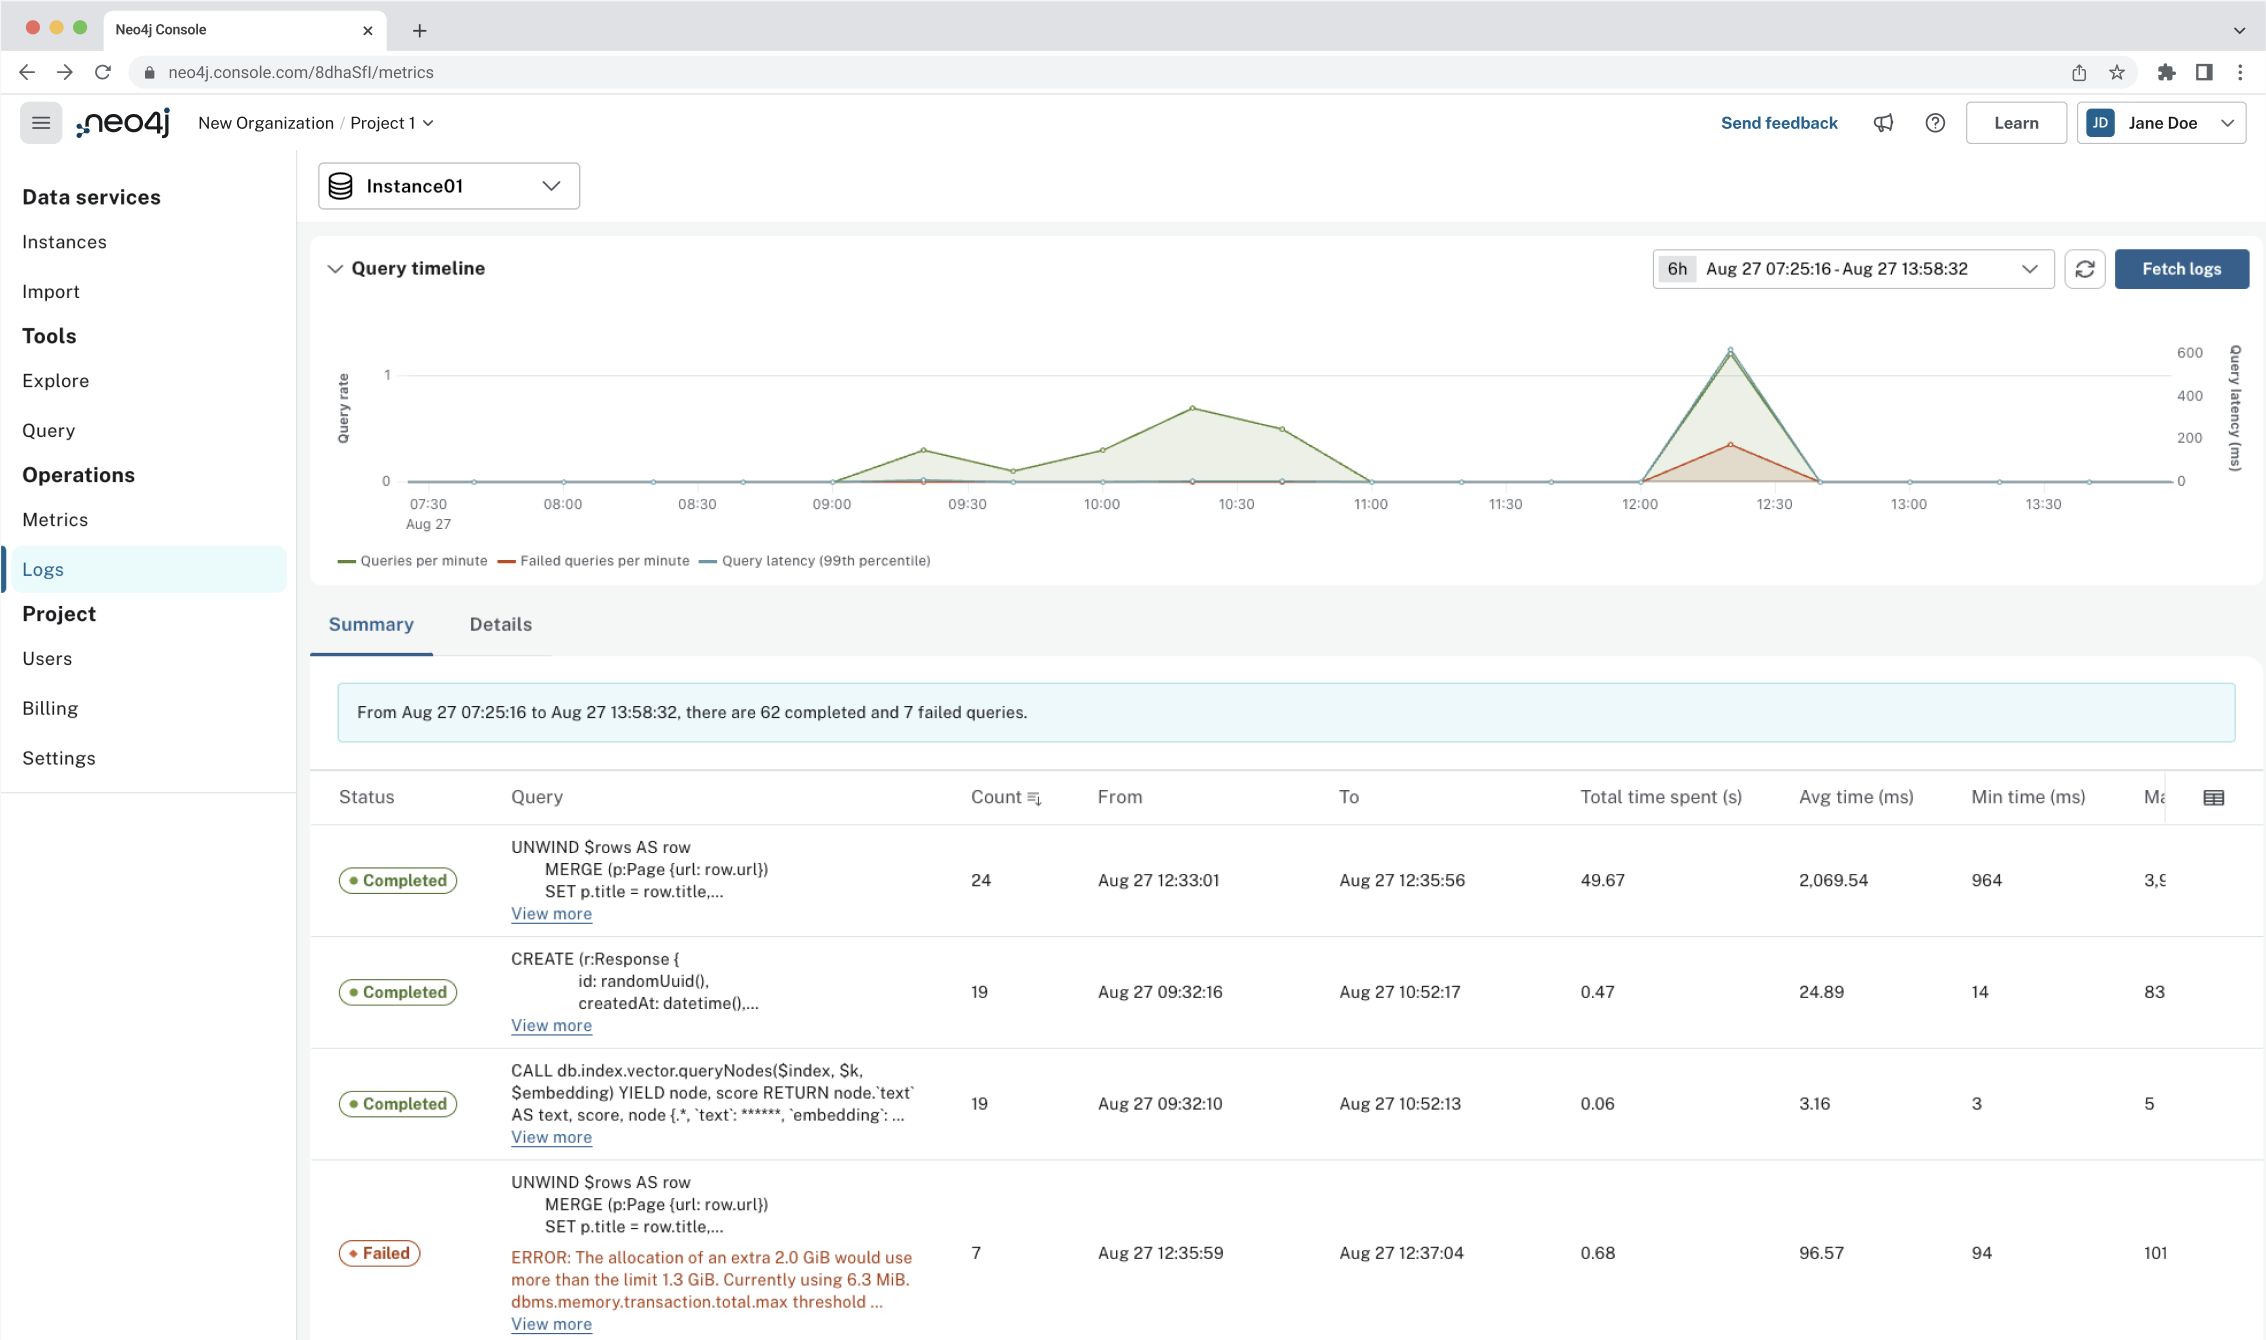
Query log analyzer is a feature that provides a UI to review the queries executed on an Aura instance.
You can access query logs from Logs in the left-hand navigation or from query-related metrics in the Database tab in Metrics. Use the more menu (…) on the metric to navigate to Explore query logs.
To switch between instances, use the dropdown menu on the top left.
Query log analyzer is split up in three parts:
-
Query timeline - Timeline showing metrics for number of queries, failed queries and query latency.
-
Summary table - An aggregated view of query logs, giving a high level overview over the selected time period.
-
Details table - A detailed view showing individual query executions in the selected time period.

To fetch logs, first select a time range in the Query timeline. With a time selection done, press the Fetch logs button. You may optionally select any filters or search text if required, then press Fetch.
A summary of query executions is returned, showing aggregations per query. To see the individual query executions, click the right arrow at the end of the line to show details for that query. The details pane shows individual executions.
Query timeline
When viewing the query timeline, you can select from the following time intervals:
-
30 minutes
-
Last hour
-
Last 2 hours
-
Last 6 hours
-
Last 24 hours
-
Last 3 days
-
Last week
The query timeline can be collapsed by clicking on the header.
|
The query timeline may show activity from internal meta queries, which are filtered in the table. |
Zoom
To zoom in to a narrower time interval, select and drag inside the timeline to select your desired time interval. The data in the timeline automatically updates to match the increased resolution. To update the table, click the Fetch logs button.
To reset zoom, double-click anywhere inside the timeline.
Fetch logs
The Fetch logs button opens up a dialog where you can add filters and search before fetching the logs. The Query timeline determines the current time selection, which can be changed by closing the dialog and modifing the timeline. To fetch the logs after selection of filters and search is done, click the Go button.
|
Query logs are available for a period of 30 days, and each request can be for up to 24 hours of data. |
Log tables
The log tables provide two different views of your query data:
-
The Summary table aggregates similar queries, showing statistics like average execution time and total count. This view helps identify patterns and potential performance issues across multiple executions of the same query.
-
The Details table shows individual query executions with their specific timestamps, users, and performance metrics. This granular view is useful for investigating specific incidents or understanding the context of individual query executions.
Summary
| Display Name | Field Name | Description |
|---|---|---|
Status |
|
The status of the query execution. |
Query |
|
The full query text. |
Count |
|
The number of times this query was executed. |
From |
|
The start timestamp of the first query execution. |
To |
|
The end timestamp of the last query execution. |
Total time spent (s) |
|
The total time spent executing all instances of this query, in seconds. |
Avg time (ms) |
|
The average execution time of the query, in milliseconds. |
Min time (ms) |
|
The minimum execution time of the query, in milliseconds. |
Max time (ms) |
|
The maximum execution time of the query, in milliseconds. |
Avg waiting (ms) |
|
The average time spent waiting before query execution, in milliseconds. |
Avg bytes |
|
The average number of bytes allocated per query execution. |
Avg page hits |
|
The average number of page hits per query execution. |
Avg page faults |
|
The average number of page faults per query execution. |
Actions |
|
Contains an icon button (Arrow Right Circle) to view detailed executions of this specific query in the Details table. Use this button to filter the Details table to show only executions of the selected query. |
Details
| Display Name | Field Name | Description |
|---|---|---|
Status |
|
The status of the query execution. |
Query |
|
The full query text. |
End time |
|
The timestamp when the query execution completed, including milliseconds. |
Duration (ms) |
|
The duration of the query execution in milliseconds. |
Planning (ms) |
|
The time spent planning the query execution in milliseconds. |
Waiting (ms) |
|
The time spent waiting before query execution in milliseconds. |
User |
|
The user who executed the query. |
Database |
|
The database where the query was executed. |
Driver |
|
The database driver used to execute the query. |
Application |
|
The application that initiated the query. |
Initiation type |
|
The type of query initiation. |
Alloc bytes |
|
The number of bytes allocated during query execution. |
Page hits |
|
The number of page hits during query execution. |
Page faults |
|
The number of page faults during query execution. |
Table interactions
Sort table
By default, the table is sorted on Count for Summary and Status for Details. To sort by a column (such as Max Time ms) click on the column heading.