Visual tour of the console
Structure
The hierarchy of the console consists of organizations, projects, and instances:
-
Organization: The highest level, representing the overall team or company.
-
Projects: Folders that organize your instances.
-
Instances: Contain the databases.
Switch organizations and projects
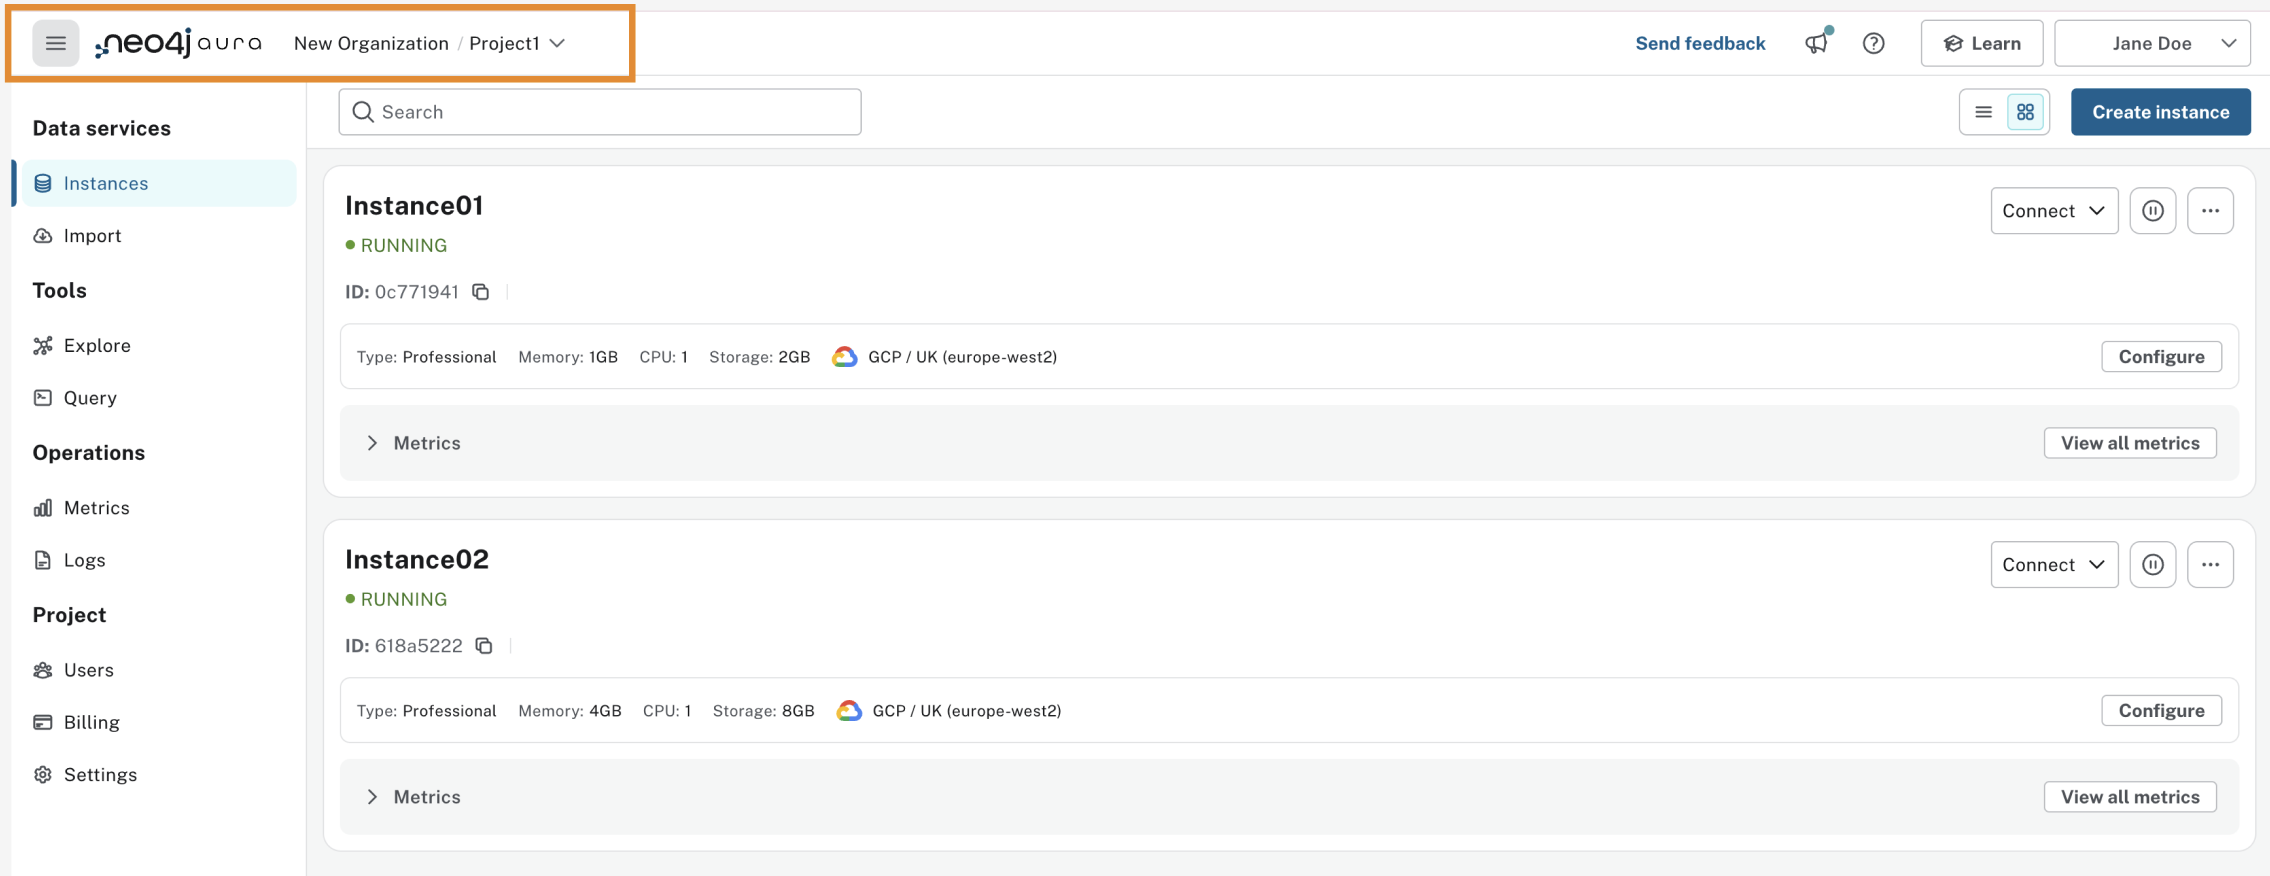
The organization or project you’re currently viewing is always displayed in the header of the console.
To switch between different organizations or projects, click on its name. This opens a dropdown menu where you can see all the organizations and projects you have access to and select the one you want to switch to.

Organizations
Organizations are a layer in the Aura account hierarchy that sit above projects.
This allows you to organize and manage multiple projects under a single organization.
Management at this level allows Organization owners and Organization admins to roll out settings to all projects and instances within an organization.
To access organization-level management, click the organization name at the top of the page.

From there, use the left-hand panel to access:
-
Projects: View projects within the organization.
-
Users: View users and their organization-level roles
-
Security: Configure organization-level features such as SSO, IP filtering, and tool authentication with Aura user.
-
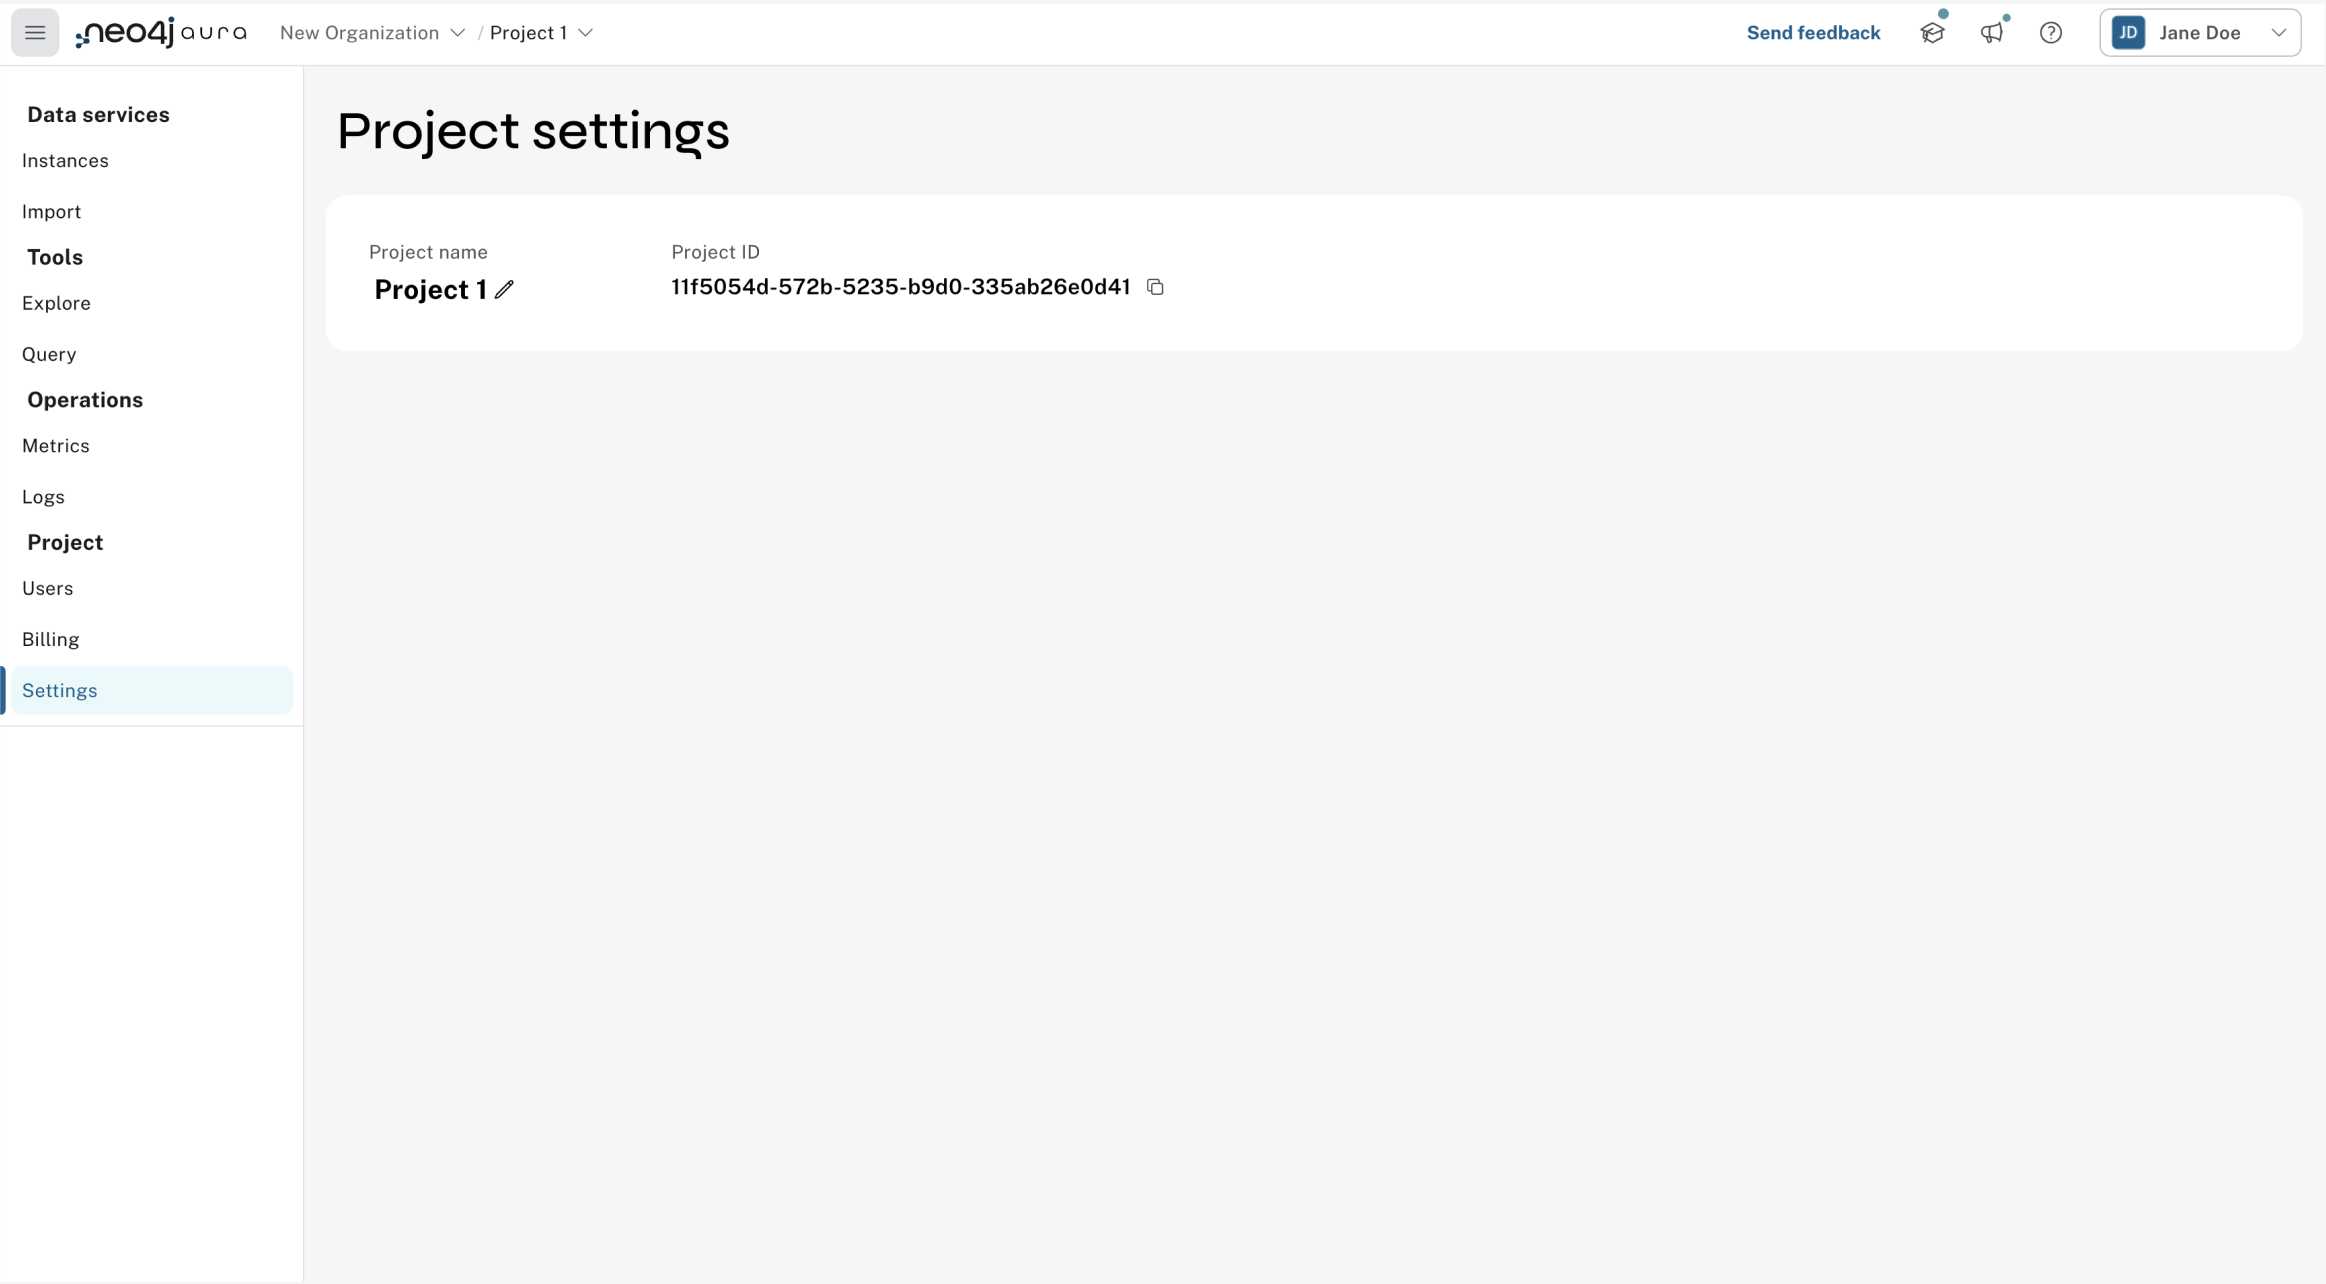
Settings: Where you can manage an organization’s general settings.
Organization settings
You can edit the name of the organization, find your organization ID, enable Generative AI and Aura Graph Analytics.

Generative AI assistance
When enabled, Generative AI assistance is available in a number of places, including the Query copilot and Explore copilot. These features are always identified with a ✨ and your use is subject to the GenAI outputs disclaimer.
Aura Graph Analytics settings
From this page you can enable or disable Aura Graph Analytics, as well as configure the following settings:
-
The maximum available memory for each session
-
The maximum number of concurrent sessions within the organization
Data Services
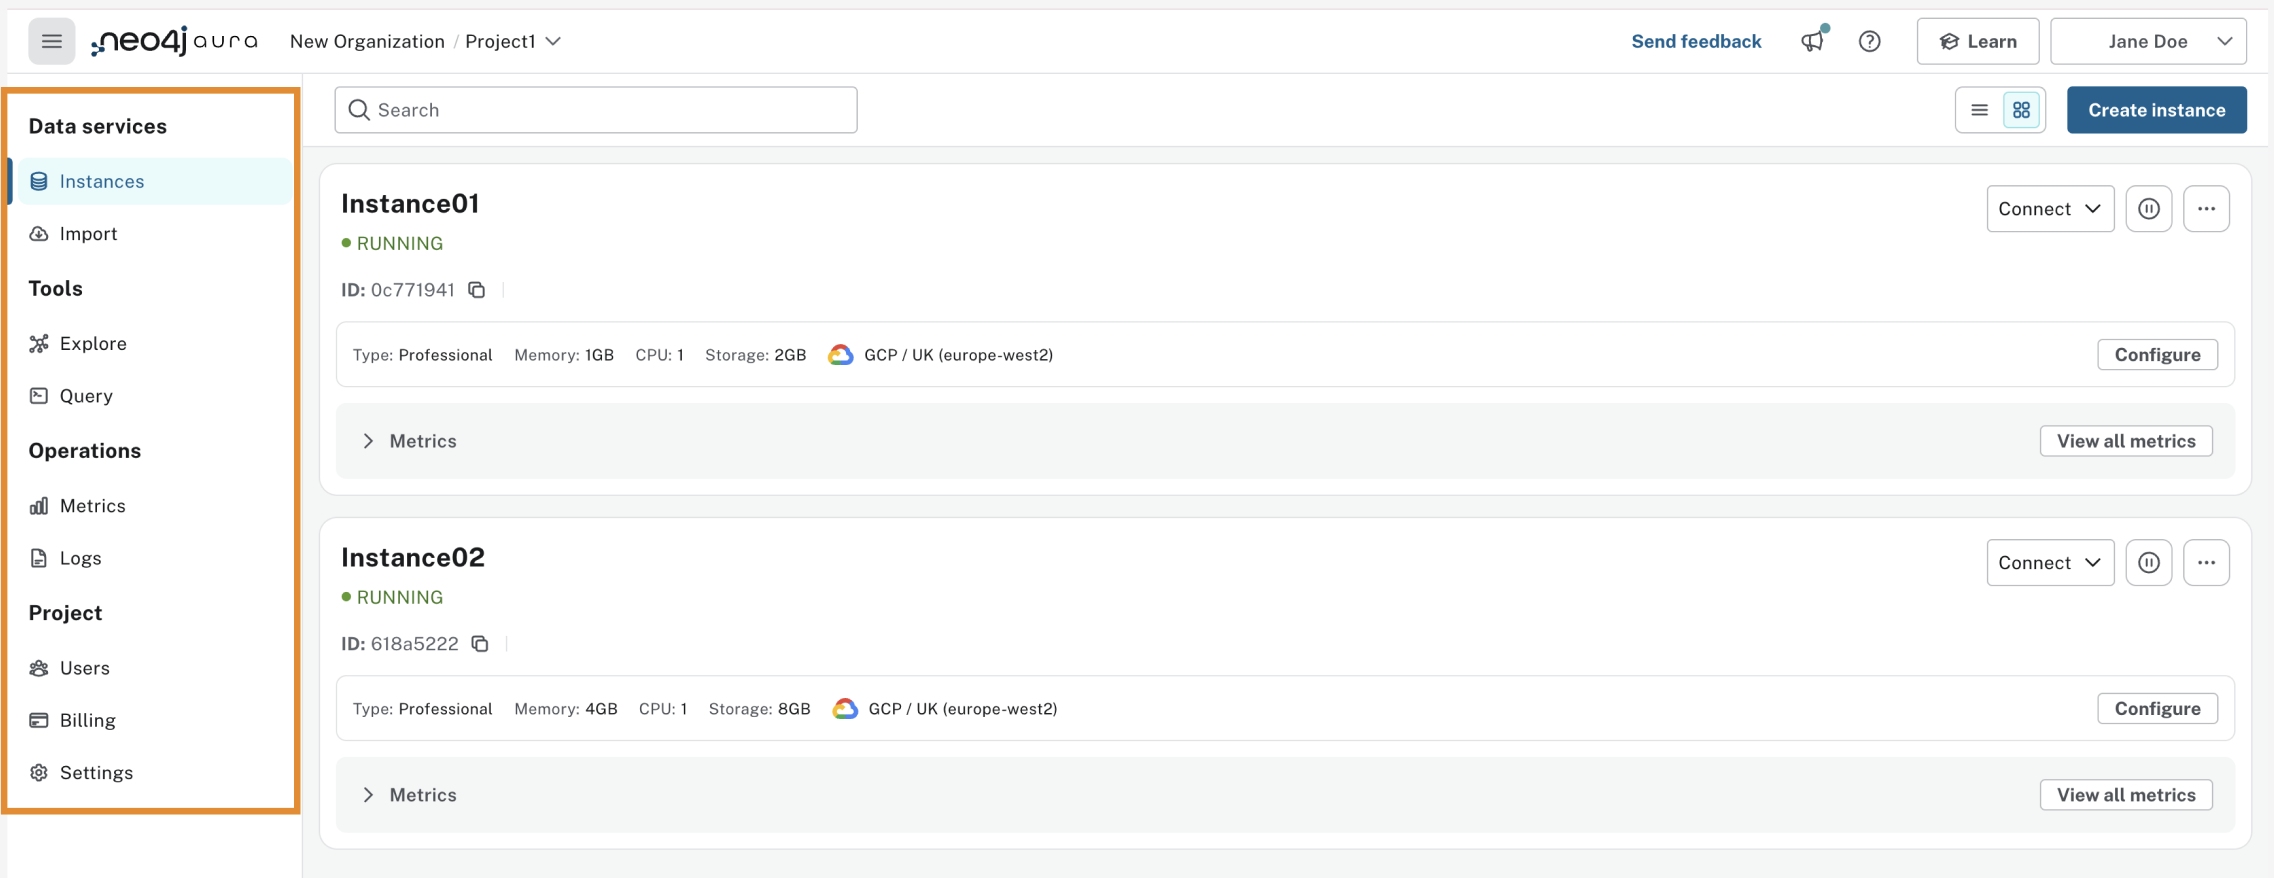
This section contains the data services you have access to. To access your data, navigate to a project and connect to an instance.
Instances
An instance in Aura is an environment of the Neo4j database, managed and run in the cloud. A project can contain one or more instances. In the instance section, you can view and select which instance you want to connect to.
By expanding an instance card, you can explore various options, such as viewing metrics, taking snapshots, or pausing the instance. Additionally, you can also connect the instance to an application.
Import
If your instance doesn’t contain any data, the Import service allows you to import CSV files to your database. This service lets you create your data model and map it to your files. See the What is Import? for more information about this service.
Graph Analytics
This page lists the Aura Graph Analytics sessions running within a project (if any).
The list shows session details and a Delete button for each session. Session details include:
-
The Neo4j database instance containing the data projected in the session
-
The memory allocated to the session (configurable in the Organization settings page)
-
The user who created the session
-
The time remaining to the session configured time limit
Data APIs
Create a GraphQL API to use the power of GraphQL with AuraDB. For information on GraphQL Data APIs, see the GraphQL docs
Tools
The tools allow you to interact with your data and therefore require an active connection to an instance. Once connected to an instance, you can use both the Explore and the Query tools.

Explore
Explore helps you visualize and interact with datasets without using any code.
-
Visual Exploration: See your data as a graph, with nodes and relationships between them, making it easier to understand and analyze complex data connections.
-
Data Insights: By interacting with the graph, uncover patterns, trends, and insights that aren’t easily visible in traditional tabular formats. Explore is designed to make working with graph data more intuitive and insightful by providing a visual and interactive way to analyze and manage your data.
See What is Explore? for more information.
Dashboards
Neo4j dashboards let you compose different visualizations such as tables and graphs in tabbed pages to have relevant data at a glance.
Query
Query is a helpful tool to interact with your data using Cypher, the graph query language.
-
Cypher Editor: Where you write Cypher queries and get instant feedback on syntax errors and other helpful advice.
-
Result frames: Where query results are displayed as a graph, table, or RAW.
-
Query History: A feature that shows previously run queries.
See What is Query? for more information.
Operations
Metrics
Metrics help you monitor and analyze your database’s performance and usage. Some metrics are available directly on the instance card, and you can find the full range in Metrics. See Metrics for more information.
Logs
Track and review system activities and events. Logs provide insights into database operations, errors, and other critical events, helping you monitor performance and troubleshoot issues.
Review queries with the Query Log Analyzer and view security events using the Security Log Analyzer.
Projects
An organization can contain one or more projects. A project is a grouping for one or more instances. Access, permissions, and billing are managed at the project level.
There’s a summary of each project, including the number of instances and members associated with it. Opening a project takes you inside that project, where you can view existing instances and create new ones as needed.

Users
Users are associated with a project and can have various roles and permissions. New users can be invited from the users' page. From there, you can manage accounts, permissions, and control access levels to ensure secure and appropriate instance use. Individuals can have access to a project for administrative work, or to the instances for data work — you can also assign more specific permissions. See User management for more information.
Billing
View and export real-time credit consumption reports by instance or session, add payment info, and track usage with filtering options. See Billing for more information.
