Monitoring Queries
About this module
You have learned how to measure the performance of queries by profiling them in your development enviromnent. In your real application you will need to have a more rigorous and documented approach to testing the performance of queries in a test environment.
Even in a production environment, it may be necessary to monitor queries. You monitor queries to discover any problems in the queries that run during a specific time-period. For example, if there may be a spike in access to the data, you may want to monitor how it is affecting queries over a period of time.
At the end of this module, you will be able to:
-
Monitor queries that are currently running.
-
Configure query logging.
-
Monitor historical metrics for queries.
Review: Query components
You have profiled queries that have these primary components:
-
Create the execution plan (compile the query).
-
Execute the query.
-
Return results to the client.
Monitoring current queries
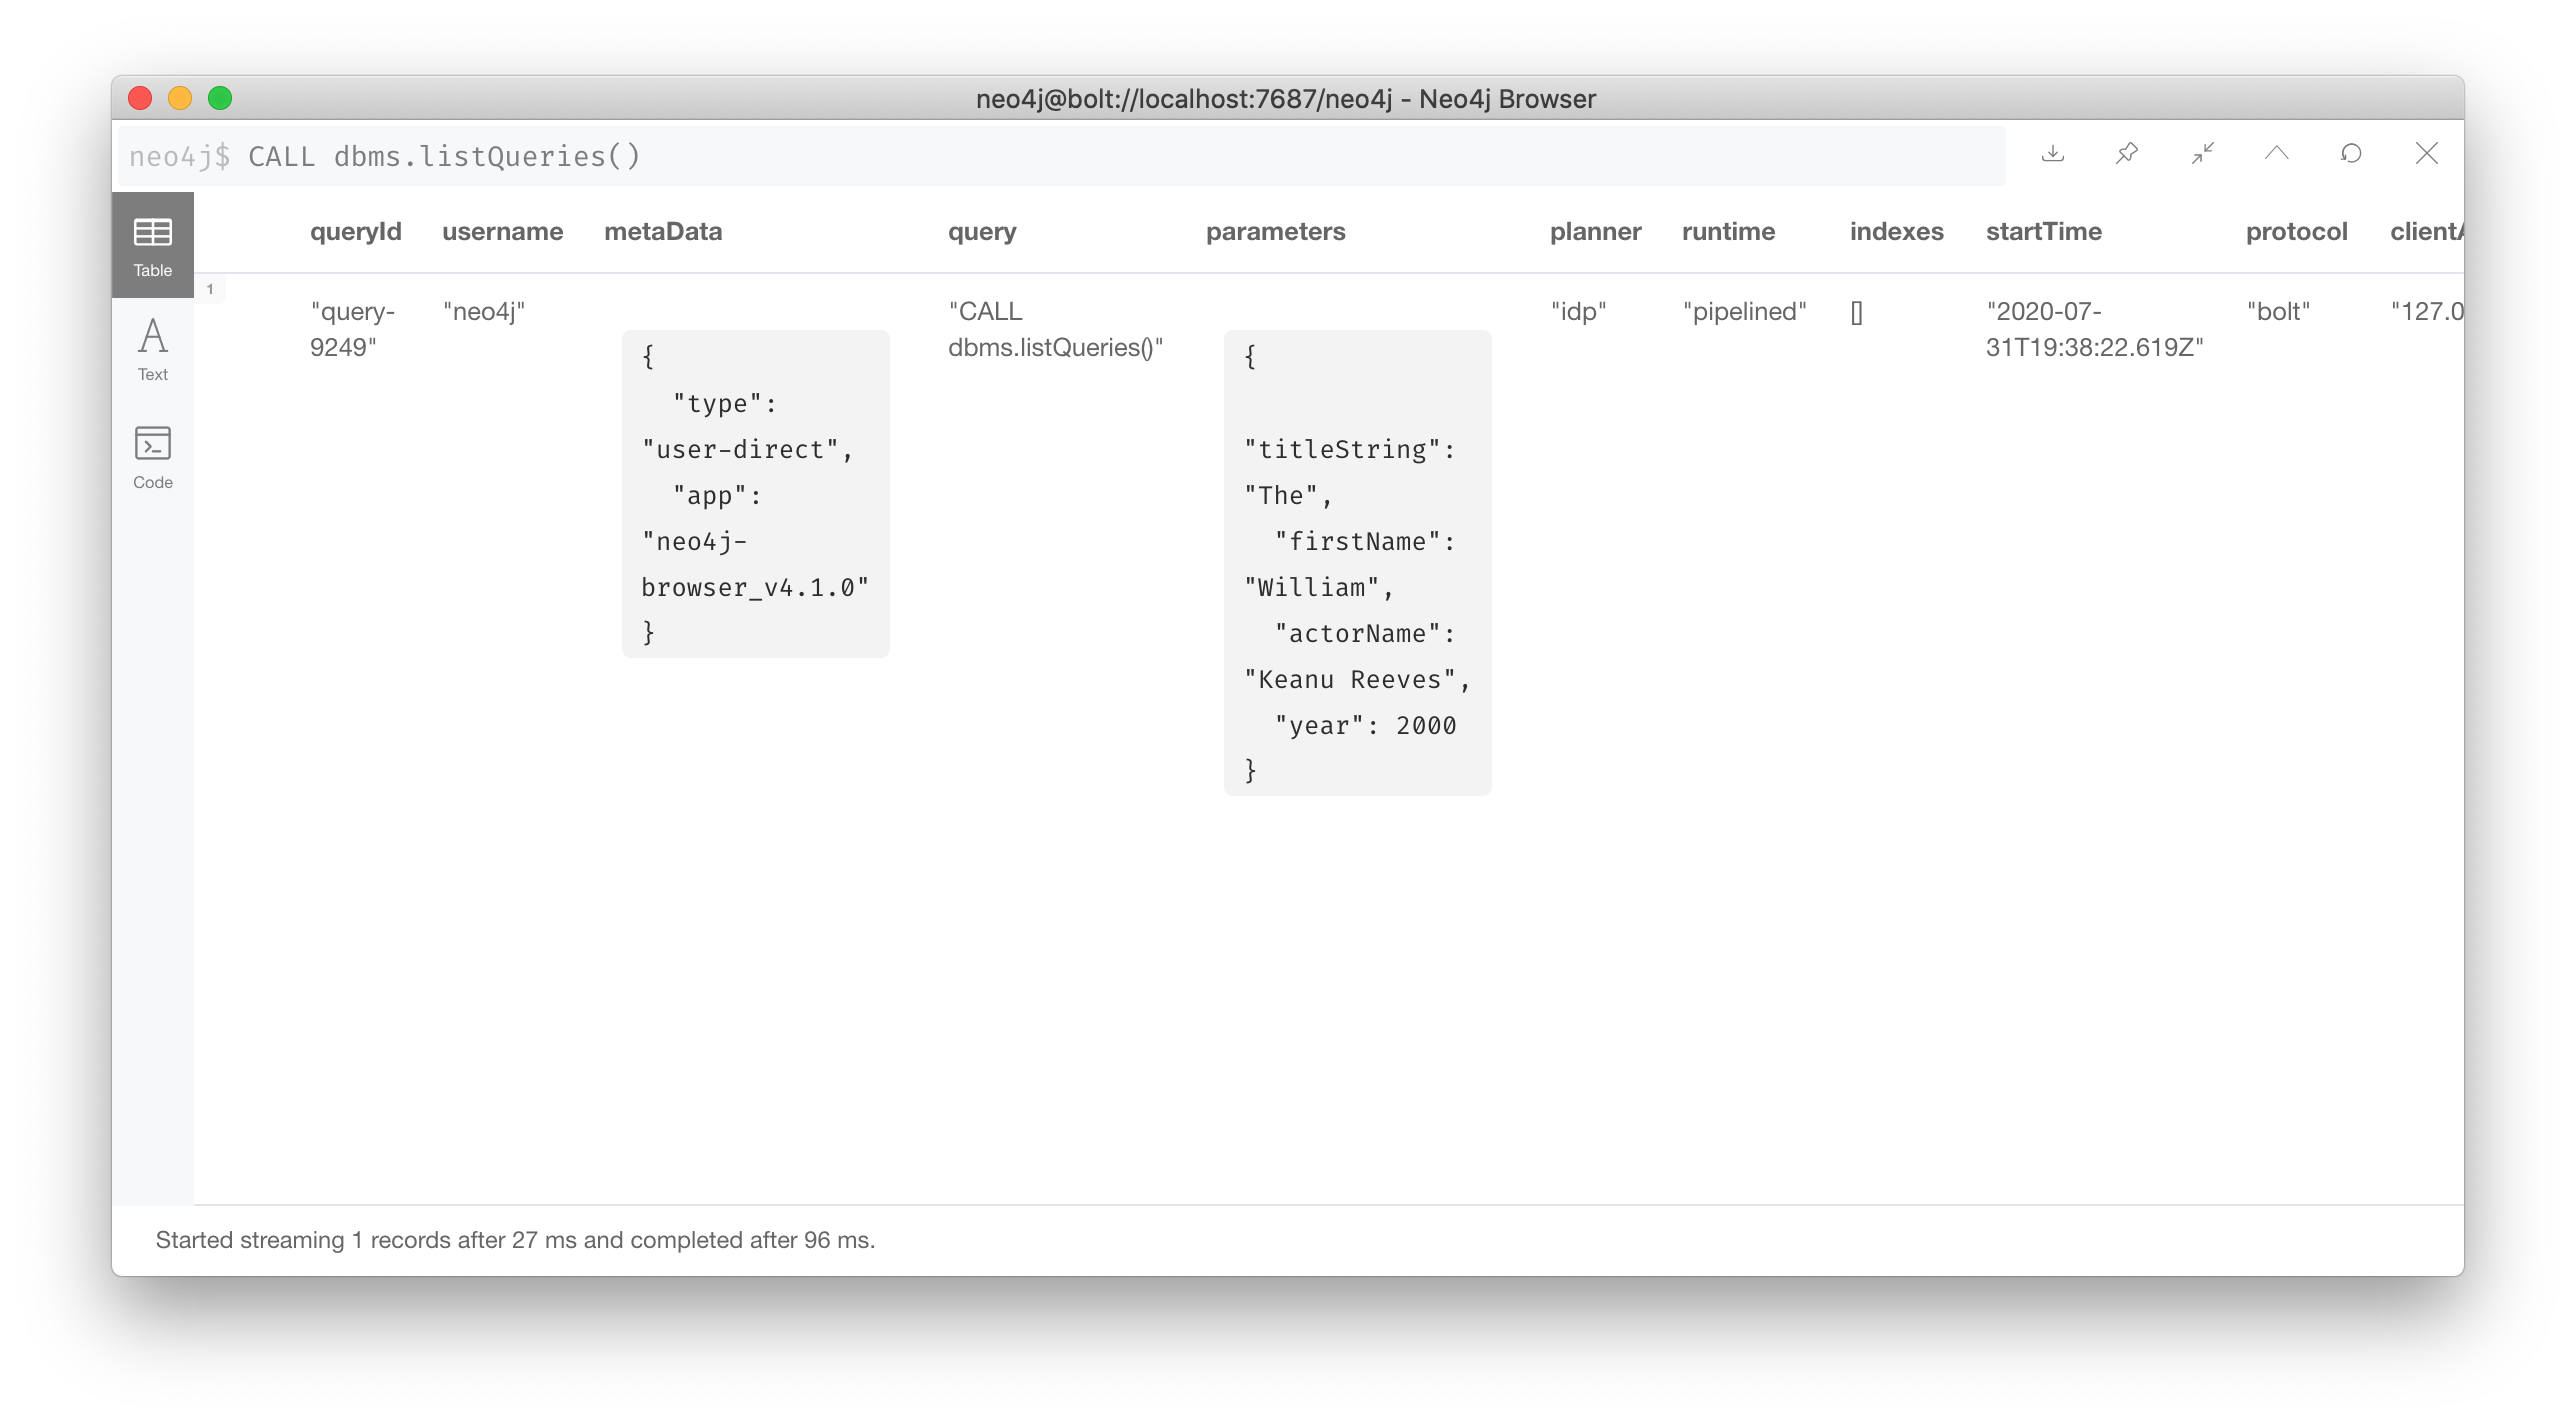
There may be situations where a user/client performs a query that does not return or perhaps takes an extremely long time to return. In this case, you can run this procedure to view all currently running queries:
:queries
// OR
CALL dbms.listQueries()
This procedure returns information about all running queries owned by neo4j. In this example, the only query that is running is the one to list the queries.
Returning specific query values
You can also specify what values you want returned from this procedure:
CALL dbms.listQueries() YIELD queryId, username, metaData, query, planner , runtime , indexes , startTime , protocol , clientAddress , requestUri , status , resourceInformation , activeLockCount , elapsedTimeMillis , cpuTimeMillis , waitTimeMillis , idleTimeMillis , allocatedBytes , pageHits , pageFaults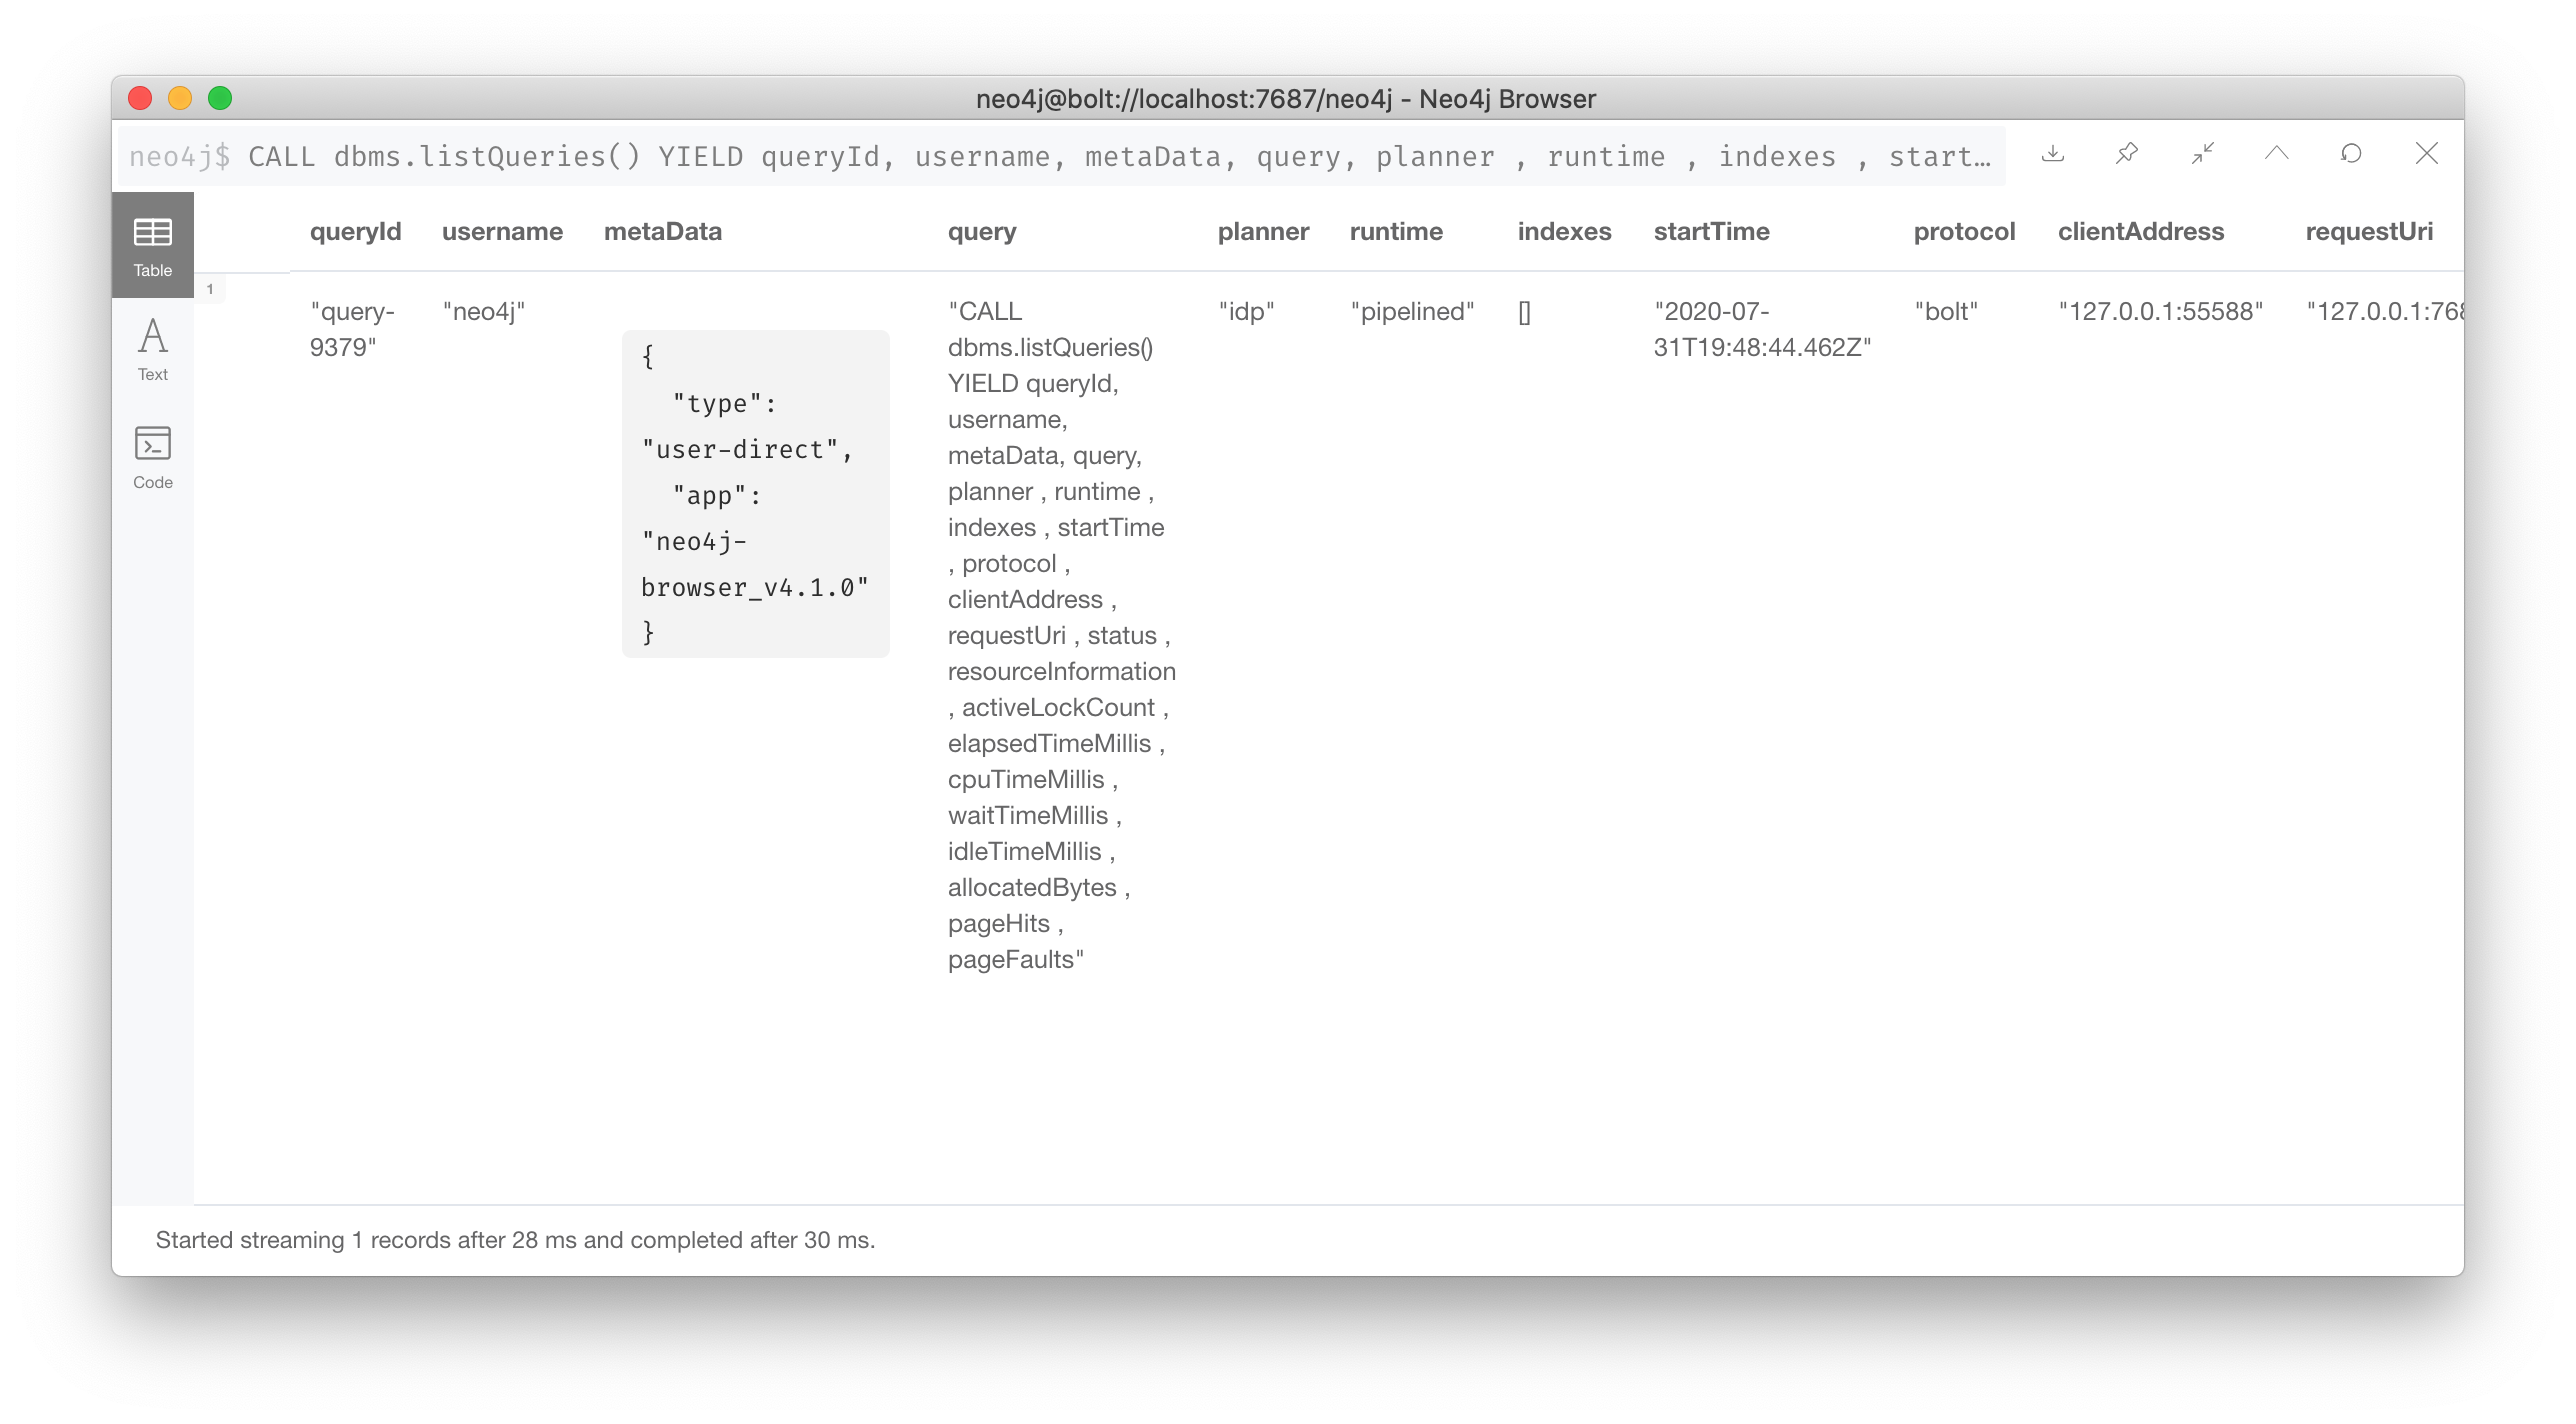
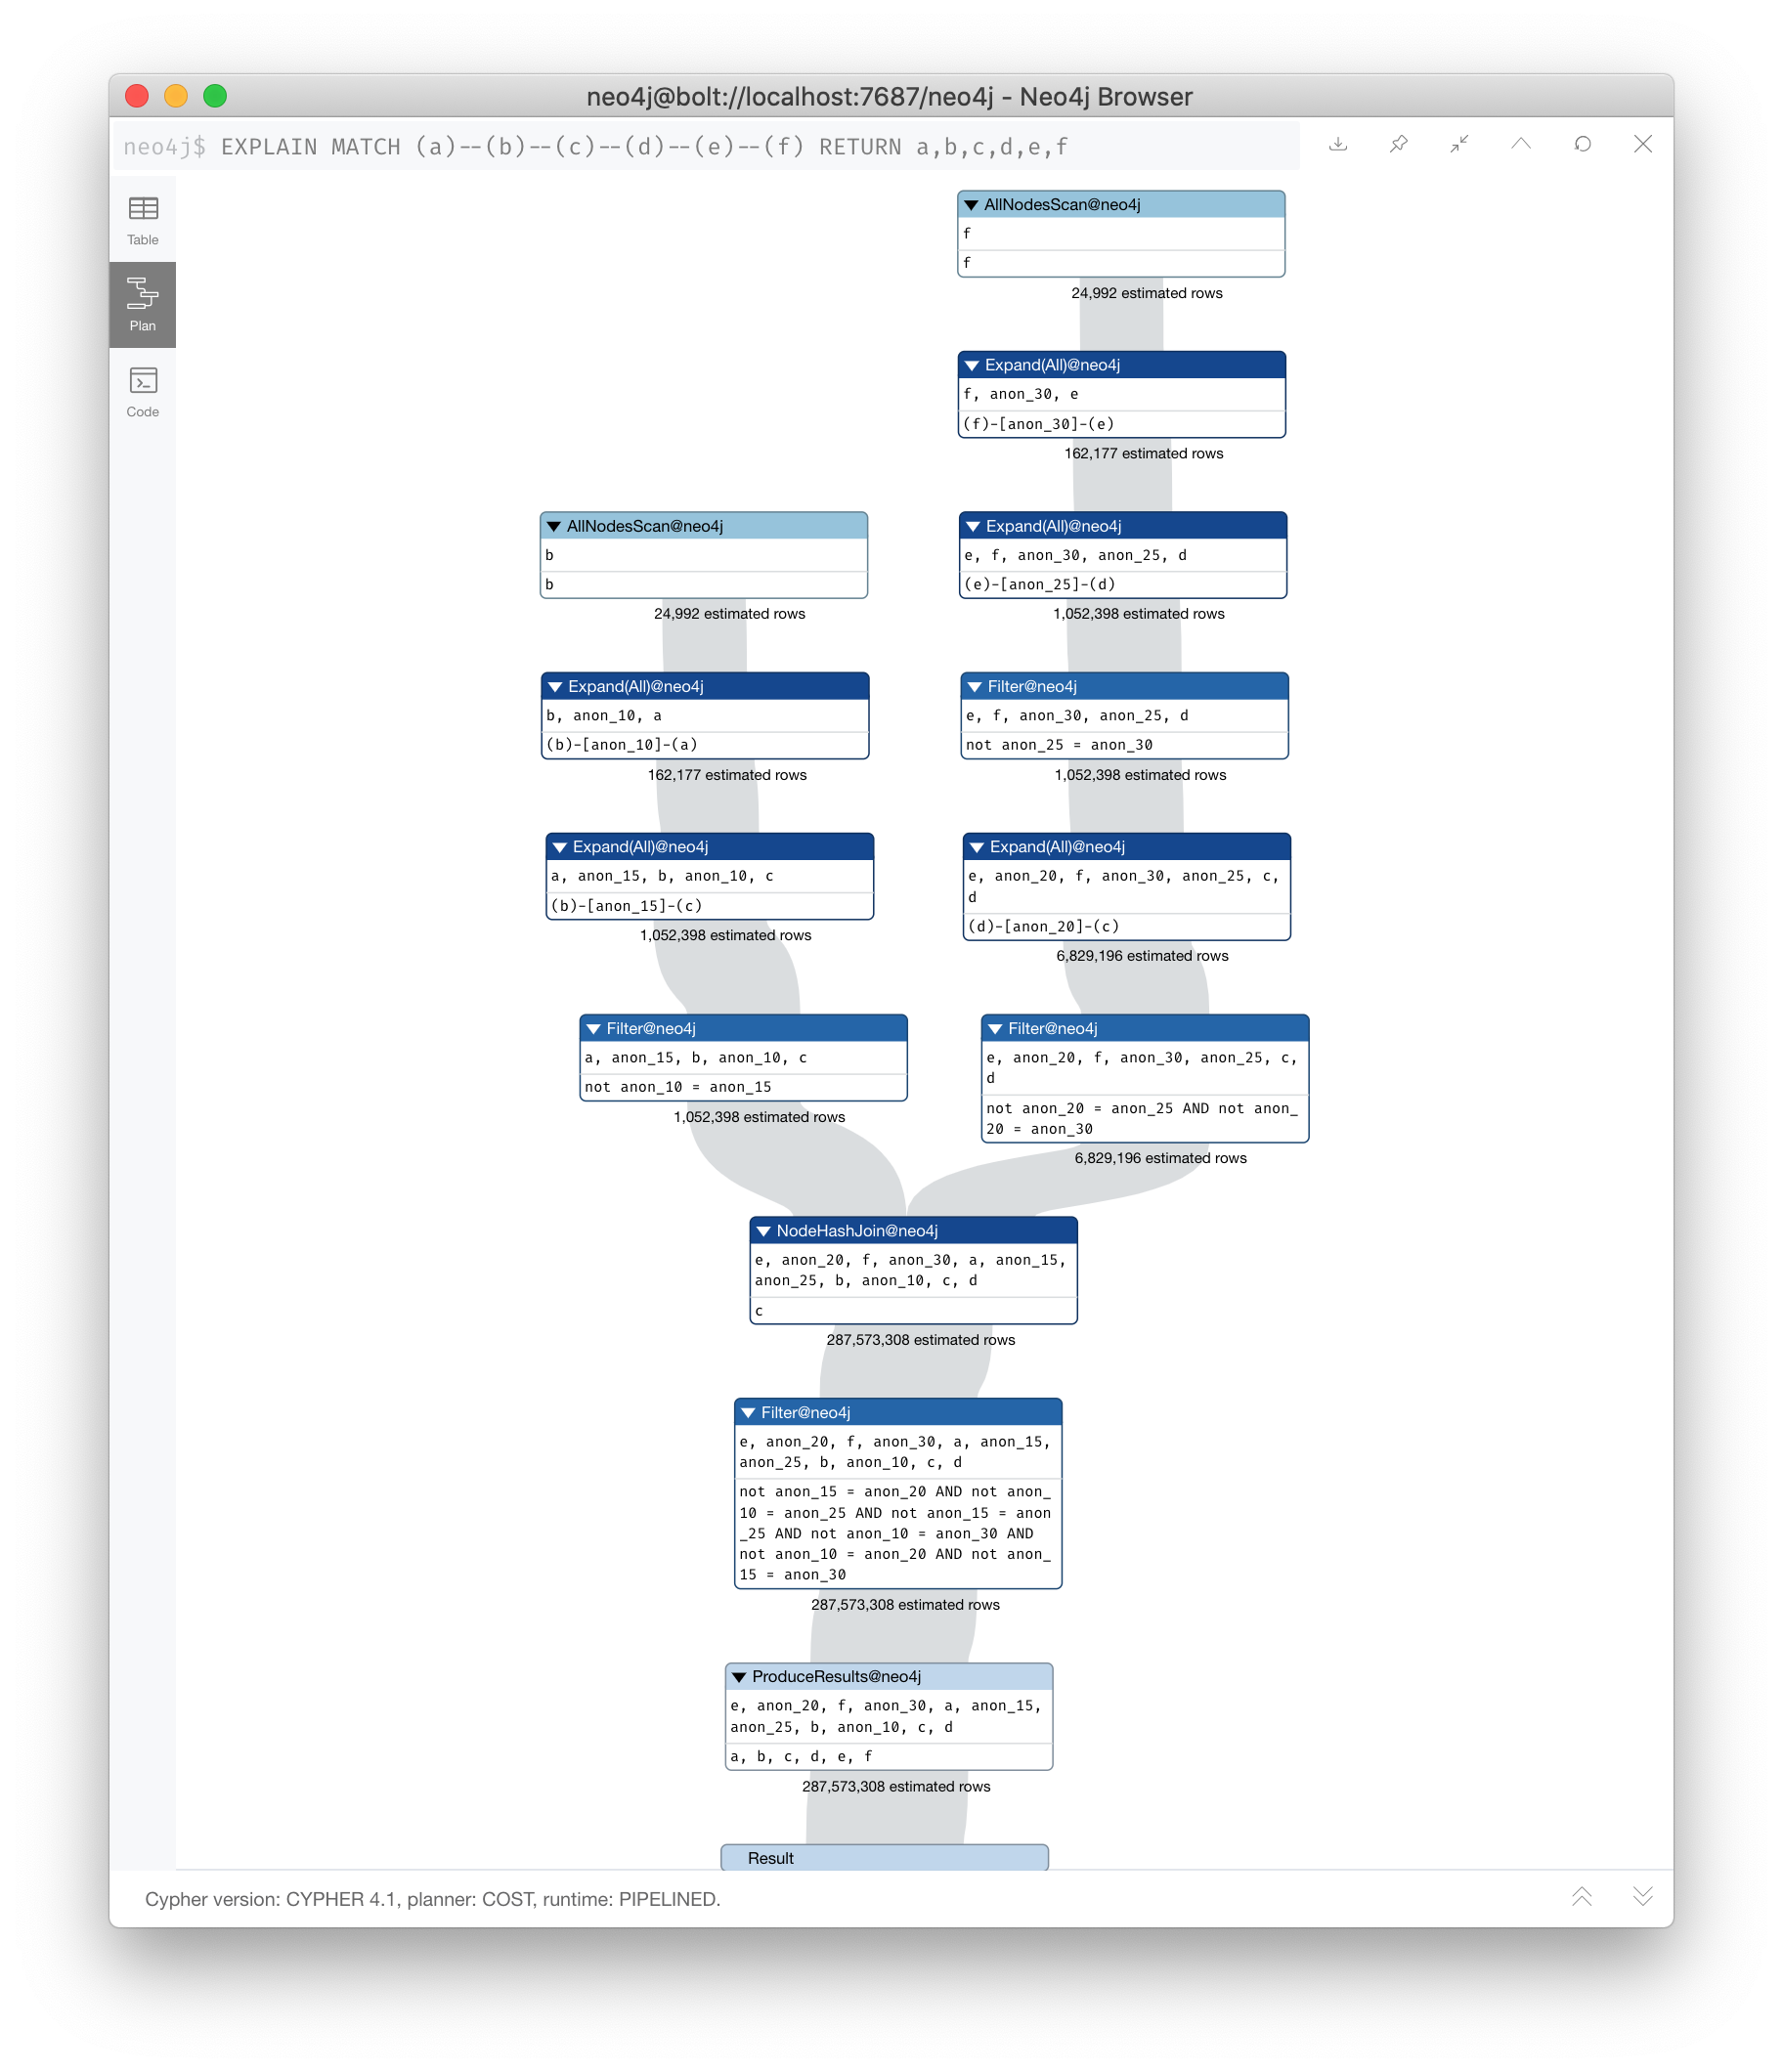
Queries that return too much data
Here is an example of a query that takes a long time to execute because it returns a lot of data:
EXPLAIN MATCH (a)--(b)--(c)--(d)--(e)--(f) RETURN a,b,c,d,e,fThis query processes a lot of data, but also returns a lot of data.
Here is the explanation of the query:
Monitoring the long-running query
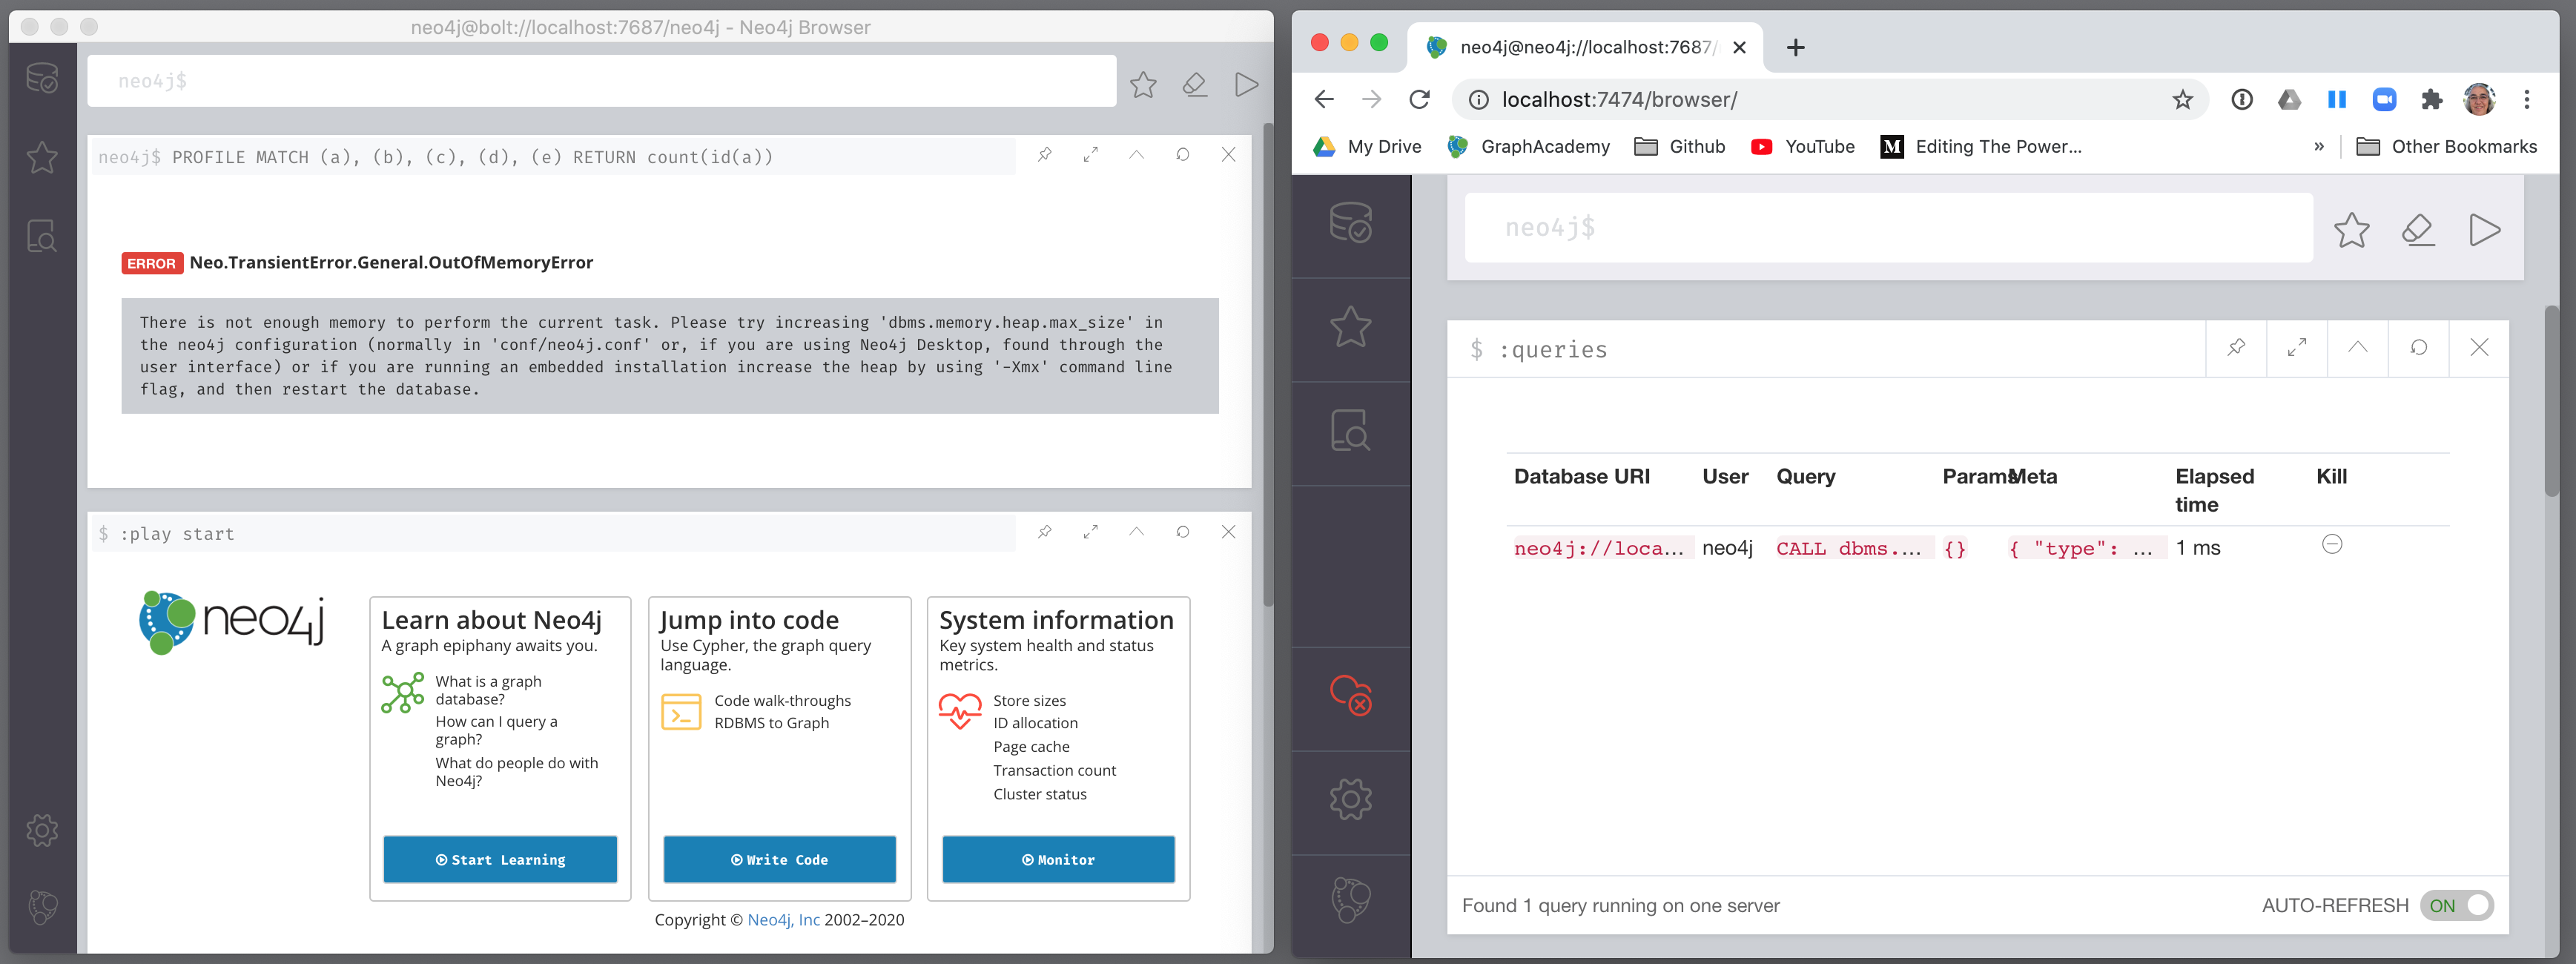
When this query runs (on left) , you can see it running when you run listQueries() (:queries) (on right):
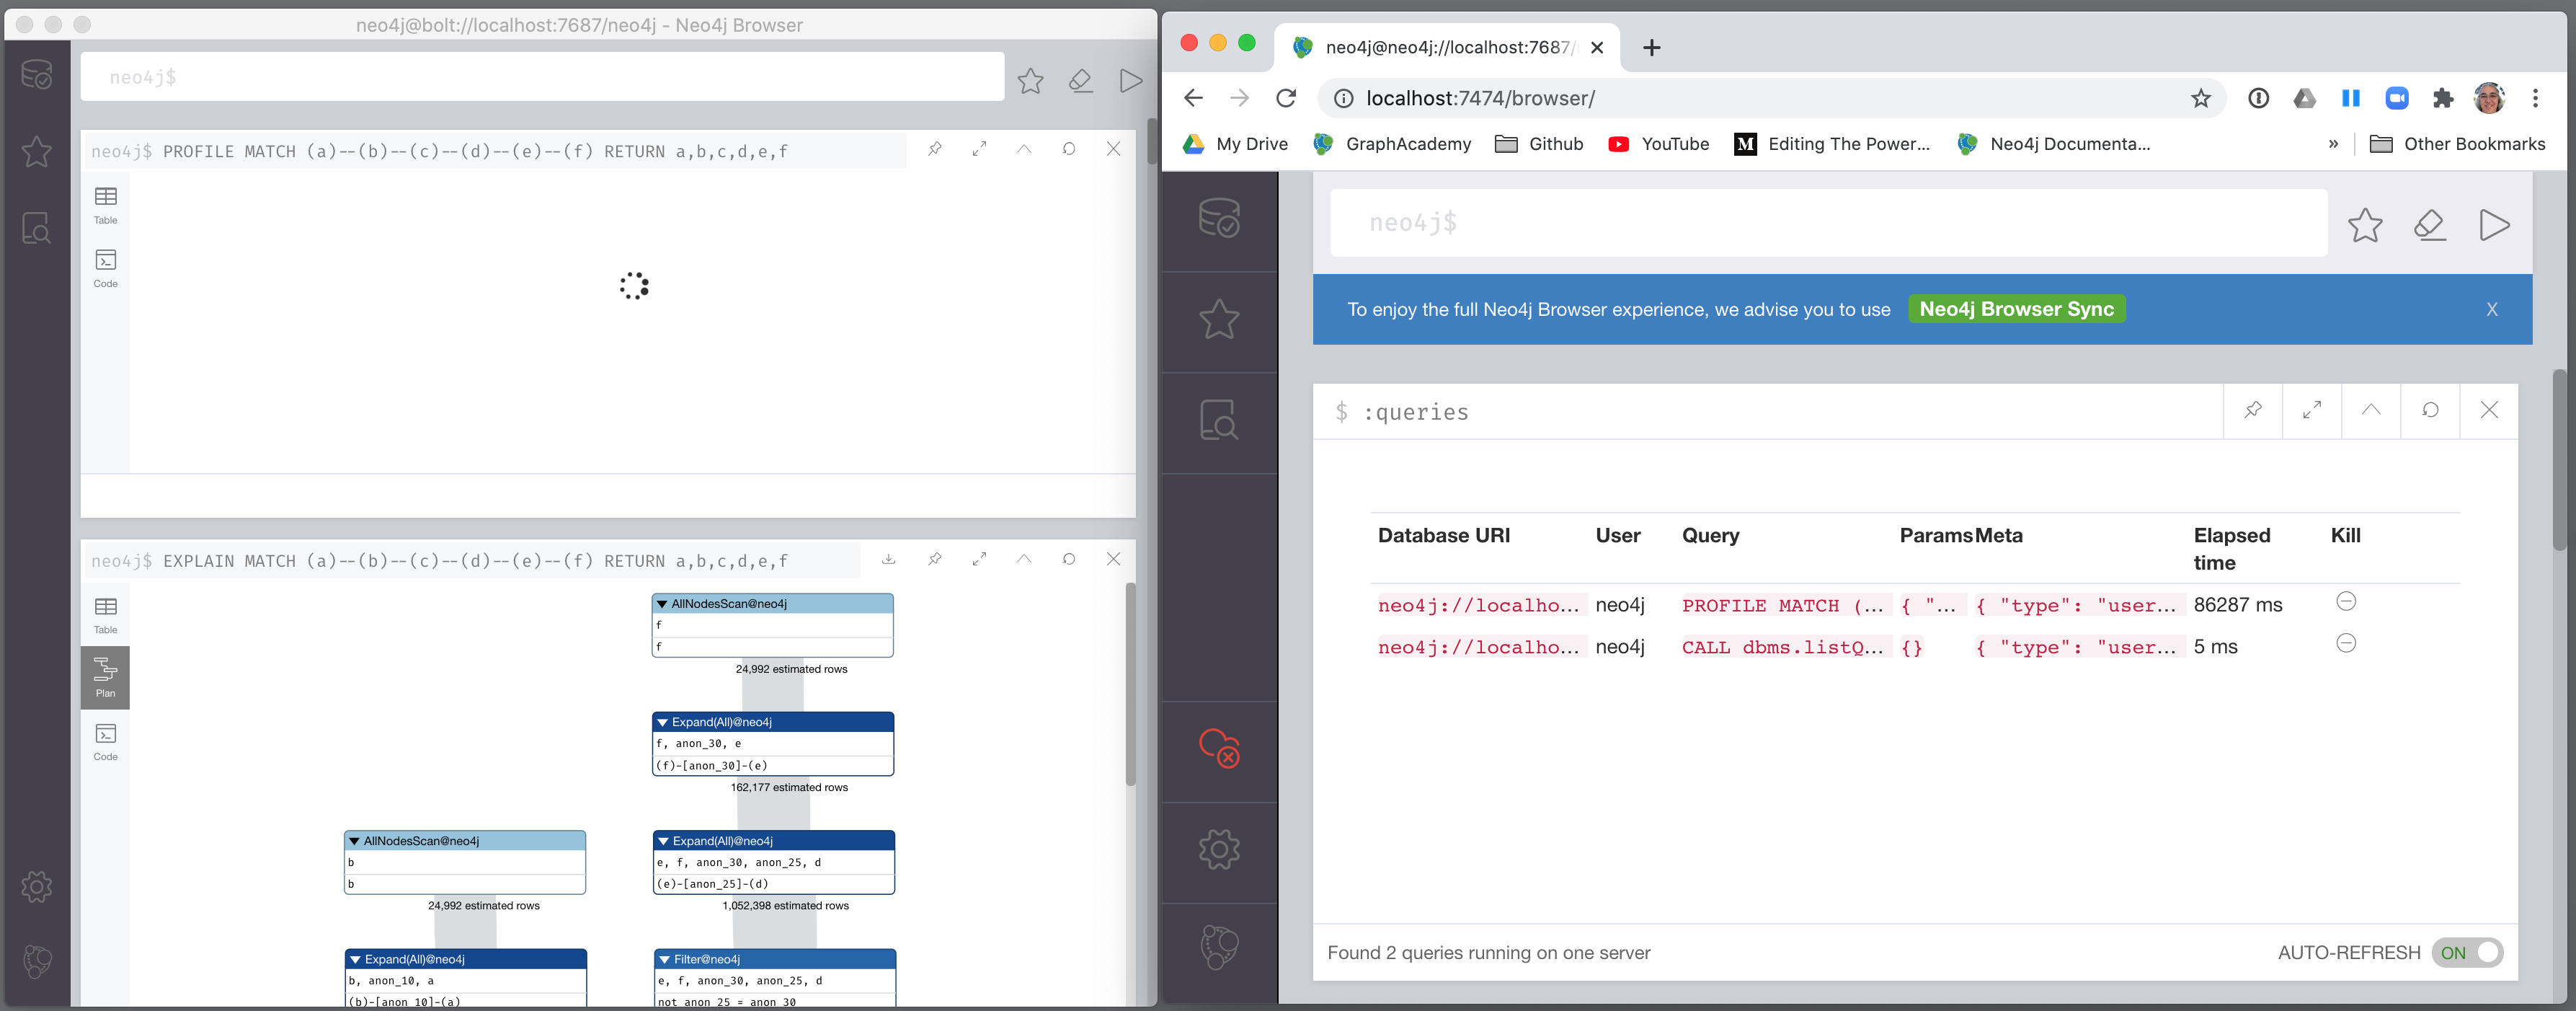
This query can be killed by the client (on left) by closing the Neo4j Browser pane where it is running. However, in the Neo4j Browser session on the right, we cannot kill it in the UI. Later in this lesson, you will learn how to kill it from another session.
Queries that take too long to run
Here is an example of a query that takes a long time to execute:
EXPLAIN MATCH (a), (b), (c), (d), (e) RETURN count(id(a))Here is the explanation of the query:
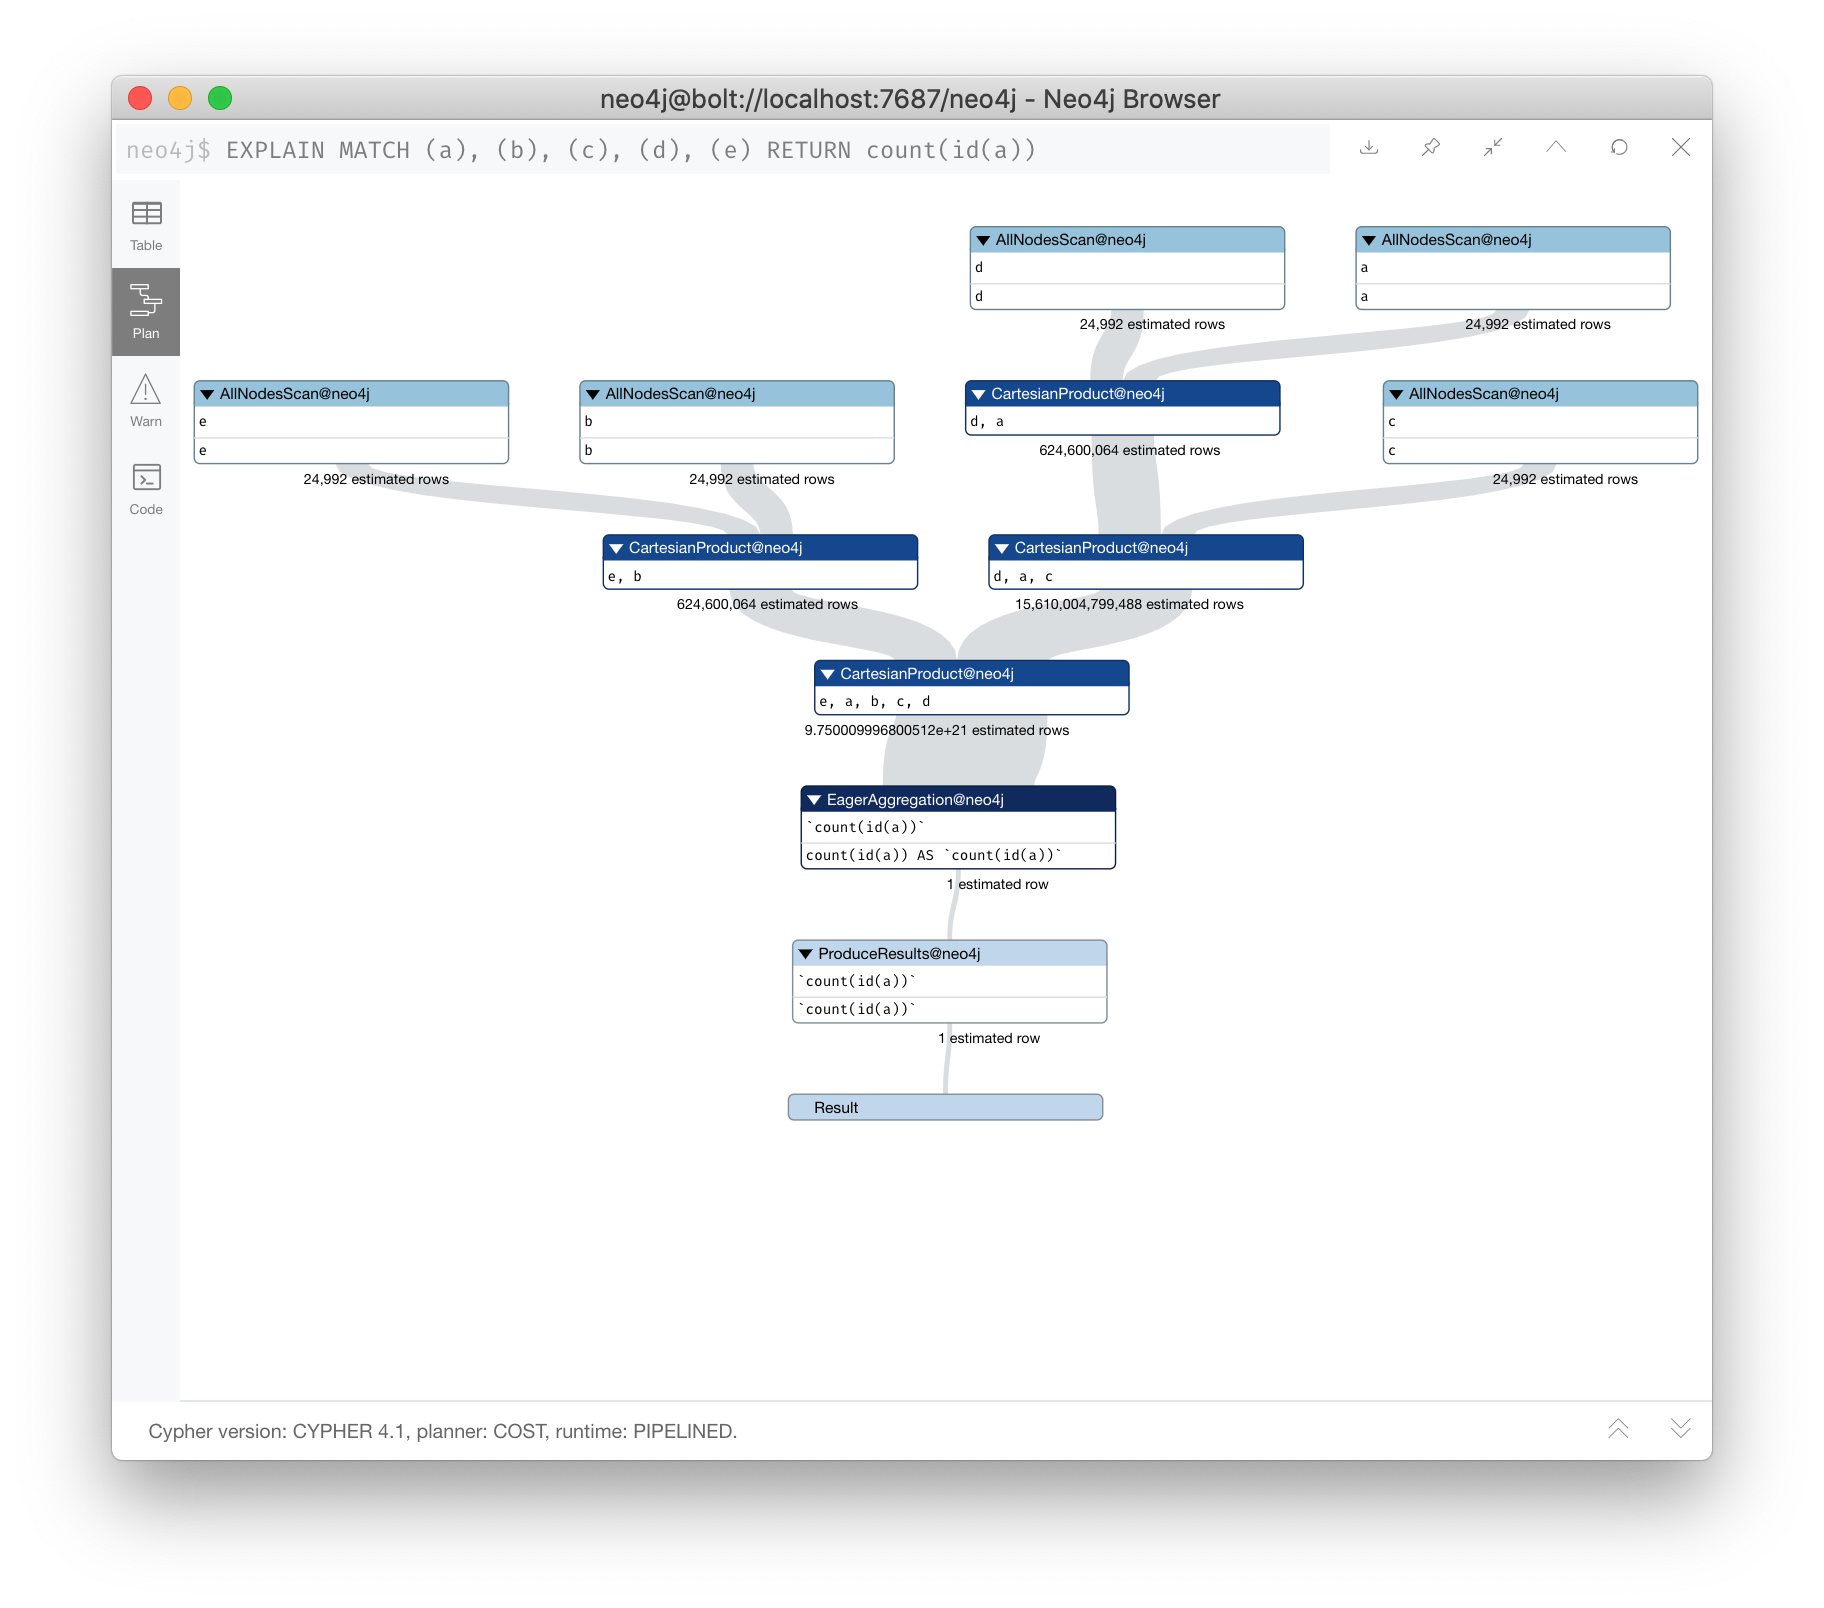
Notice that is does a lot of cartesian products, but only returns one row.
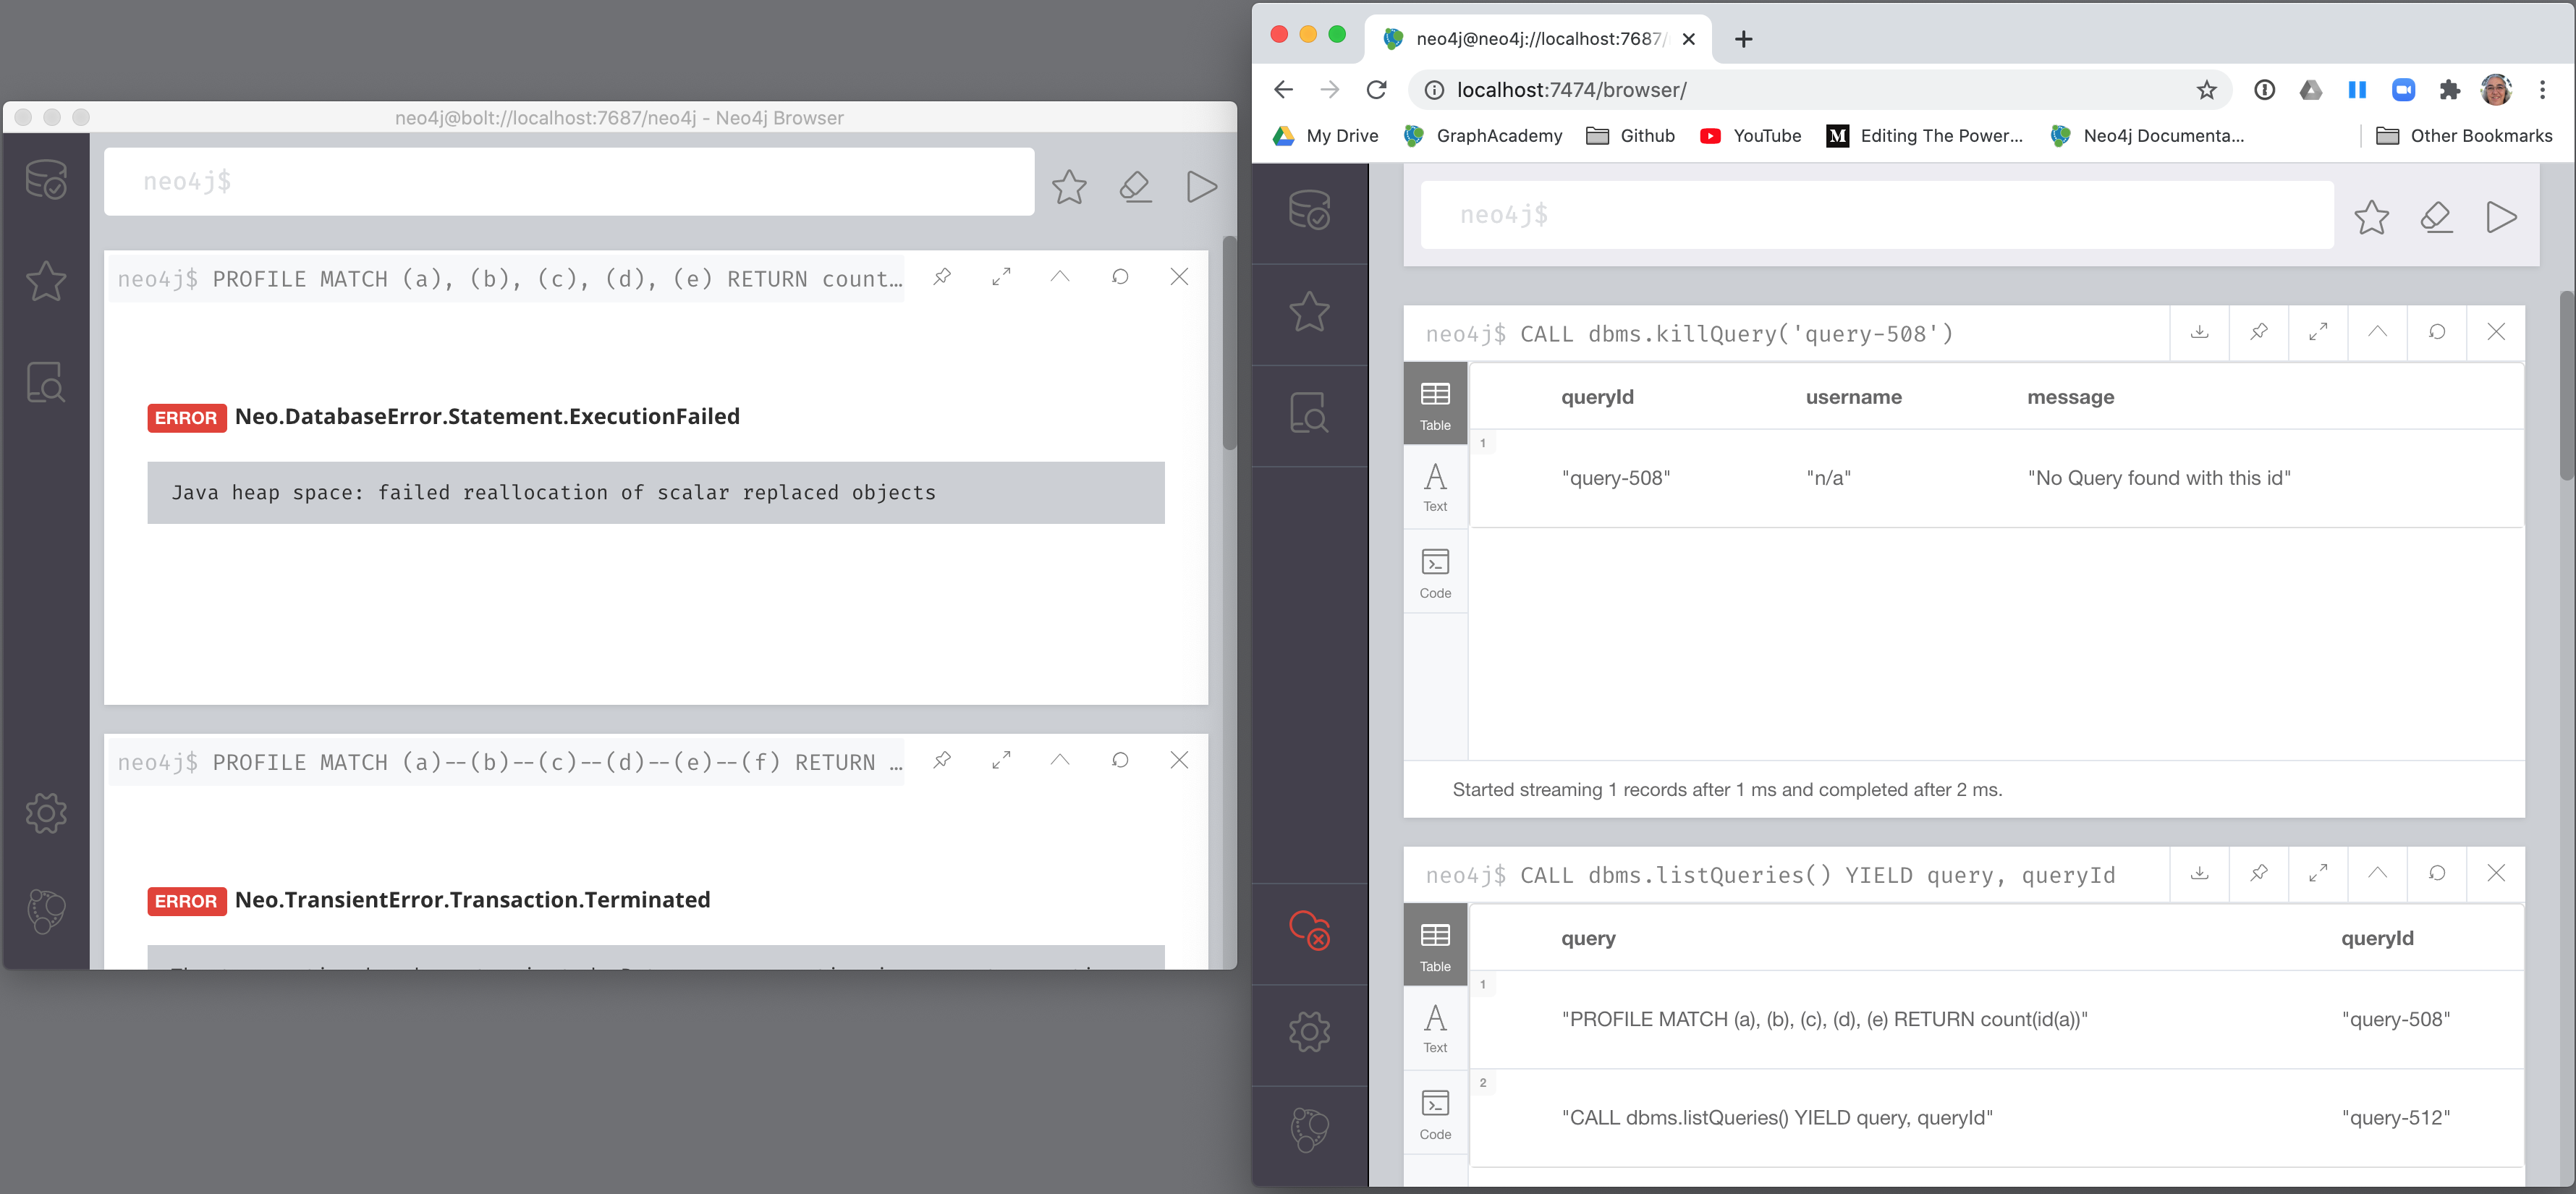
Monitoring the long-running query
This query can be killed by the client (on left) by closing the Neo4j browser pane where it is running. However, in the Neo4j Browser session on the right, we cannot kill it in the UI. If it is not killed by the client, it will eventually run out of memory.
| A query may also take a long time to execute because of lock contention. This course does not cover multi-user query issues. |
Killing a query from a different session
The neo4j user has admin privileges. In your real application environment, you may create other users with admin role. As a user with the admin role, you can view queries of all users and you can also kill their queries by calling a Cypher procedure.
If you know that a query is running too long and you want to kill it, you do the following:
CALL dbms.listQueries() YIELD query, queryId;
// followed by
CALL dbms.killQuery('<queryid value>')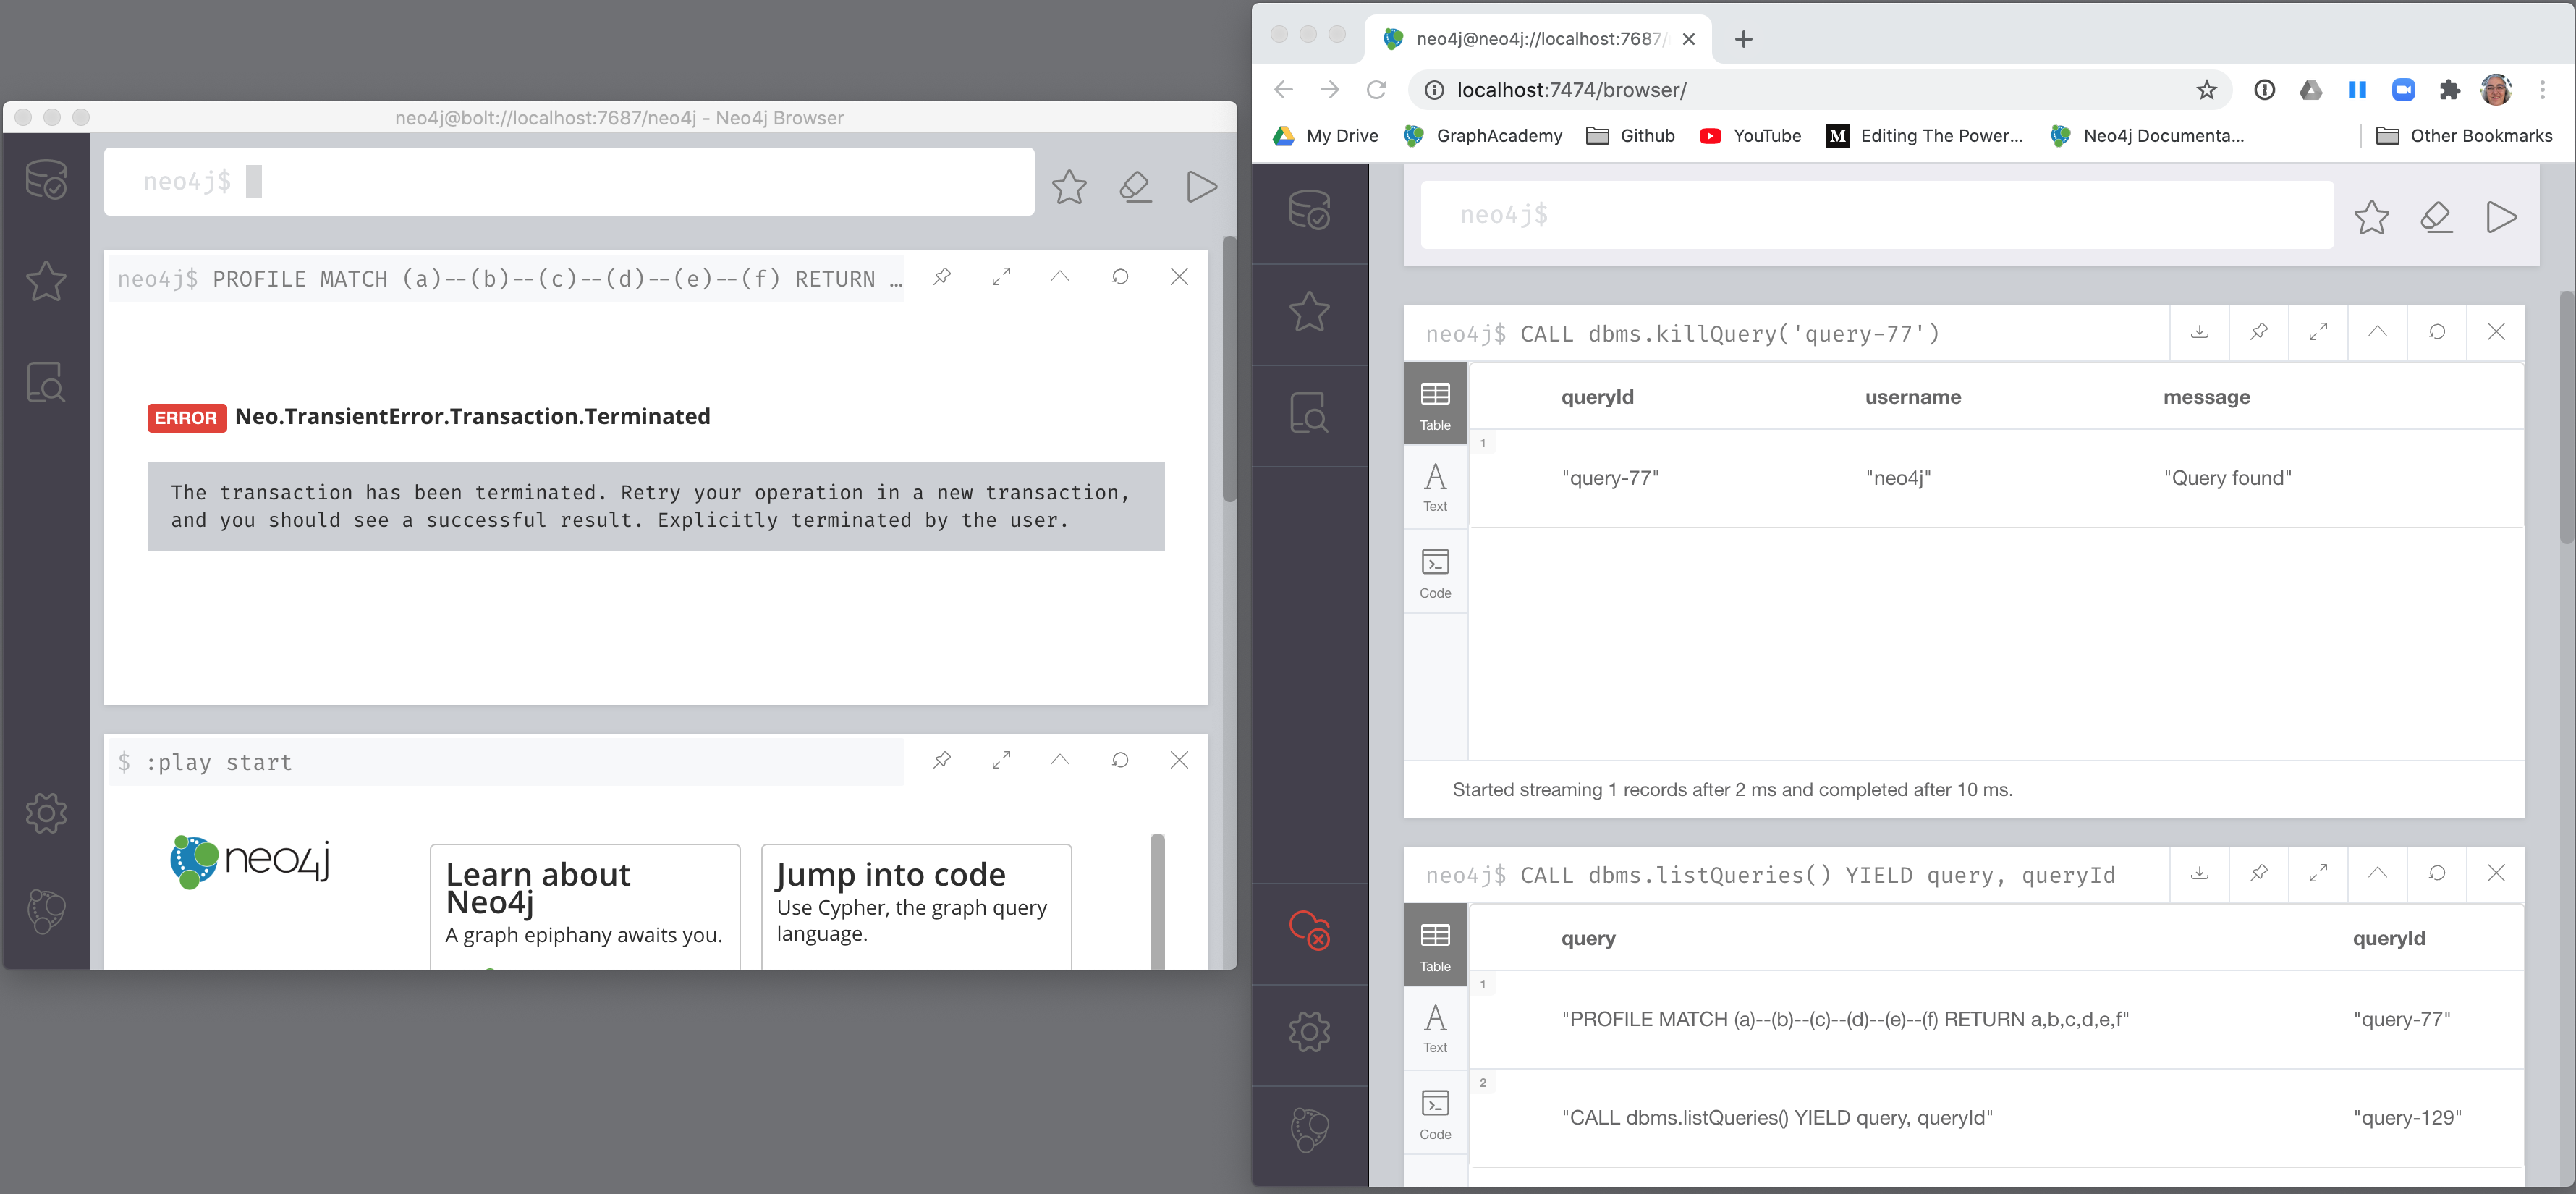
Automating the killing of long-running queries
Some queries against the Neo4j instance are not simply queries, but are Cypher statements that load data from CSV files. These types of Cypher statements could take a considerable amount of time to complete. One option for you to help automate the killing of long-running queries is to create a script that executes a Cypher statement such as the following:
CALL dbms.listQueries() YIELD query, elapsedTimeMillis, queryId, username
WHERE NOT query CONTAINS toLower('LOAD')
AND elapsedTimeMillis > 30000
WITH query, collect(queryId) AS q
CALL dbms.killQueries(q) YIELD queryId
RETURN query, queryId
This Cypher statement will retrieve all queries that are running for longer than 30000 ms that do
not perform a LOAD operation and kill them. You could place this code into a script that is run at
regular intervals.
See the documentation about the db.stats.xx() procedures you can call to collect query details in the Operations Manual.
|
Exercise 7: Monitoring Running Queries
In the query edit pane of Neo4j Browser, execute the browser command:
:play 4.0-query-tuning-exercises
and follow the instructions for Exercise 7.
| This exercise has one step. Estimated time to complete: 15 minutes. |
Configuring query logging
In addition to monitoring currently-running queries, you can also configure Neo4j to automatically kill queries that run too long or log information about queries.
| You cannot change configuration settings if you are using Neo4j Sandbox or Neo4j Aura. |
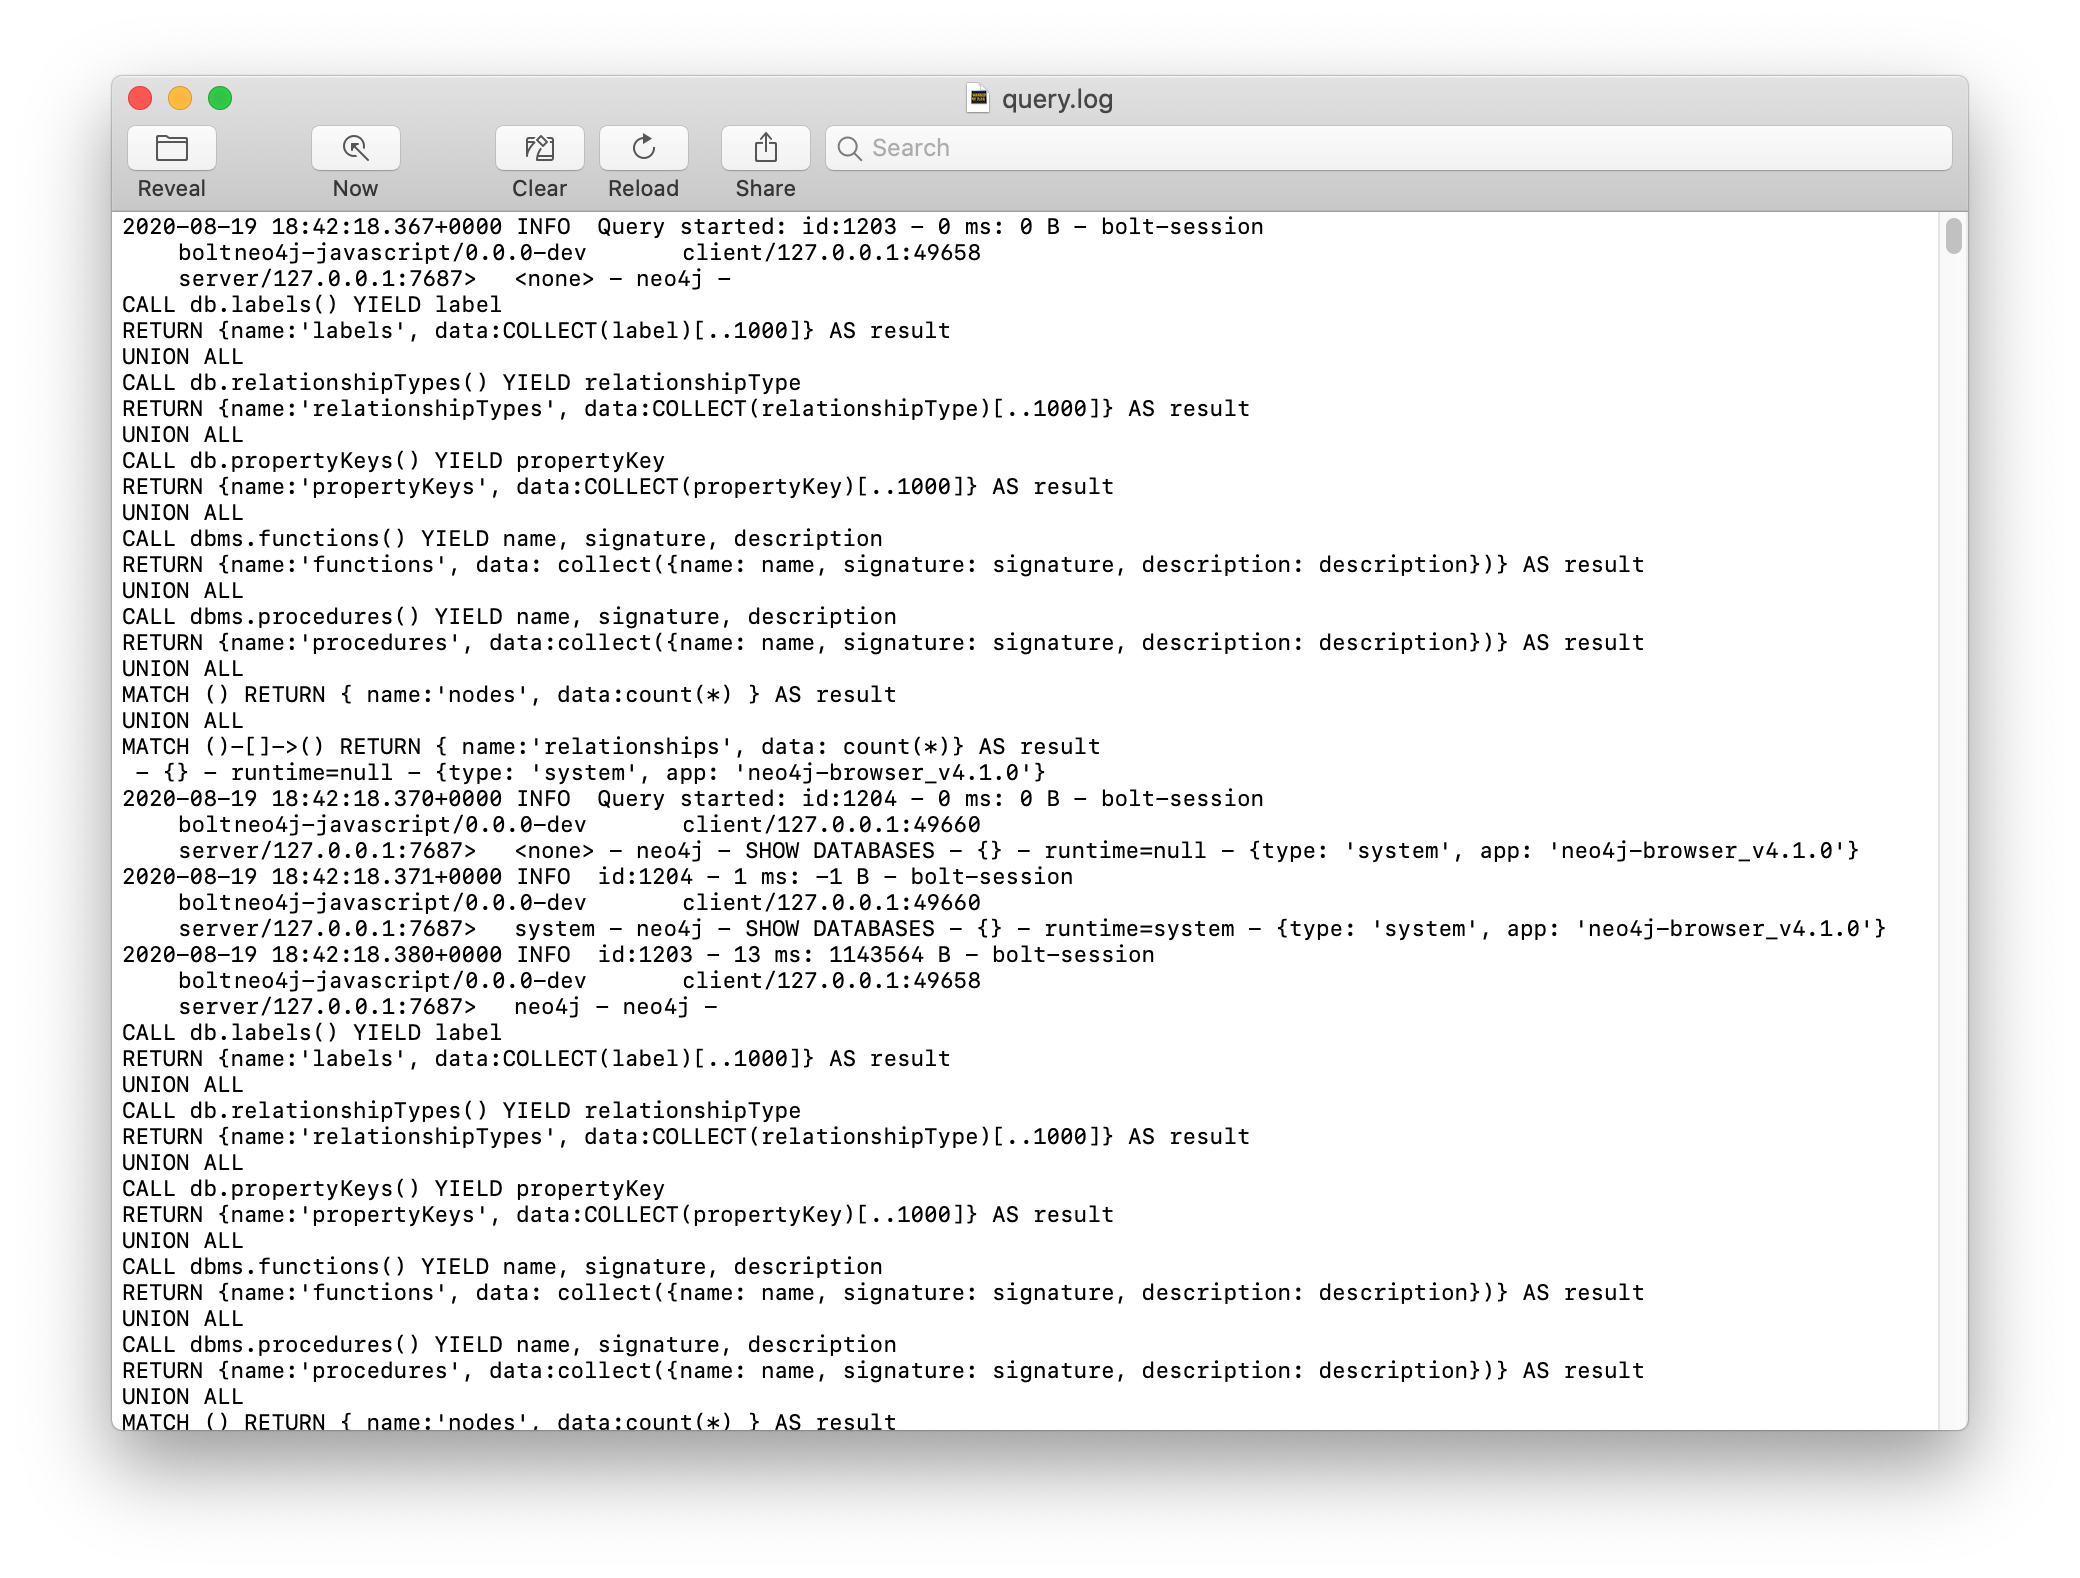
You can configure Neo4j to log an event if a query runs more than xx milliseconds. There is no standard for what a reasonable period of time is for a query, but in most databases, a query that runs for minutes is not a good thing! At a minimum, you must enable logging for queries and set a threshold for the length of time queries take. Then, as part of your monitoring, you could regularly inspect the query.log file to determine if a certain set of queries or users are possibly performing queries that tax the resources of the Neo4j instance.
Here are the properties you would set in the Neo4j configuration to log a message and provide information when a query takes more than 1000ms to complete:
dbms.logs.query.enabled=INFO
dbms.logs.query.threshold=1000ms
dbms.logs.query.parameter_logging_enabled=true
dbms.logs.query.time_logging_enabled=true
dbms.logs.query.allocation_logging_enabled=true
dbms.logs.query.page_logging_enabled=true
dbms.track_query_cpu_time=true
dbms.track_query_allocation=true
Upon restart of the Neo4j DBMS, these logging settings will take effect.
If you set dbms.logs.query.threshold=0ms all queries are logged. Parameter logging can be expensive and can affect performance, especially when loading data.
|
Using Neo4j Query Log Analyzer
A tool that helps you to understand your application queries is Neo4j Query Log Analyzer. This tool is installed in Neo4j Desktop and enables you to examine the query log file to understand current and historical performance trends.
With this tool, you specify a query log file and then you can look at the metrics for all queries in the query log file.
| Since the Neo4j Query Log Analyzer is a graph app, it must be run in a Neo4j Desktop environment. You can have a remote connection to a Neo4j Sandbox or Neo4j Aura DBMS so you can monitor it. Here is an example of the query stats display in the tool: |
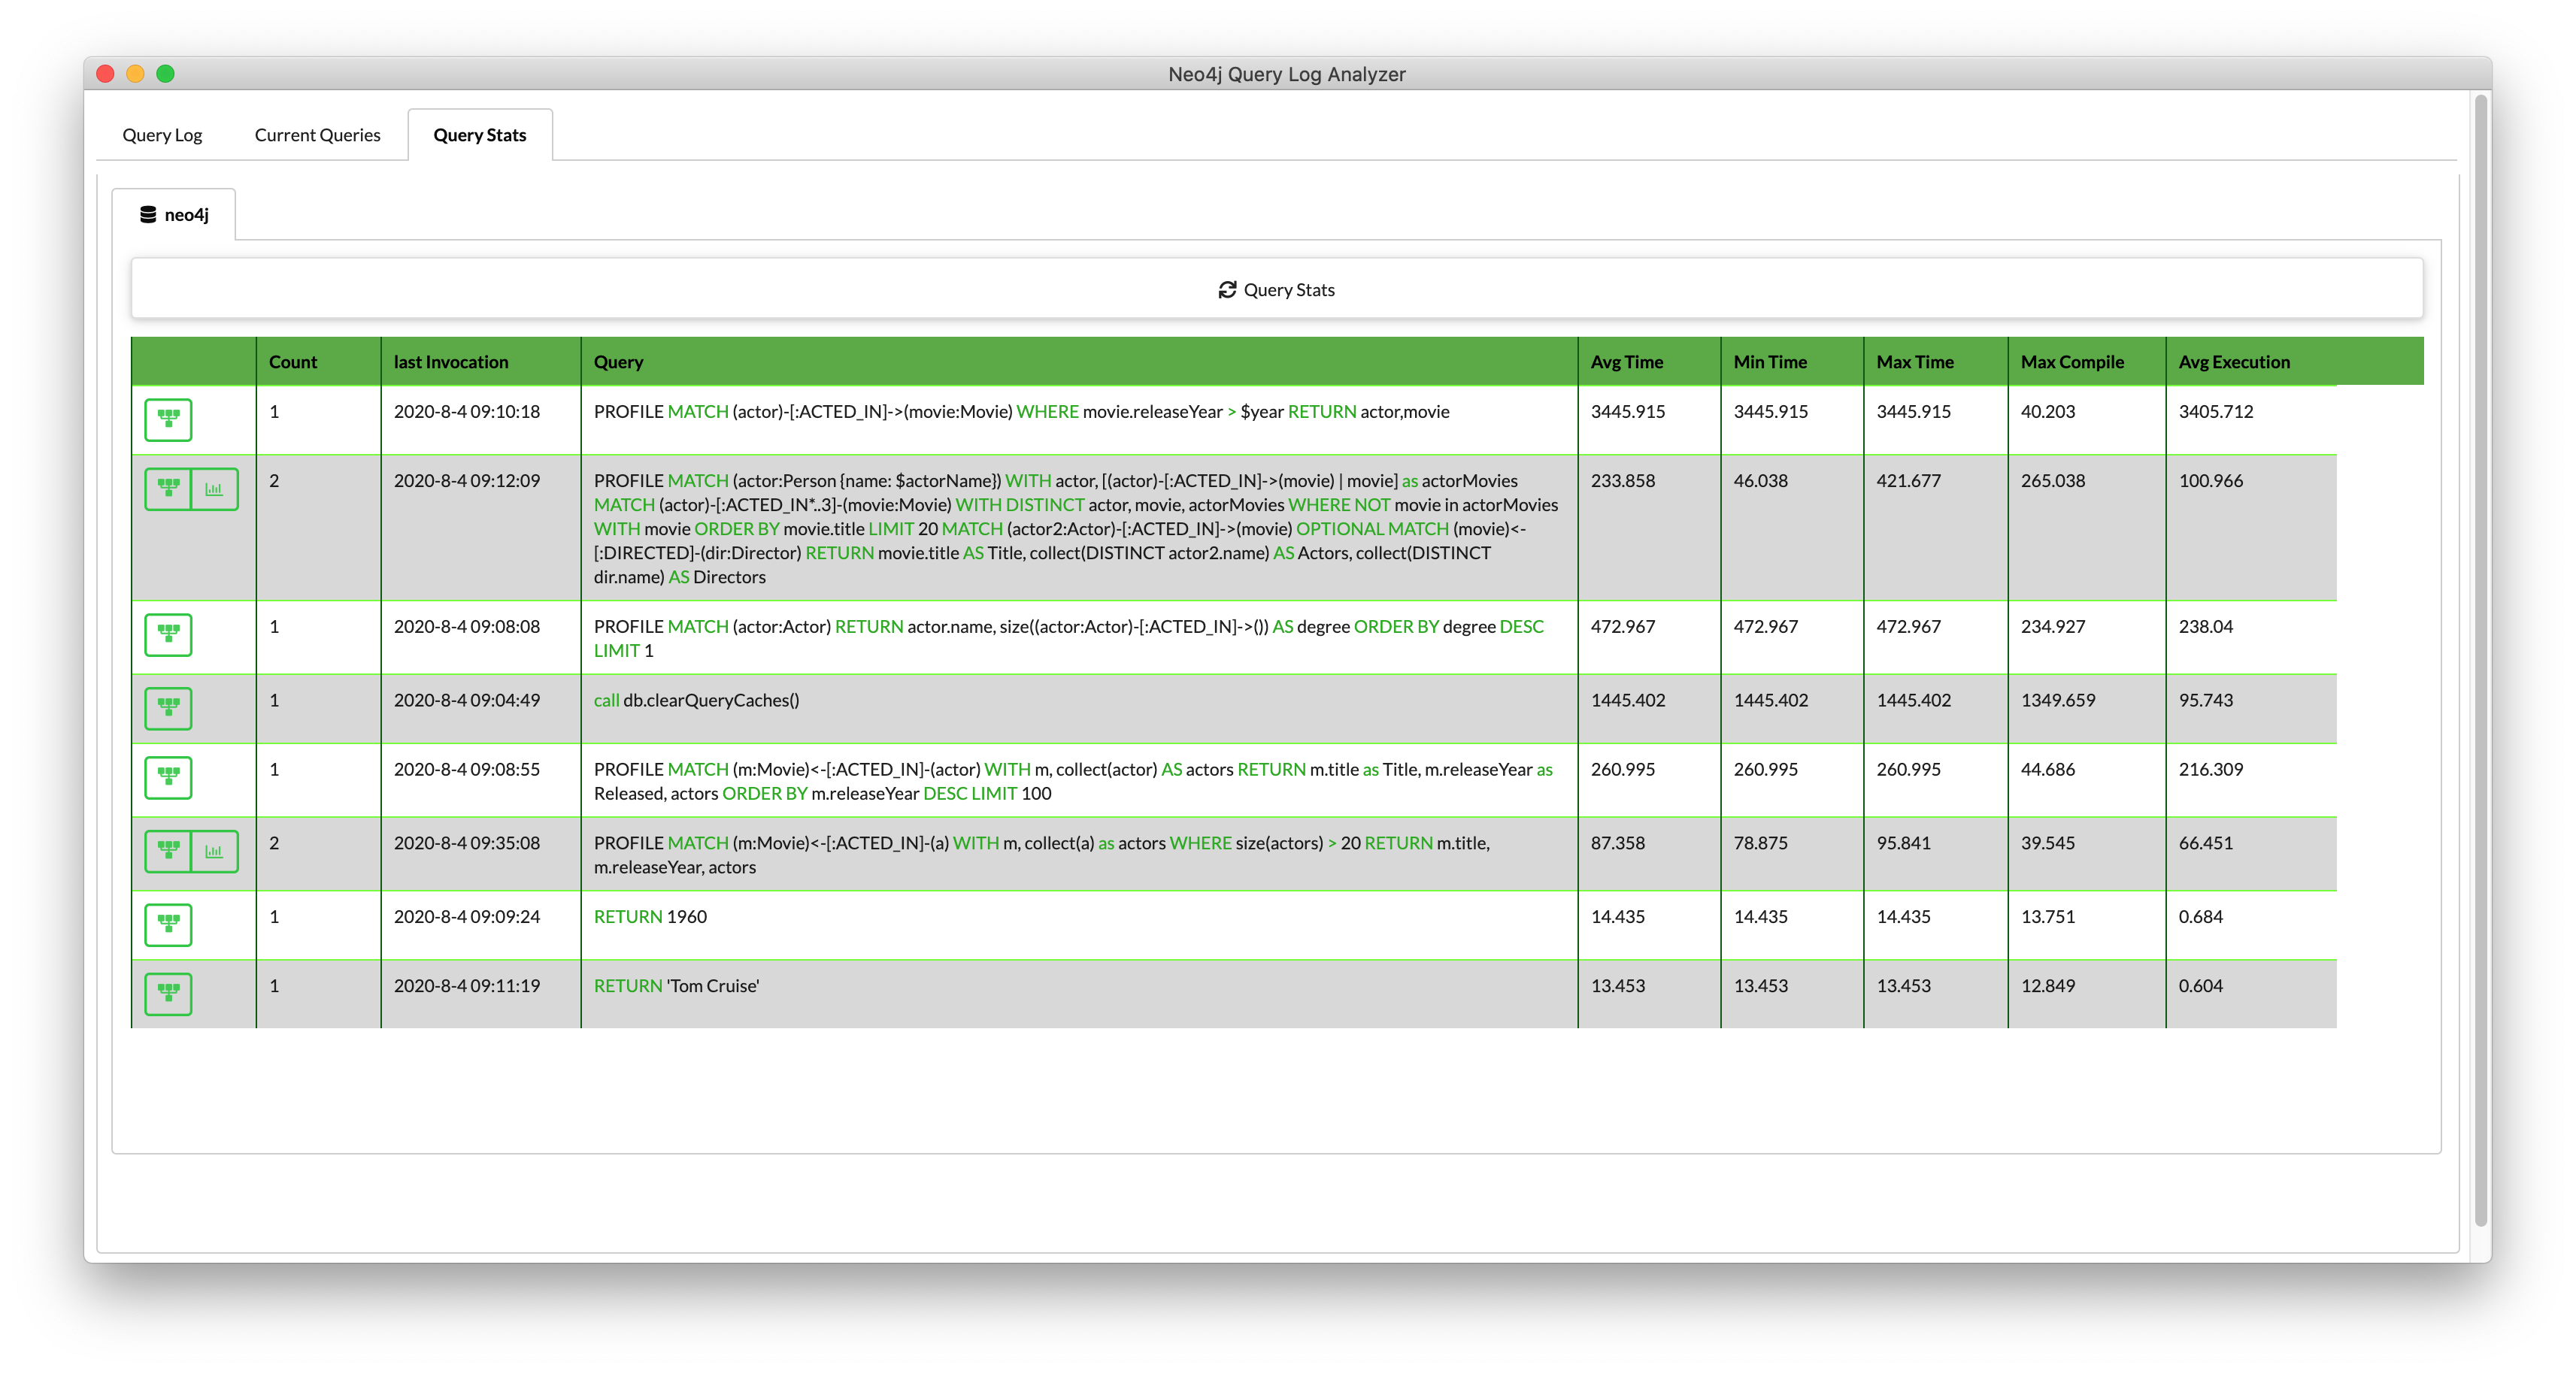
This tool is an evolving work in progress by a Neo4j engineer. You can read more about it here.
In the next exercise, you will install and start using Neo4j Query Log Analyzer.
Exercise 8: Getting Started with Neo4j Query Log Analyzer
In the query edit pane of Neo4j Browser, execute the browser command:
:play 4.0-query-tuning-exercises
and follow the instructions for Exercise 8.
| You can only perform this exercises if you are using Neo4j Desktop. This exercise has 4 steps. Estimated time to complete: 30 minutes. |
Check your understanding
Question 1
Suppose you have a query that is not returning in a Neo4j Browser session. How can you kill the query?
Select the correct answers.
-
Close the result pane for the query that is running in the current session.
-
Type
:killin the query pane for the Browser session that is running. -
In a different Neo4j Browser session that has admin privileges call killQuery() providing the query string.
-
In a different Neo4j Browser session that has admin privileges call killQuery() providing the query ID.
Question 2
What are some reasons why a query would take a long time to return?
Select the correct answers.
-
The query requires a lot of memory to execute completely.
-
The query returns a lot of data.
-
There is more than one client trying to read the same data.
-
There is another client that has write locks on the same data.
Summary
You can now:
-
Monitor queries that are currently running.
-
Configure query logging.
-
Monitor historical metrics for queries.
Need help? Ask in the Neo4j Community