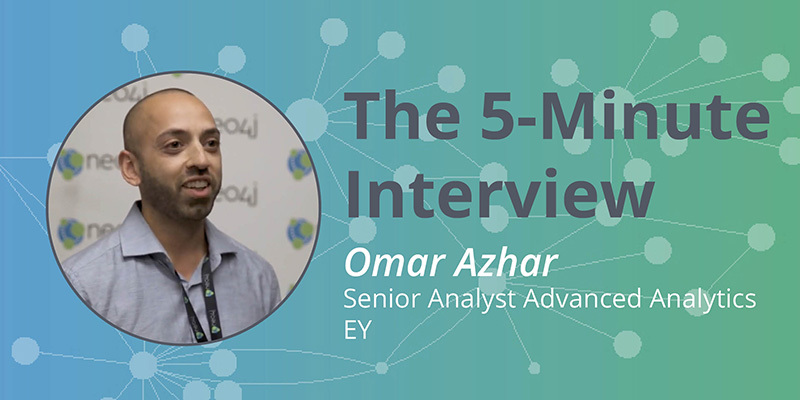
Answering the Money Question: The 5-Minute Interview with Omar Azhar, Senior Manager Advanced Analytics at EY

Product Marketing Manager, Neo4j
4 min read

“For a lot of our clients, being able to visualize their data is huge because they’ve never been able to do that,”
said Omar Azhar, Senior Manager Advanced Analytics at Ernst & Young .
Ernst & Young has brought graph technology into the financial services realm, from back-end IT all the way to prospecting, recommendation engines and customer segmentation.
In this week’s five-minute interview (conducted at GraphTour NYC 2019) Omar Azhar, Senior Manager Advanced Analytics at EY, talks about using graph with financial services, and the positive responses EY’s clients give him when they are finally able to visualize their data.
What do you use Neo4j for?
With Neo4j I work on a variety of different use cases across financial services. I mostly focus on finding graph-type problems that are predominant across financial services. All the way from back-end IT and data lineage-type use cases, to the business in terms of prospecting, recommendation engines, customer segmentation.
And recently, we’ve come up with some additional ideas in the area of trade routes to know when, potentially, countries or vessels might be acting against potential trade embargoes. We do this by following the shipping patterns.
What is your favorite part of working with graphs?
This goes back quite a bit. In college, I took some graph theory courses as a math major, and never thought I would ever use it. And now, all of a sudden, it’s predominantly what I do. My favorite part is the fact that, within this data structure, there are all these mathematical concepts built in, and I can take advantage of that. I can do what would require a lot of linear algebra, in, say, Spark or Python, and I don’t need to do any of that, because the structure inherently builds it in.
What is the favorite use case for Neo4j in financial services?
It depends on who you ask. For a lot of our clients, just being able to visualize their data is huge, because they’ve never been able to do that. If you go to a CFO and say, I can help you visualize your entire data supply chain so you know exactly where the data for each of your line items is coming from, they’ve never had that capability before, until you put it into a graph, and you put nice BI and visualization in front of it.
For AI folks or technology folks, I tell them, I can tell you which system or application is the most critical for your infrastructure. They have not had a way to answer that kind of question. I could go to someone in commercial banking or wholesale banking, and tell them, I can show you what your exposure might be to a certain event in the world, even if you have zero direct exposure to that particular company, that country, et cetera. So the implementation is based on who you ask, but you can get the money question for them.
What is the biggest selling point of graph technology?
If you asked that question maybe four years ago, essentially, no one knew what graphs were, and they would look at you and say, we just went through a huge data lake implementation, I don’t want to talk about additional technologies. Now, all of a sudden, the conversation has started because people are beginning to realize that the problem that they have is actually a graph problem.
What we find very successful in talking to executives is to come in with an actual demo. It’ll be a very quick MVP, nothing shiny or anything, but it gets the thought processes going.

We also do a white-boarding session with mock data models. We’ll say, here are your customers, and here’s how they’re all related, here’s how we bring in all your additional data sets. But I think, in this day and age, a lot of our customers are realizing that they have a graph problem, and so they come to us. And if you really target the questions that they just can’t answer right now, even if they put their best engineers on the job, that’s where it really resonates.
What does the future hold for graph technology?
The main reason I got into graphs was for the machine learning aspect. But I think, right now, as more and more clients realize they have a graph problem, if you look at the data science scale that you have, everyone is still very much on the querying end of the spectrum. Folks have barely even started thinking of graph embeddings or graph convolutional networks. But we’ve already been experimenting with that quite a bit, so I’m very excited to take all the different types of networks that we can build and do hardcore, graph-based machine learning on them.
Here’s a good example. If I were to start mapping trade networks or any sort of transaction network, instead of just using purely graph-based metrics reduction, I could actually train neural networks to understand the changing behavior or the structure of a graph and start bringing in things like topology and a lot more network science. I think that’s the next area for graphs, especially in the machine learning area. All that math has been solved, and now we’re finally getting the data infrastructure and IT infrastructure to start implementing that at large scale.
Want to share about your Neo4j project in a future 5-Minute Interview? Drop us a line at content@neo4j.com
Show off your graph database skills to the community and employers with the official Neo4j Certification. Click below to get started and you could be done in less than an hour.


