How graph and AI take us from dashboards to continuous decisions

RVP, Federal Sales, Neo4j
5 min read

The true nature of analysis in government is simple. Ask a question of the data. Learn from the answer. And then ask a new question. Curiosity drives the process, and every answer should naturally lead to a deeper question.
I call the uninterrupted state of analytical thinking the analytic continuum. It describes the mental clarity trained analysts experience when they engage data without limits or delays. In this state, analysts move seamlessly from one level of questioning to the next without becoming distracted from their inquiries.
Asking questions helps leaders see problems from new angles and uncover perspectives they might not otherwise gain. The process of inquiry can be energizing, but interruptions can quickly break that momentum and the inspiration that comes with it.
Deep thinking is fragile
Maintaining complex problem solving is harder than it sounds. People are not naturally wired for prolonged reasoning. In fact, behavioral science shows deep thinking is easily disrupted.
In his seminal book, “Thinking Fast and Slow,” Daniel Kahneman, describes two modes of thinking that guide decision-making. One mode is fast and automatic, relying on instinct and familiar patterns. More complex decisions, however, require slower, more deliberate thought.
The work of government analysts lives almost entirely in deliberate thought, but Kahneman describes this mode as inherently fragile because it requires sustained attention and mental energy. It operates under a “law of least effort,” meaning the brain naturally seeks to minimize cognitive strain and will default back to quick, intuitive thinking whenever possible.
Technology has been distracting analytic flow
For decades, analysts have faced a frustrating barrier—delays, disconnected data, and systems that interrupt flow. When that happens, inspiration fades with valuable insights left unexplored.
I have been in the data warehousing world since the early 1990’s. Some of the most rewarding work I’ve done has been helping government solve complex data challenges. Yet something always bothered me. Even when data problems were successfully solved, the full promise of analytics still felt out of reach.
The issue wasn’t the analysts. It was the technology. The promise was to reduce the gap between event, insight, and action. In reality, technology created and reinforced the gap.
Business intelligence systems forced analysts into rigid workflows. Data lived in silos, and queries required complex joins across tables. Each new question meant writing more code, waiting for results, and reconstructing relationships that were stripped apart when the data was forced into rows and columns. The result was constant interruption by unintentional design.
How Graph changes the game
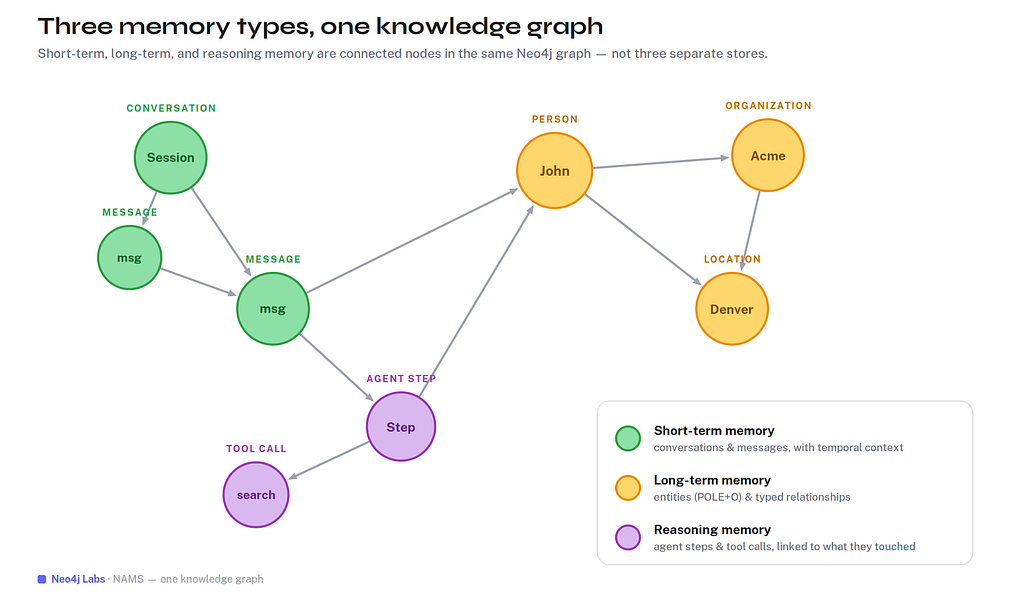
Graph looks at data differently. Graphs model entities and relationships (people, devices, accounts, locations, events) so each new signal lands in a living network giving instant “who/what/when/where/how” connected context. This allows agencies to explore how decisions ripple across services, systems, and stakeholders.
The result is a more complete view of mission outcomes. Analysts may trace issues across multiple programs, identify risks early, and see how changes in one part of a program impact results. Rather than stitching together insights from disconnected tools, analysts navigate an agency’s entire program landscape through a single, connected framework.
Confidence in the age of AI
While AI makes it easier for leaders to ask questions of data and receive answers in seconds, hallucinations pose significant risks. These responses sound confident but may include errors or fabricated details that jeopardize decisions impacting public safety, national security, and billions of dollars in public funding.
Most AI models generate answers based on patterns in language rather than verifying facts directly against trusted data.Knowledge and context graphs solve this problem by allowing AI to reason over relationship patterns—paths, communities, temporal changes—enabling deeper analysis in areas like fraud, cybersecurity, intelligence, and supply chain.
Graph queries retrieve precise subgraphs into the AI model, improving factuality, cutting hallucinations by large margins, and enabling deeper multi‑hop “why” explanations in milliseconds.
This elevates trust, explainability, and governance to first-class priorities. Agents and applications can answer precise operational questions, such as current inventory levels, how to best assist citizens as they navigate complex programs, or specific cybersecurity risks.
Together, knowledge graphs and AI preserve the analytic continuum. Analysts (and end users) move fluidly from one question to the next without getting interrupted or being forced to engage in more technical tasks. And, because decisions are grounded in explicit nodes, edges, and timestamps, you can trace “why” a recommendation was made by showing the path and history the AI followed—critical for regulated and mission environments
Graph in action
Agencies already use graph to transform their programs. Intelligence and defense agencies use graph to uncover hidden networks within massive datasets—identifying threat actors, illicit financial flows, and operational patterns. Cybersecurity teams model network dependencies to understand vulnerabilities and attack paths. Logistics organizations create digital twins to analyze risk and optimize global operations.
Graphs allow technology to become a partner in reasoning—providing accurate context, surfacing relevant connections, and enabling analysts to stay engaged in the deep thinking required to solve complex government challenges.
With graph-aware, agentic AI solutions—that deliver human in-the-loop decisions—agencies have high context, low latency interactions. The analytic continuum.
Accelerate mission outcomes
Learn how government agencies transform siloed data into trusted insights. Our guide shares how graph modernizes legacy systems, boosts efficiencies, and surfaces threats faster.
Share Article


Explore
Related Articles
Introducing MCP for Aura: Hosted MCP, built into every Aura instance

Neo4j Named “One to Watch” in Snowflake’s 2026 Modern Marketing Data Stack Report