Fraud rings hide in the connections: Graph-Enriched Detection for Databricks Genie with Neo4j

Global Cloud Partnership Director
6 min read

INTERPOL’s 2026 Global Financial Fraud Threat Assessment puts global fraud losses at $442 billion in 2025, with financial fraud now ranked among the top five global crime threats. INTERPOL describes it as the industrialization of fraud, driven by AI and global criminal coordination. Much of that loss comes from coordinated schemes that existing analytics infrastructure is structurally unable to detect.
Fraud rings don’t announce themselves at the transaction level. Each payment in a coordinated scheme is small enough to look routine, each account ordinary enough to pass standard checks, each merchant relationship plausible enough to stay under the threshold that would trigger a rule. The pattern that makes a ring visible exists across dozens of accounts moving money tightly among themselves, concentrating at specific merchants, maintaining a structure that only becomes clear when you look at the connections rather than the rows. Financial crime is a network problem, and most financial analytics infrastructure is built to solve row problems.
Coordinated fraud schemes continue to evade detection even at institutions with sophisticated analytics stacks because the data that would expose a ring is stored in a format that renders it invisible.
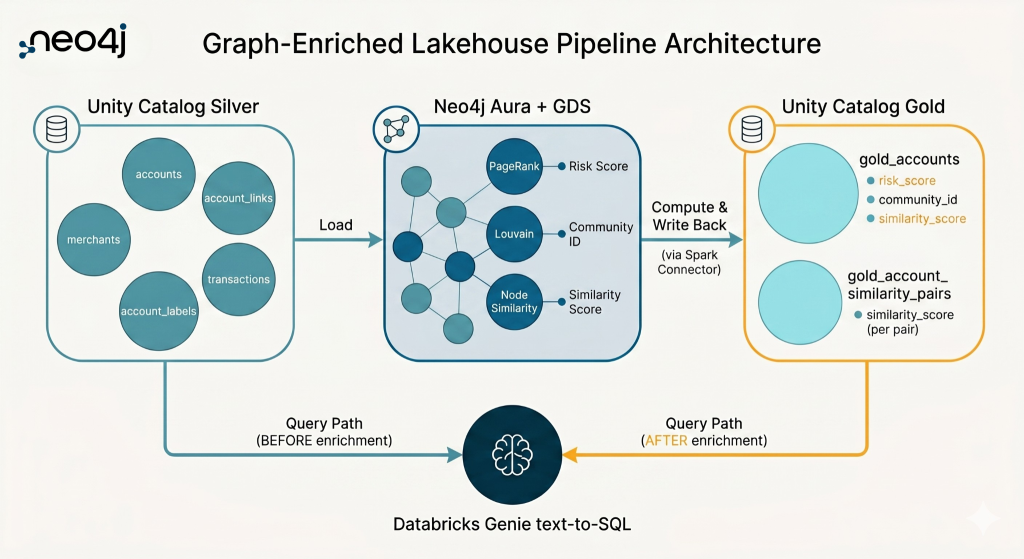
A graph-enriched Lakehouse uses Neo4j Graph Data Science to compute the network signals fraud teams need, then writes those signals back into Databricks as governed Gold tables that Genie can query directly.
Where row-level analytics isn’t enough
Databricks Genie is a genuinely capable tool for financial analysis. It translates natural language into SQL, runs it against your Delta tables, and returns accurate results fast. For the questions your Silver tables can answer, it performs well: account balances, transfer volumes, merchant activity, cohort comparisons, and regional breakdowns. These are real analytical questions with real business value, and Genie handles them cleanly.
The problem appears when analysts push into network questions. Which accounts are acting as hubs in the transfer network? Which groups are moving money densely among themselves? Which accounts share behavioral patterns even without transacting directly? Genie can answer the questions represented in the tables it can query. But network questions require network features: centrality, community membership, structural similarity, and shared routing patterns. By computing those signals in Neo4j and writing them back to Gold tables, teams make graph context available to Genie through the same Lakehouse interface analysts already use.
The human cost of bad signals
Without those signals, analysts fall back on proxies: transfer concentration, transaction frequency, counterparty counts. Proxies cast wide nets and catch a great deal of legitimate behavior alongside the suspicious. According to Facctum’s 2026 AML False Positive Report, false-positive rates in AML screening typically range from 85% to 95%, with compliance teams spending up to 90% of their time on alerts that never lead to a confirmed case. Investigators working through that volume burn out fast, and the coordinated schemes that actually warrant their attention stay buried.
What graph enrichment adds
The graph-enriched Lakehouse pattern adds Neo4j Graph Data Science as a silver-to-gold enrichment stage inside your existing Databricks architecture, without replacing anything or changing how analysts work. The pipeline reads your Silver tables from Unity Catalog, loads the account and merchant relationships into Neo4j Aura as a property graph, runs graph algorithms against the account-to-account transfer network and the account-to-merchant spending network, and writes the enriched results back to your Gold layer as plain Delta columns via the Neo4j Spark Connector.
The enrichment adds three types of network signals:
- Centrality shows which accounts occupy influential positions in the flow of money, even if their transaction volume is not unusually high.
- Community membership groups accounts that move money densely among themselves, revealing clusters that may indicate coordinated behavior.
- Structural similarity identifies accounts that behave alike by routing through the same counterparties or merchants, even if they never transact directly.
| Without graph enrichment | With graph enrichment | |
| Analyst question | Which accounts have the highest transaction volume? | Which accounts have the highest centrality in the transfer network? |
| Genie queries against | Silver tables: transaction amounts, account attributes | Gold tables: risk_score, community_id, similarity_score |
| Question class | Volume-based: who spent the most | Structure-based: who sits at the hub of money movement |
| Result | A ranked list of high spenders, most of them legitimate | A structurally defined candidate population sized for investigation |
The graph work happens upstream in the enrichment stage. By the time Genie touches the data, it is just columns.
What this makes possible
With graph enrichment, fraud teams can move beyond volume-based proxies and investigate structurally defined risk:
- Better candidate populations
Analysts can prioritize accounts based on network position, community behavior, and similarity patterns rather than transaction volume alone. - Lower noise for investigators
Graph signals help narrow review queues so teams spend less time on obvious false positives and more time on coordinated activity that warrants investigation. - More defensible alerts
Scores such as centrality, community, and similarity are reproducible, explainable, and grounded in published graph algorithms. - No change to analyst workflow
Graph enrichment happens upstream. Analysts continue using Databricks Genie and Gold tables, but with new network-aware features available as ordinary columns.
What analysts can do now
The question class available to Genie expands after enrichment. Analysts can size candidate populations by community and risk tier, compare behavior across structural cohorts, examine which merchants serve disproportionate concentrations of high-centrality accounts, and build regional review queues based on structurally defined populations rather than volume proxies. These questions have direct investigative value. Before enrichment, the dimensions they require simply do not exist in the catalog.
A high-risk community is a population worth examining, and the analyst queries the enriched Gold tables to decide which accounts and merchants actually warrant investigator time. That division of labor is also what makes the approach defensible under regulatory review. Each column has a published mathematical definition. The same graph projection produces the same scores every run. When model risk management asks how a candidate was surfaced, the answer is specific, reproducible, and grounded in established algorithms with published definitions, giving investigators signals they can explain and defend when an alert becomes part of a case review or regulatory process.
Try it
The Finance Genie demo is open source and runs on synthetic data, so teams can evaluate the graph-enriched Lakehouse pattern without data handling concerns. The repo includes the enrichment pipeline, a workshop notebook that shows the before-and-after Genie experience, and an MCP-backed agent path for teams that want live graph evidence routed through a Databricks Supervisor Agent.
Share Article


Explore
Related Articles
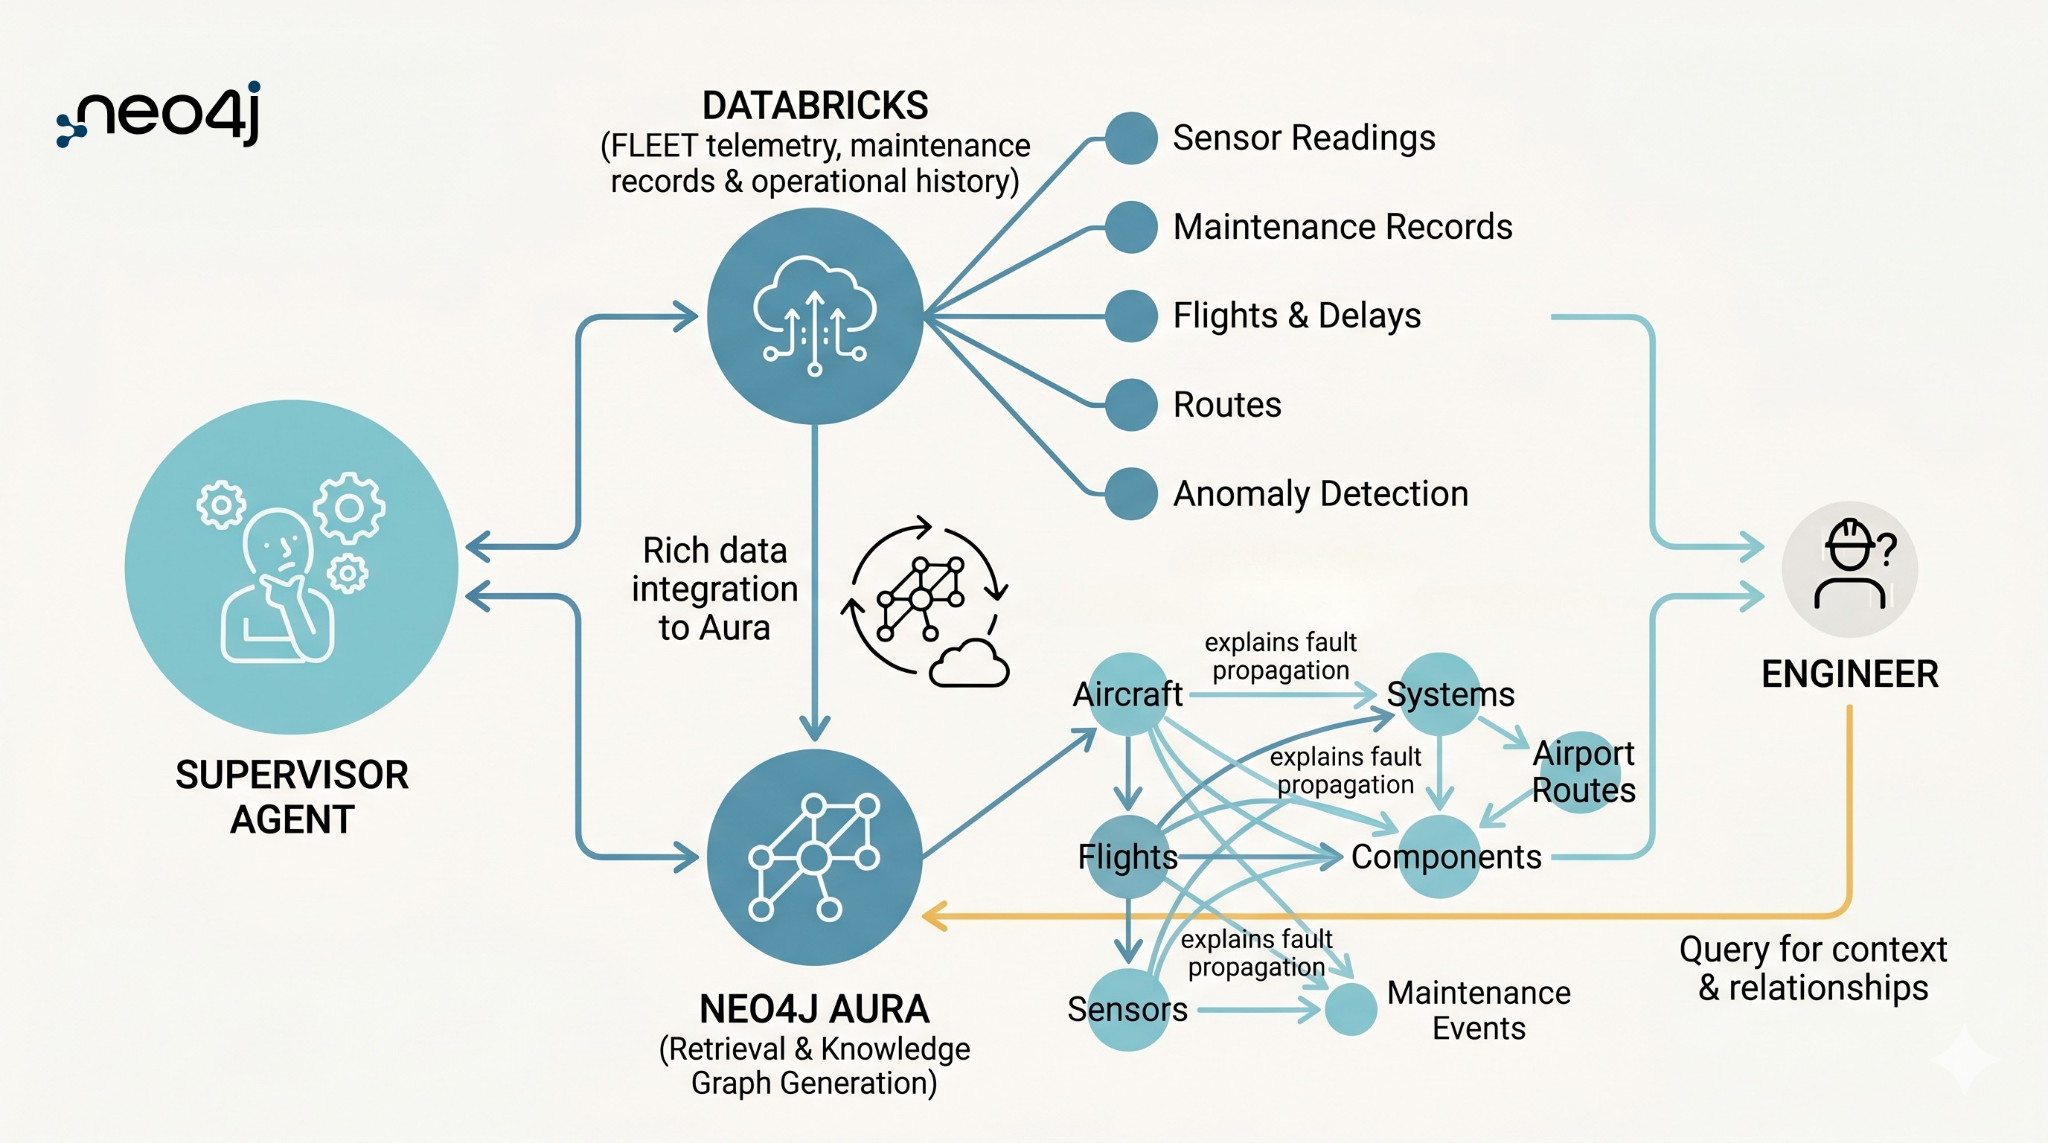
Digital twins that learn: connected asset intelligence with Neo4j and Databricks
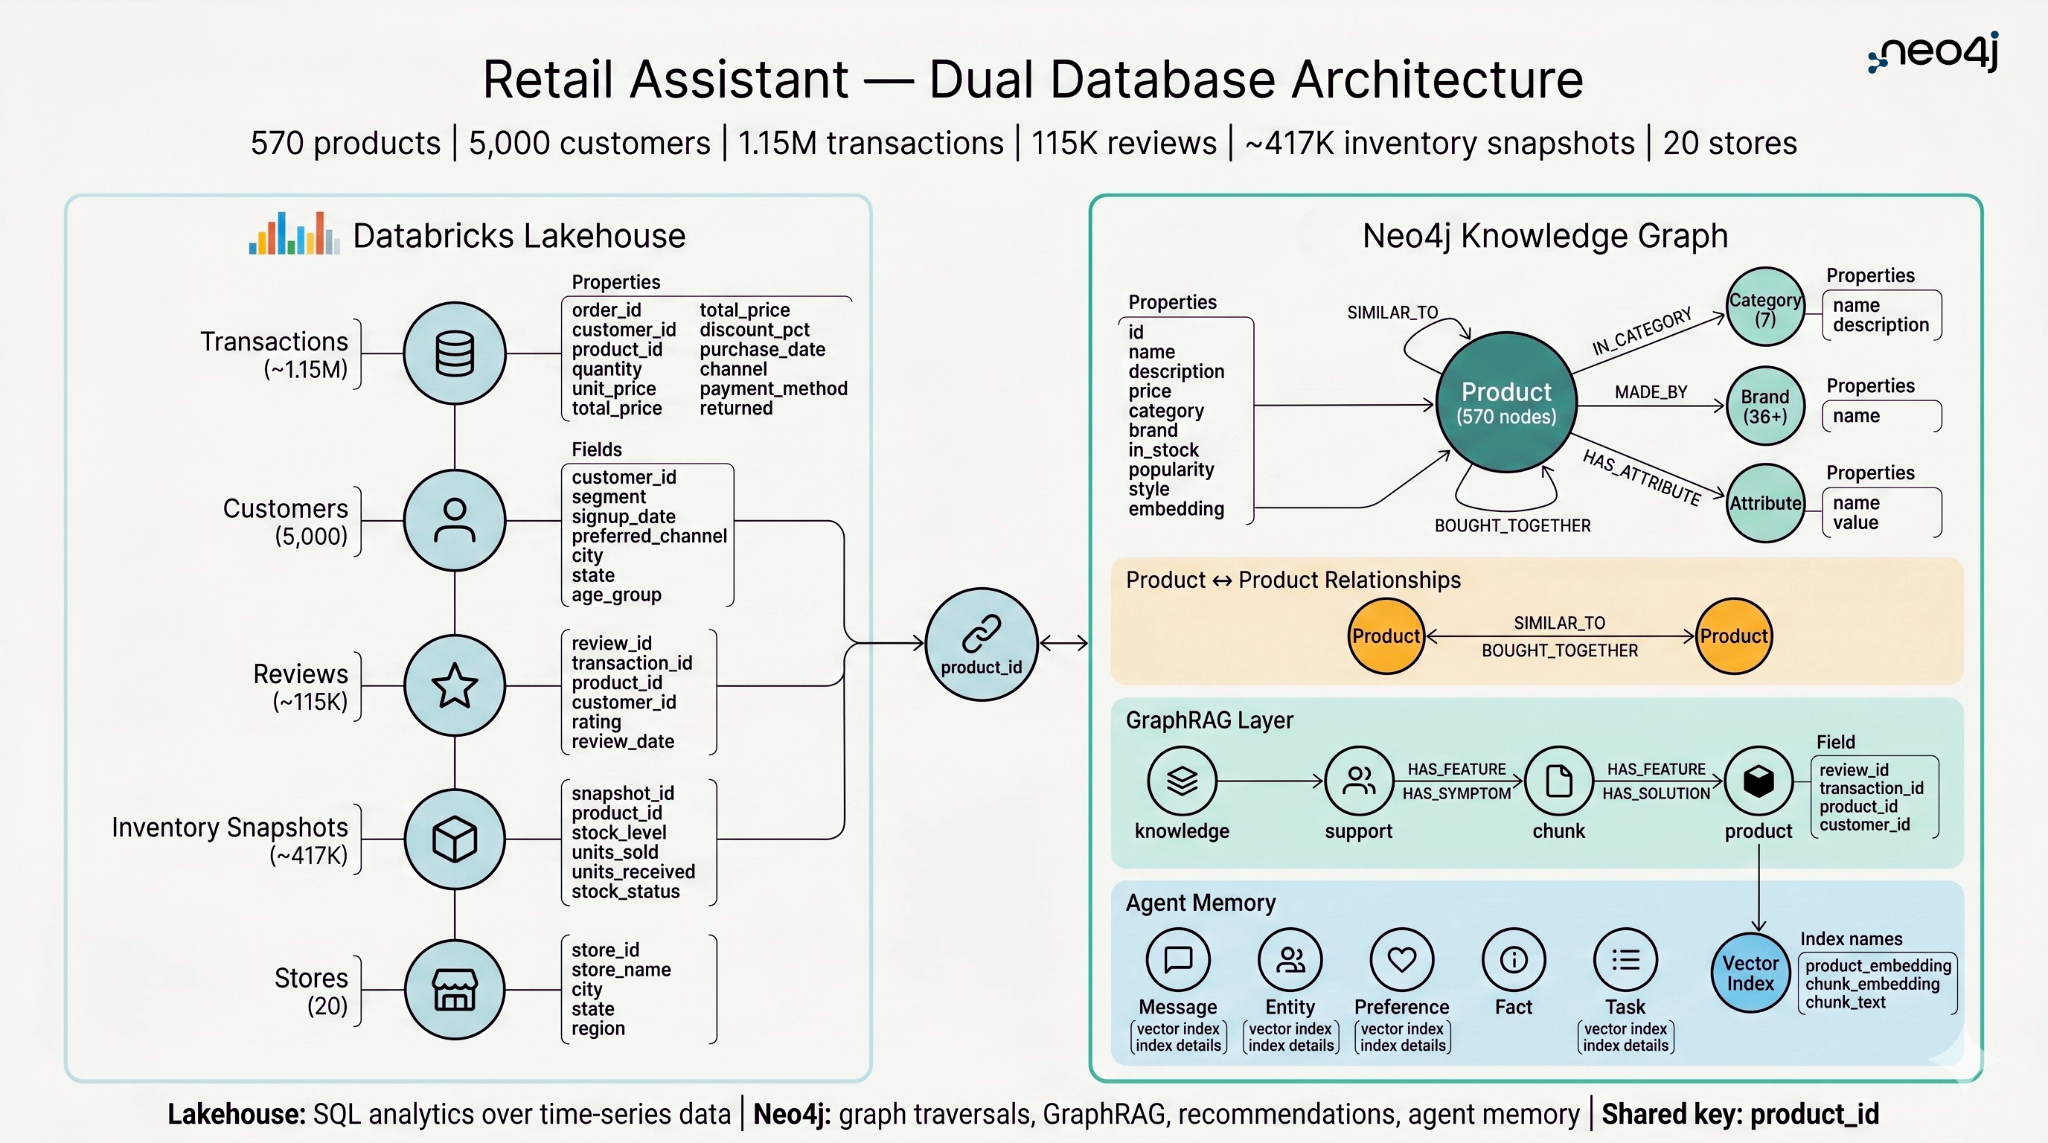
Building retail assistants customers can trust with Databricks and Neo4j
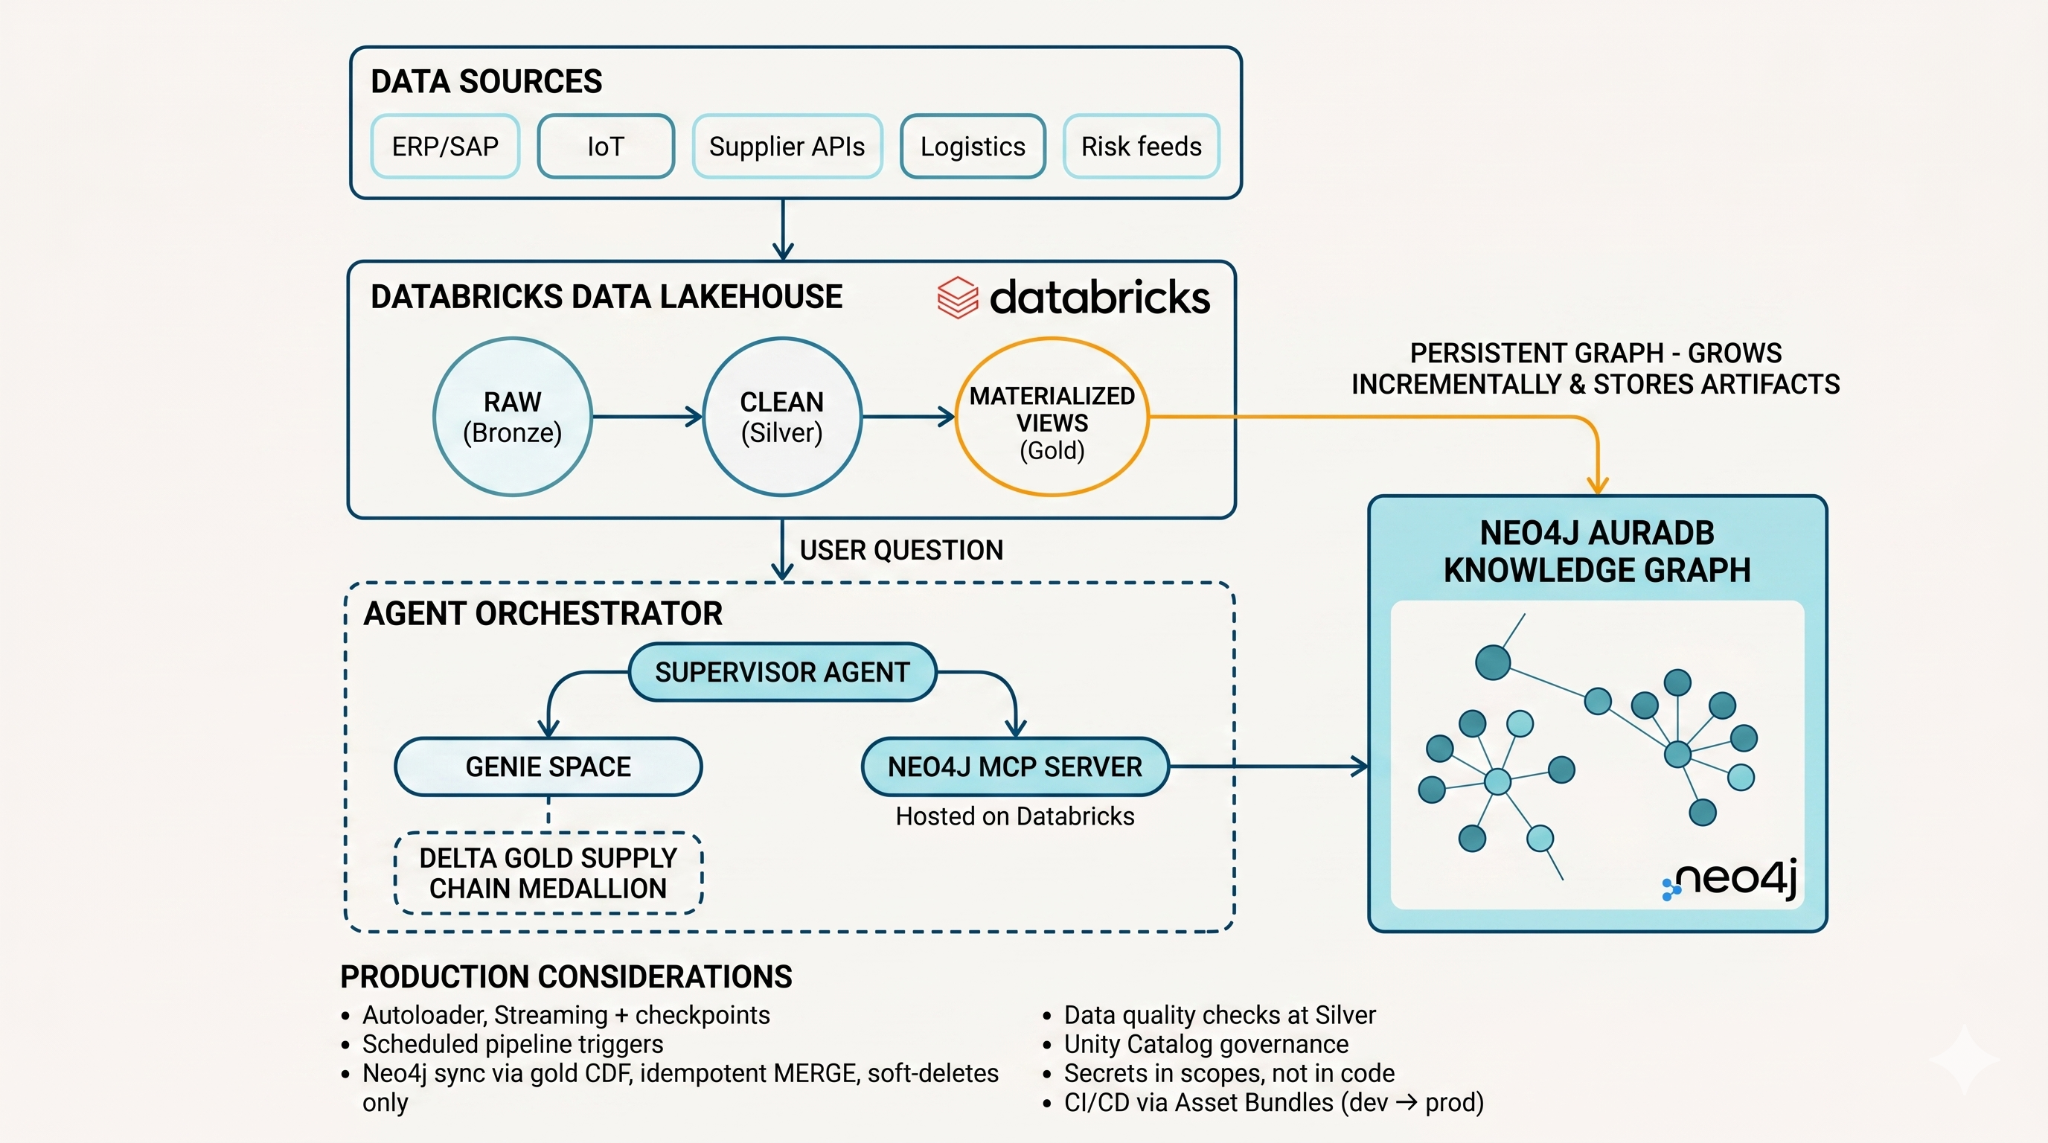
Supply chains don’t fail at the node. They fail at the connection.


Introducing Document Intelligence: From documents to a knowledge graph, right inside Aura