
This Week in Neo4j – Bloom 1.2.0 Released, Knowledge Graphs in Action, Food Allergen Graph

Developer Relations Engineer
4 min read
Hi graph gang,
GraphTour 2020 gets underway this week with the first stop in Amsterdam on 4th February 2020.
There’ll be someone from the Developer Relations team at most of the events, so don’t forget to come and say hi.
On 7th February 2020, O’Reilly Graph Algorithms Book author Amy Hodler will be presenting a webinar titled 10 Tips for Responsible AI – How Graph Technology Adds Context, so don’t forget to reserve your spot for that.
And Karin Wolok announced Global Graph Celebration Day, which occurs on April 15th 2020. If you want to host an event, don’t forget to read the blog post for more details.
Alright, enough of the announcements, and onto the content.
For this week’s video we have a Christophe Willemsen’s Graph Tour Mexico City talk about Knowledge Graphs and GraphAware Hume.
Neo4j Bloom 1.2.0 was released, Will Lyon build a local business search app using GraphQL and Neo4j AuraDB, and
And finally, I created a QuickGraph of Itsu’s food allergens.
Enjoy!
Featured Community Member: Anthony Chiboucas
This week’s featured Neo4j Community member is Anthony Chiboucas, CMS Developer at Downstream.
Anthony Chiboucas – This Week’s Featured Community Member
Tony initially connected with us through the Neo4j Ninja program.
He works with an interesting company that blends real world and digital experiences.
Tony has a graphy-y project he’s currently working on (a public, open-source graph and API from a federated database of several museum archives) that he was interested in sharing with the global community.
He’ll be presenting that in a couple weeks at the Neo4j Online Meetup, so keep a lookout!
Tony is one of those pretty rare community members that got into the community and jumped in full steam ahead. It’s like he’s been waiting for the right opportunities to get involved and finally found them (or maybe just fell into the graph epiphany at the right time!) 😀
He’s a nice guy and we highly suggest you stop and say hello!
Thanks, Tony, for being so awesome and passionate about giving back to the community. We’re grateful to have you!
GraphTour: Knowledge Graphs in Action
This week’s video is from GraphTour Mexico City, where Christophe Willemsen presented on knowledge graphs and the Hume platform.
In the talk Christophe shows how to build a graph from the entities extracted from unstructured data, and these uses graph visualisations to discover new insights into the data.
Neo4j Bloom 1.2.0 Released
Neo4j Bloom, the breakthrough graph visualization, exploration and communication tool, released version 1.2.0 this week. This release adds some cool features, including:
- new expandable legend with ability to configure style of nodes and relationships directly from the canvas
- Selective expansion – expand only some neighbors of a node based on relationship type, category or a mix of both
-
advanced styling – users can now:
- choose from a full spectrum of colors
- configure both color and size of nodes and relationships
-
style nodes and relationships using powerful data-driven rules based on property values, value ranges, wildcard matches, and existence of labels or property keys
And more!
The new version will be automatically picked up by the Neo4j Desktop, but can also be downloaded from the download centre. An updated user guide is also available.
Exporting data, Query Performance, Threat and Malware Graph
- I wrote a blog post showing how to get data from one Neo4j database to another one using the export JSON procedure.
- Kees Vegter released new versions of Neo4j Query Log Analyzer and DB Analyzer, which now have support for multi databases, a feature added in the latest version of Neo4j.
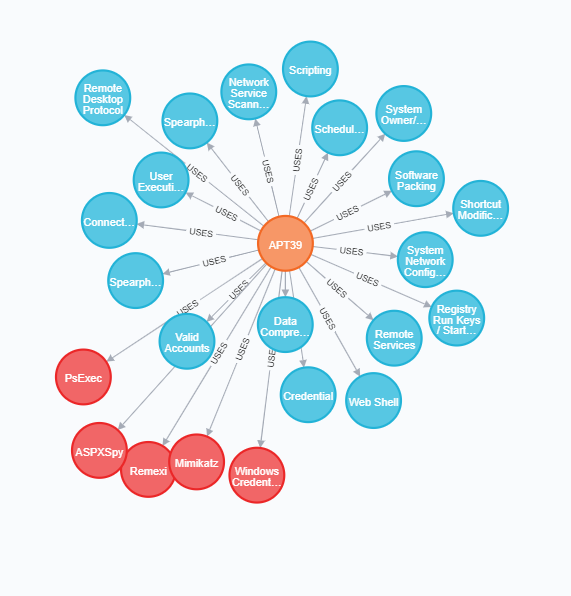
- Krishna published ATTACK-Threat_Intel, a graph Representation of MITRE ATT&CK’s CTI data
- I wrote a blog post showing how to perform a database dump within a Docker container
- Michael Hunger was interviewed on the latest episode of A Bootiful Podcast.
- Max De Marzi shares some of his favourite modelling tips and tricks to reduce the amount of time a query takes from just over 9 seconds to just 1 millisecond.
- Ramon Ramentol gives us a sneak peak of XRPLORER, a XRPL data analytics and forensics platform.
Working With Spatial Data In Neo4j GraphQL In The Cloud
Will Lyon has written a blog post in which he shows how to build a GraphQL API to find local businesses with help from neo4j-graphql.js, Neo4j AuraDB, and Zeit Now.
Will starts with examples of creating and querying spatial data in Neo4j, before using neo4j-graphql.js’s inferSchema function to derive a GraphQL schema from the contents of the database. We then use the GraphQL playground to query the dataset.
QuickGraph: Itsu Allergens
In a QuickGraph from December, we create a graph of allergen data for Itsu, a British chain of East Asian-inspired fast food shops and restaurants.
We find the most prevalent allergens, the ones that appear together, before trying to find something that I can eat in the restaurant given my list of allergies.
Tweet of the Week
My favourite tweet this week was by Joris Aarts:
#neo4j helps to study the brain https://t.co/DuzY9mTlTb
— Joris Aarts (@JorisAarts) January 28, 2020
Share Article


Explore
Related Articles

This Week in Neo4j: GraphRAG, GraphAcademy, Knowledge Graphs, Symfony and more

This Week in Neo4j: Certification, Developer Tools, GraphRAG, Knowledge Graphs and more

This Week in Neo4j: Certification, Graph Analytics, Agentic AI, Knowledge Graph and more


