Graph Visualization Democratizes Your Connected Data
The Neo4j graph database unlocks value from your data relationships – and graph data visualization unlocks the accessibility and human understanding of your connected dataset.
Neo4j Bloom helps traditional Neo4j users communicate with their non-technical peers and executives in a simple manner. Bloom reveals and explains the concepts of data connectedness for people who may not naturally think that way.
Neo4j Bloom gives users the ability to:
- Inspect the animated graph by panning and zooming across the visible domain
- Select a node and toggle to understand properties and adjacent nodes based on its relationships
- Edit nodes, relationships and properties
- Initiate queries within the search box based on suggestions and template phrases

The Neo4j Browser
 The Neo4j browser is itself a great visualization tool to help with application and database development.
However, when you need to visualize results – say for link analysis or detailed dependencies – you have a variety of powerful graph visualization tools at your fingertips.
The Neo4j browser is itself a great visualization tool to help with application and database development.
However, when you need to visualize results – say for link analysis or detailed dependencies – you have a variety of powerful graph visualization tools at your fingertips.
Graph Visualization Tools
Get More Information – Contact UsLinkurious
Linkurious Enterprise
Linkurious Enterprise is an on-premises graph visualization and analysis platform. It connects directly to Neo4j’s graph database technology and provides users with full text search, graph visualization, pattern detection and data edition capacities.
Linkurious Enterprise also allows for team-based sharing and reporting. Linkurious platform is widely used, from fraud detection to intelligence analysis – or cybersecurity. The platform is compatible with the security requirements of Fortune 500 companies and government agencies.

Keylines
KeyLines lets you visualize your Neo4j graph database, to see and understand sub-sets and dynamics of the graph. Use KeyLines’ Cypher connector code to query the underlying data in a visual way – calling new data from the database by interacting with the chart.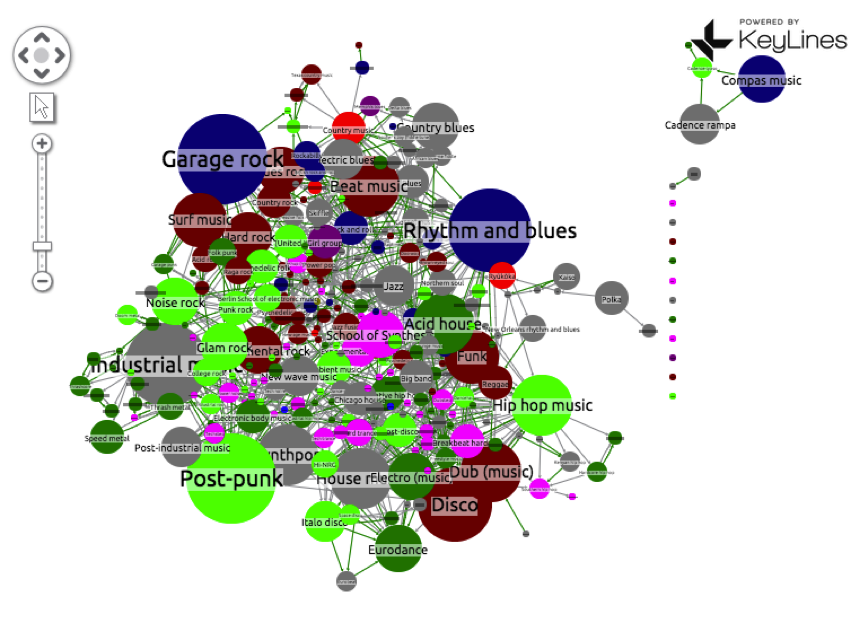 Keylines Graph-based Search
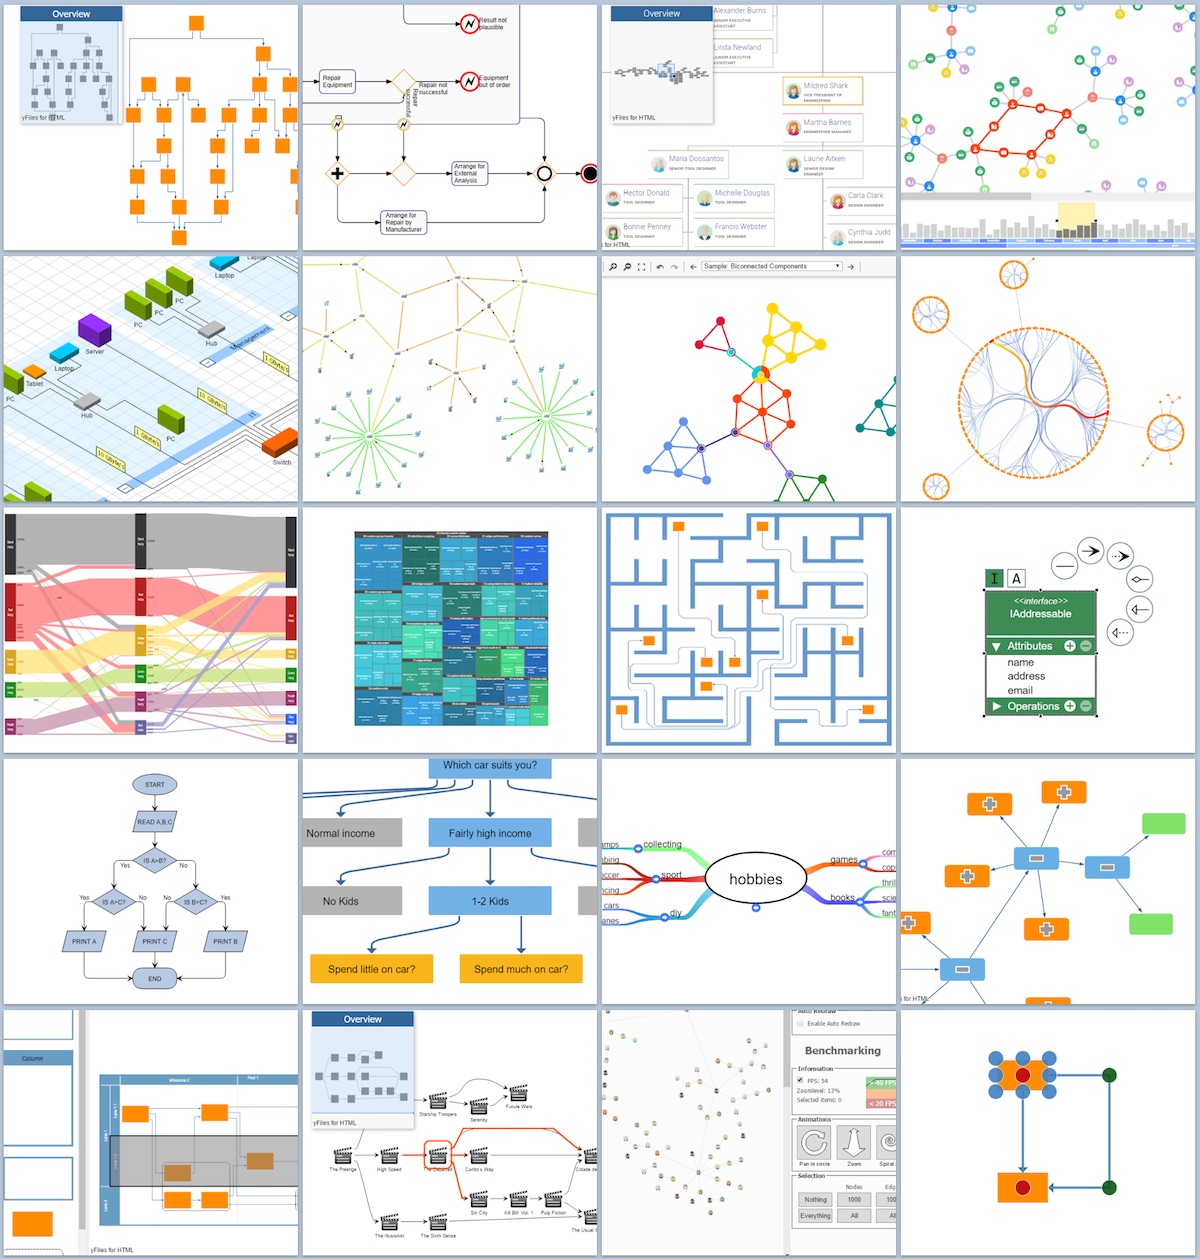
yWorks
With “yFiles”, a family of high-quality, commercial software programming libraries, yWorks provides sophisticated solutions for the visualization of graphs, diagrams, and networks. The yFiles libraries enable you to easily create sophisticated graph-based applications powered by Neo4j. They support the widest range of desktop and web technologies and layout algorithms with the highest quality and performance. With the wide-ranging extensibility and large feature set, all your visualization needs can be satisfied.- Product info: yFiles Visualization Libraries
- Article: Visualizing Neo4j Database Content Like a Pro
Tableau
The folks at Tableau made it fashionable to say of databases, “I See What you Mean!” Now, Tableau’s amazing visualization power is available for Neo4j data relationships, so “what you mean” is based on valuable data relationships.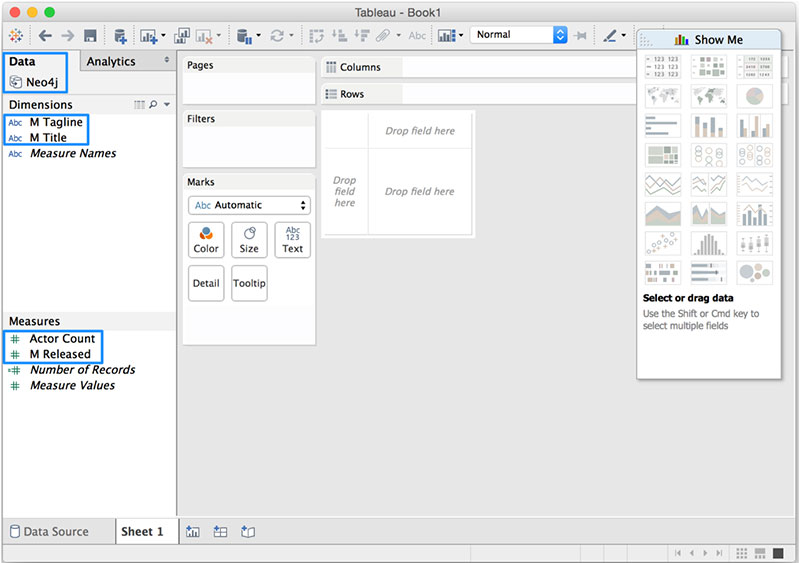
Tom Sawyer Software
Use Tom Sawyer’s Perspectives to conduct expert link analysis, network topology, models, dependencies, flows, and processes. The specialists at Tom Sawyer Software help you gain new understanding from your data relationships and increase the appeal of your applications, offering mature and market-proven products, comprehensive services, and excellent technical support.- Product info: Tom Sawyer Perspectives
- Article: The Future of Graph Visualization: An Interview with Tom Sawyer Software

Tom Sawyer Network Management
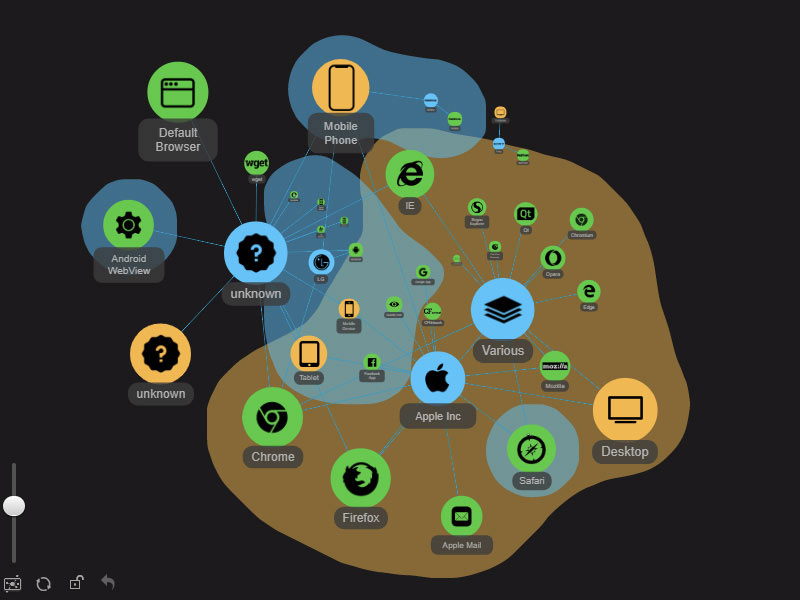
ZoomCharts
ZoomCharts provides outstandingly interactive data visualization and exploration solutions which enable end-user to explore the data directly through the visualizations with a touch. ZoomCharts was introduced in 2013 and was built specifically for big data exploration with full multi-touch support, ensuring smooth user experience across all contemporary devices. With ZoomCharts JavaScript Library you can create custom graph visualization and exploration solutions quickly and efficiently.- Product info: ZoomCharts Javascript Charts Library
- Article: Neo4j integration example Fraud Inspector
Next Step
Read the developer guide about visualizing graphs with Neo4j
Check it out →