Cybersecurity
Introduction
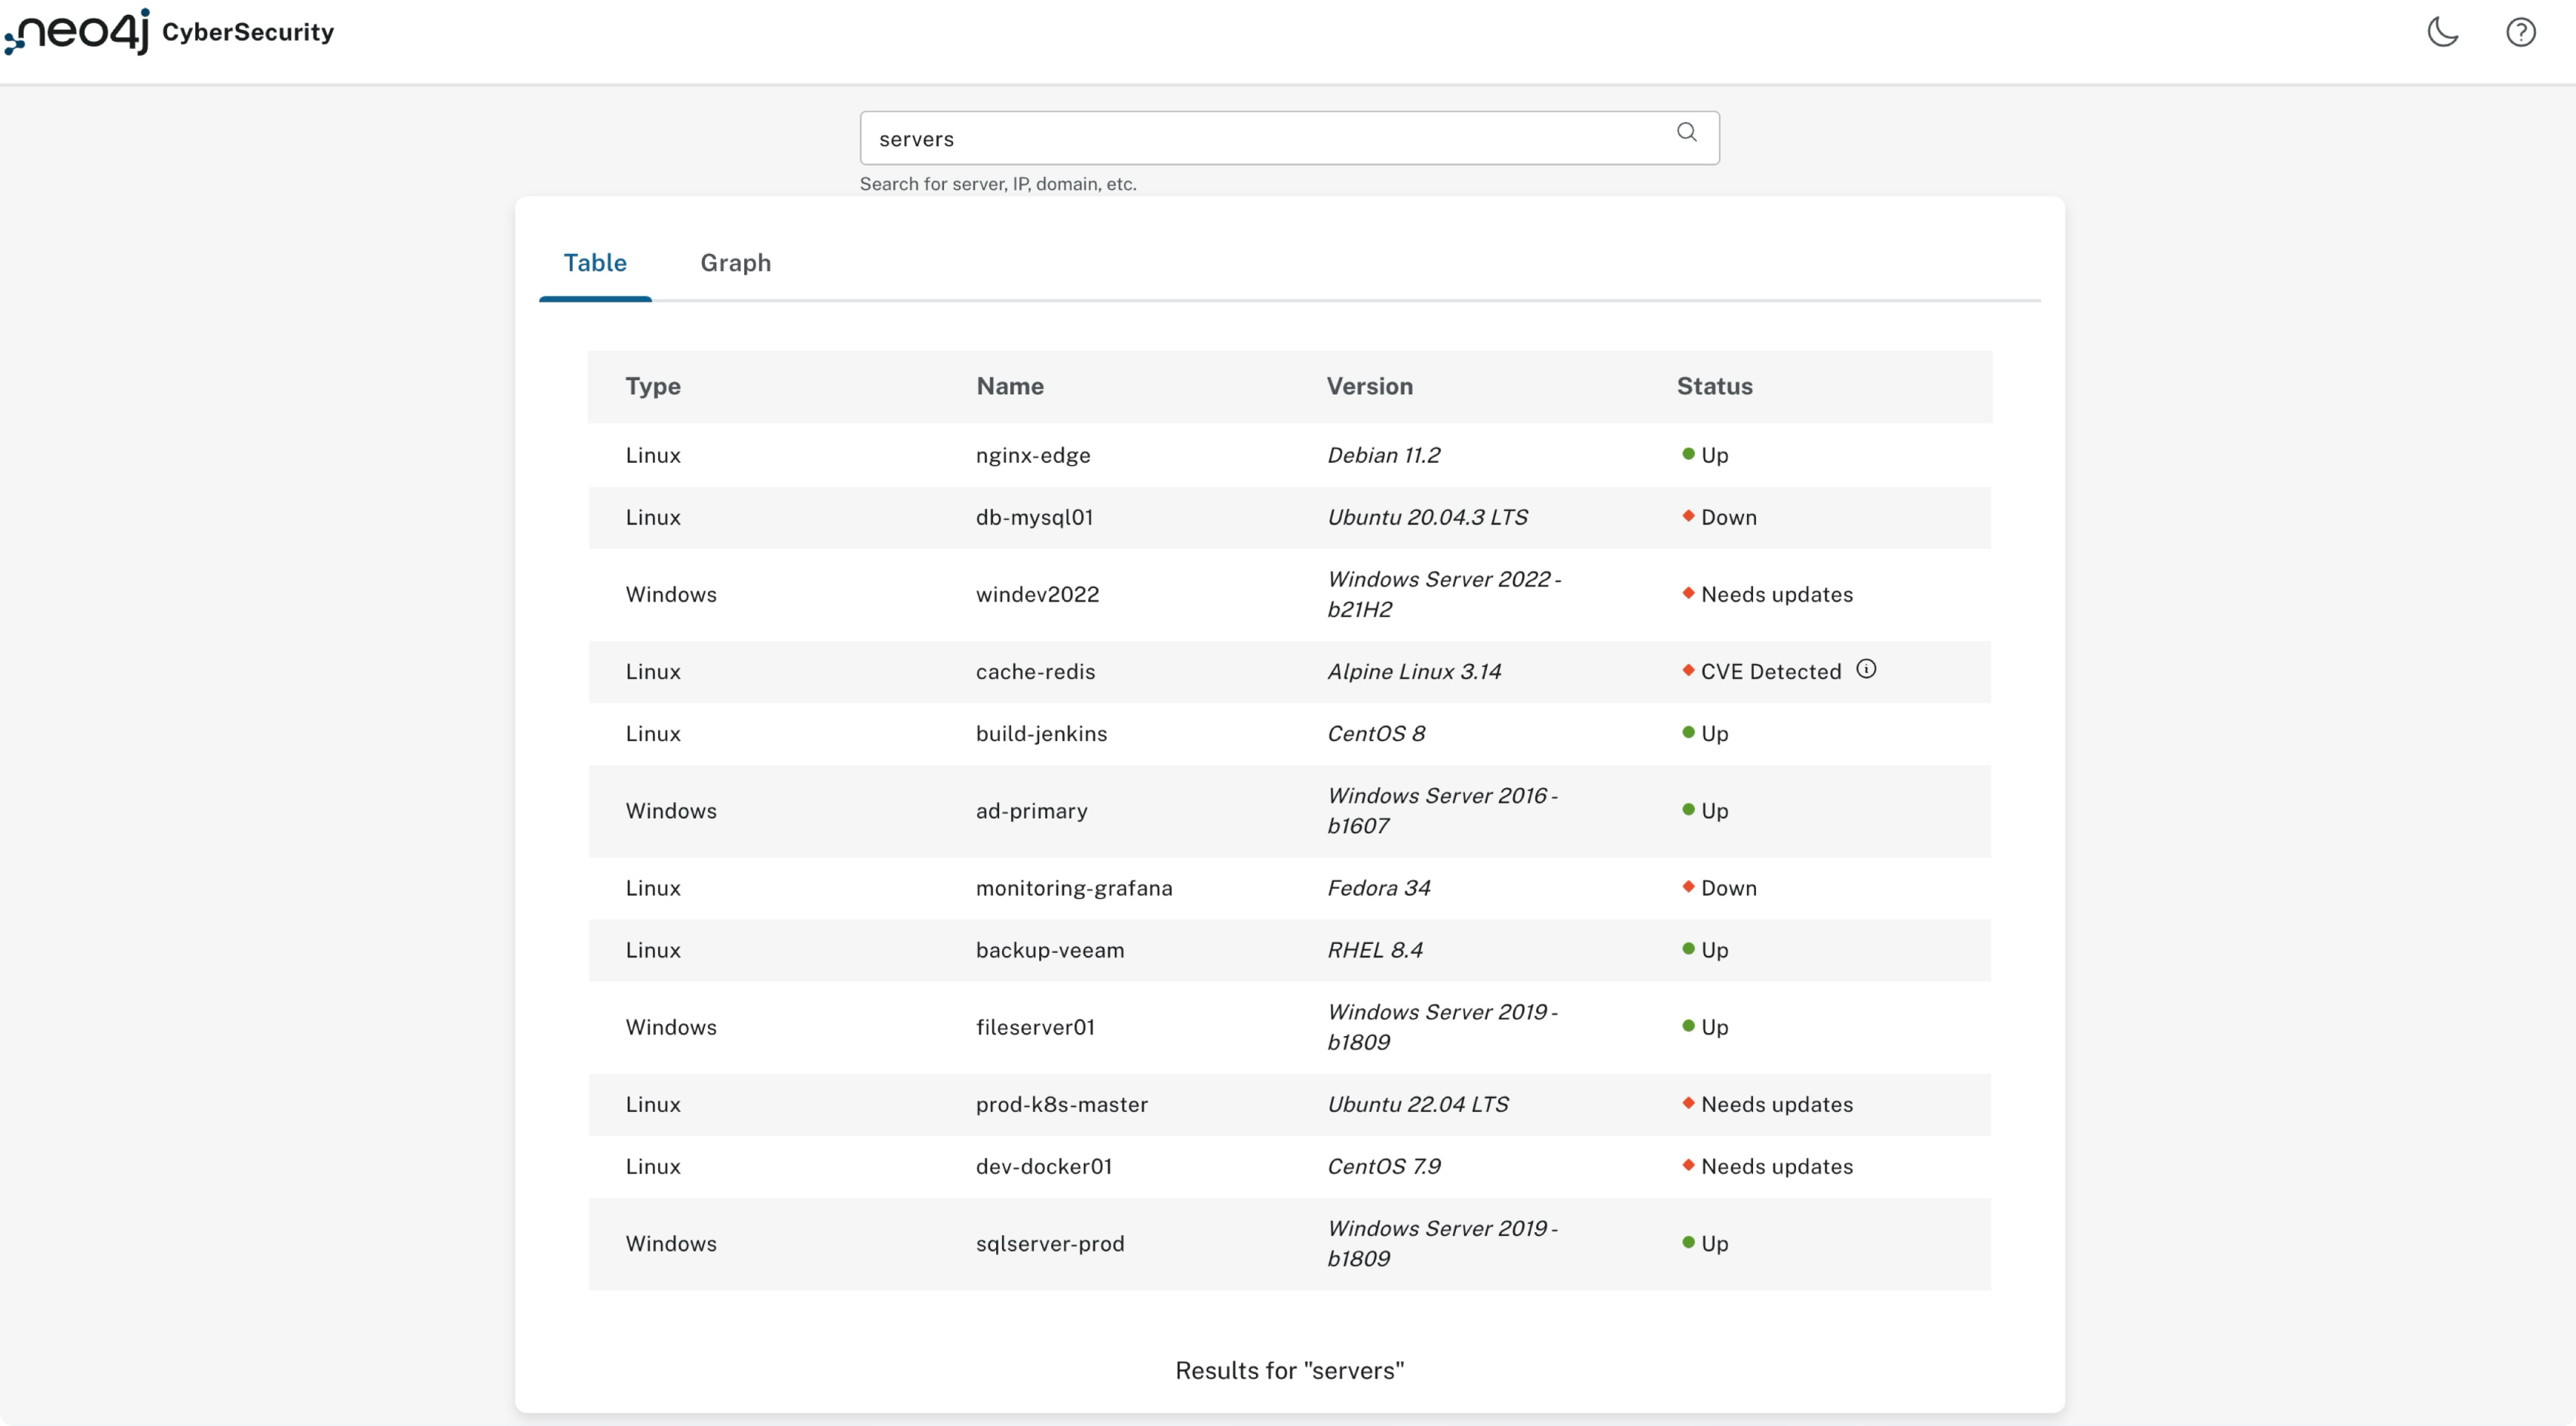
The Cybersecurity dashboard is an interface designed to provide a comprehensive overview of network impacts, illustrating potential vulnerabilities and system statuses within a network infrastructure. This tool leverages a dynamic data visualization approach, rendering interactive charts, graphs, and tables.
Documentation
Layout Architecture
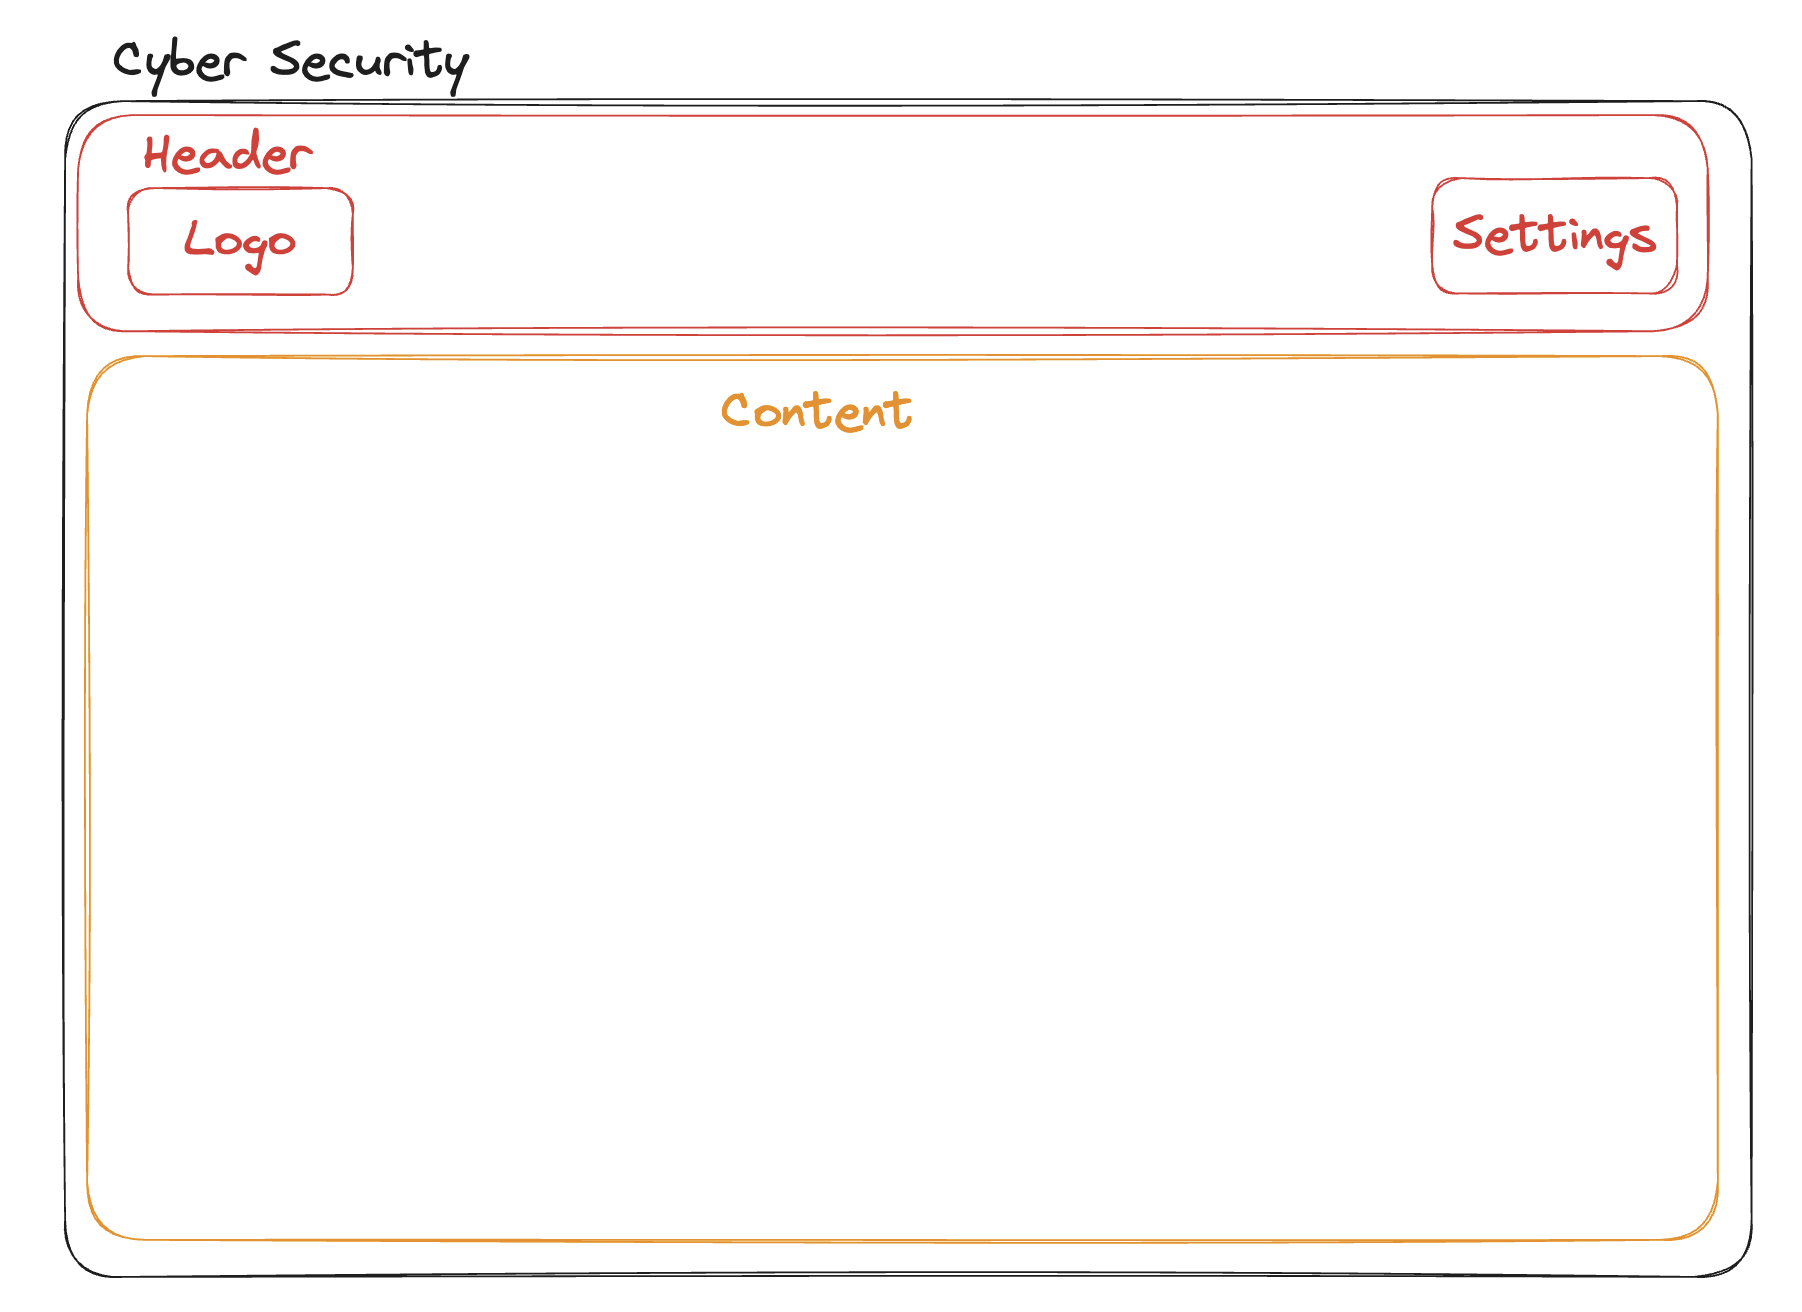
The template is structured around a main Home.tsx component that encapsulates the entire dashboard’s functionality. It includes a dynamic search bar, a tabbed interface for switching between table and graph views, and modals for establishing connections to a Neo4j database.
Code Snippets
@tanstack/react-table:const columns = [
columnHelper.accessor('Type', {
header: () => <b>Type</b>,
cell: (info) => info.getValue(),
footer: (info) => info.column.id,
}),
// Additional columns defined here...
];
const table = useReactTable({
data,
columns,
enableSorting: true,
getSortedRowModel: getSortedRowModel(),
getCoreRowModel: getCoreRowModel(),
});Dataset/Connect to a Neo4j DB
The application utilizes a static JSON dataset named networkimpact.json for demonstration purposes. It is not yet designed to connect to a Neo4j database for dynamic data retrieval. However, you can use the ConnectionModal component for connecting to a Neo4j Database and implement the logic to retrieve your data into the table in place of the static JSON this template is currently using.
<ConnectionModal
  open={isConnectionModalOpen}
  setOpenConnection={setIsConnectionModalOpen}
  setConnectionStatus={setConnectNeo4j}
/>