Line Chart
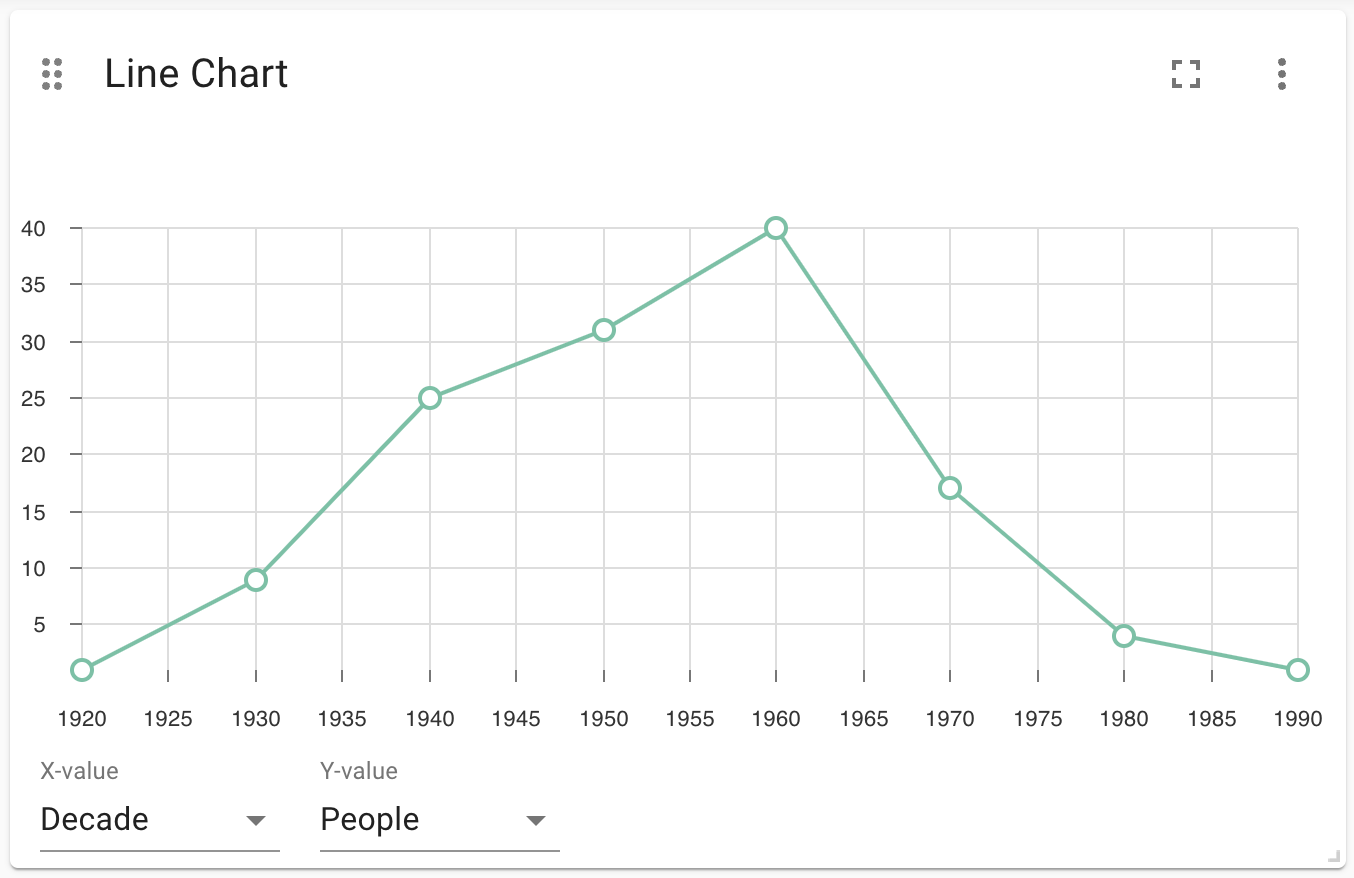
A line chart can be used to draw one or more lines in a two-dimensional plane. It requires two numeric fields:
-
X-value: a numeric field. These will be the values used as an X-coordinate.
-
Y-Value: a numeric field. These will be the values used as an Y-coordinate.
Always ensure that the X-value are sorted in ascending order. If not, the chart will not be displayed correctly.
The line chart supports plotting both simple numbers and time values on the x-axis. If you select a Neo4j datetime property on the x-axis, the chart will automatically be drawn as a time series.
Examples
Advanced Settings
| Name | Type | Default Value | Description |
|---|---|---|---|
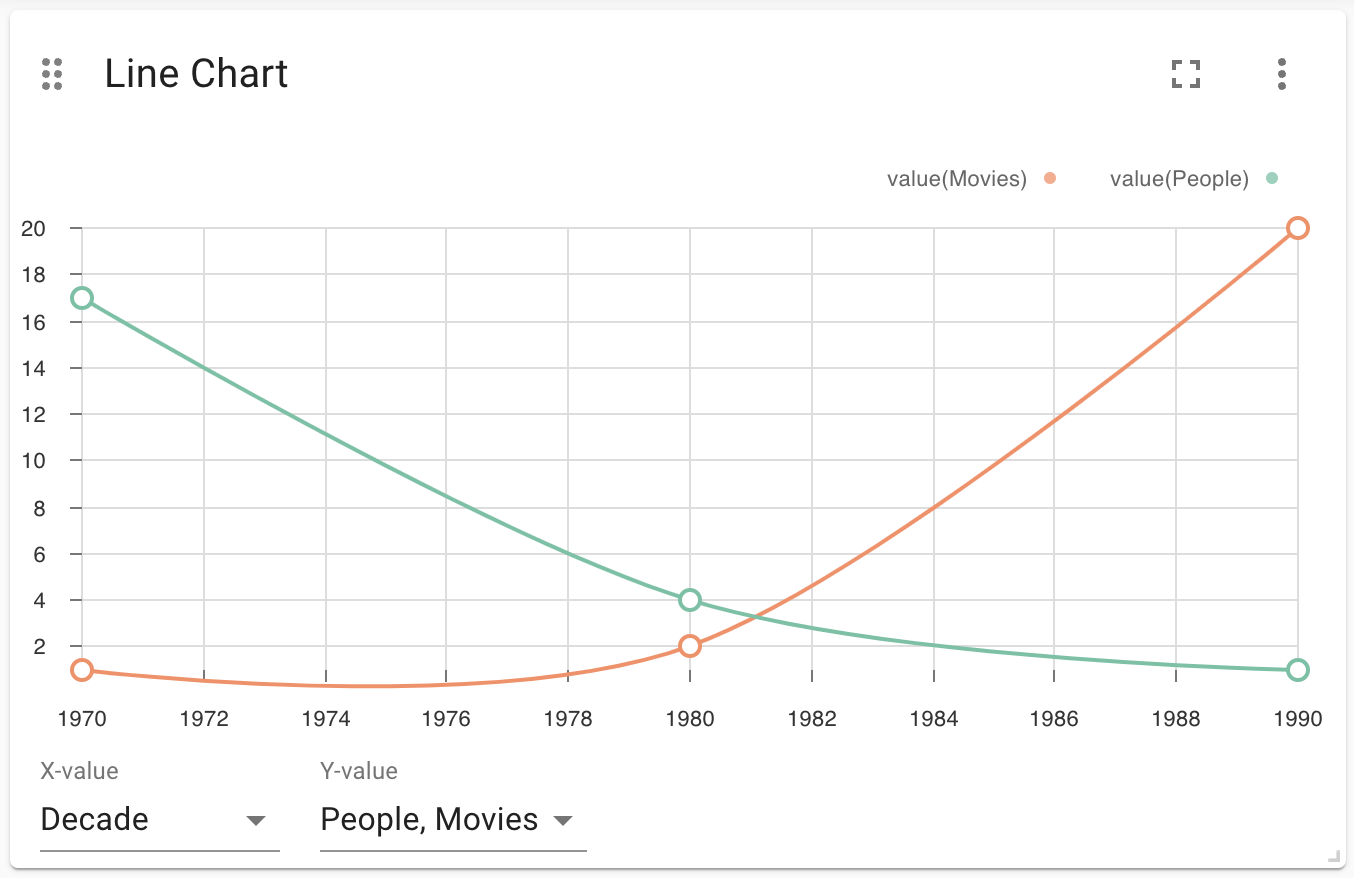
Show Legend |
on/off |
off |
If enabled, shows a legend at the top right of the visualization. |
Color Scheme |
List |
neodash |
The color scheme to use for the lines. Colors are assigned automatically to the different fields selected in the report footer. |
X Scale |
List |
linear |
How to scale the values on the x-axis. Can be either linear, logarithmic or point. Use point for categorical data. |
Y Scale |
List |
linear |
How to scale the values on the y-axis. Can be either linear or logarithmic. |
Min X Value |
Number |
auto |
If not set to ``auto'', this variable is the minimum value on the x-axis. |
Max X Value |
Number |
auto |
If not set to ``auto'', this variable is the maximum value on the x-axis. |
Min Y Value |
Number |
auto |
If not set to ``auto'', this variable is the minimum value on the y-axis. |
Max Y Value |
Number |
auto |
If not set to ``auto'', this variable is the maximum value on the y-axis. |
X-axis Tick Count |
Number |
auto |
If not set to ``auto'', the number of ticks to be made on the x-axis. This is an approximate number that the visualization tries to adhere to (numeric X-axis only) |
X-axis Format (Time chart) |
Text |
%Y-%m-%dT%H:%M:%SZ |
When using a time chart, this setting lets you override how time values are rendered on the x-axis. This uses the ISO 8601 time notations. |
X-axis Tick Size (Time chart) |
Text |
every 1 year |
When using a time
chart, this setting helps you set the frequency of ticks. The text
format should look like this:
|
Line Smoothing |
List |
linear |
Determines how the lines in the chart are smoothened. One of linear (no smoothing), basis (interpolating), cardinal (through each point) and step (step-based interpolation). |
X-axis Tick Rotation (Degrees) |
number |
0 |
The angle at which the tick labels on the x-axis are rotated. |
Y-axis Tick Rotation (Degrees) |
number |
0 |
The angle at which the tick labels on the y-axis are rotated. |
Show Grid |
on/off |
on |
If enabled, shows a grid in the line chart that intersects at the axis ticks. |
Point Radius (px) |
number |
10 |
The size of a point on each line. |
Line Width (px) |
number |
2 |
The width (in pixels) of each line in the chart. |
Margin Left (px) |
number |
50 |
The margin in pixels on the left side of the visualization. |
Margin Right (px) |
number |
24 |
The margin in pixels on the right side of the visualization. |
Margin Top (px) |
number |
24 |
The margin in pixels on the top side of the visualization. |
Margin Bottom (px) |
number |
40 |
The margin in pixels on the bottom side of the visualization. |
Legend Width (px) |
number |
128 |
The width in pixels of each legend label on top of the visualization (if enabled). |
Hide Property Selection |
on/off |
off |
If enabled, hides the property selector (footer of the visualization). |
Auto-run query |
on/off |
on |
when activated automatically runs the query when the report is displayed. When set to `off', the query is displayed and will need to be executed manually. |
Report Description |
markdown text |
When specified, adds another button the report header that opens a pop-up. This pop-up contains the rendered markdown from this setting. |
Rule-Based Styling
Using the Rule-Based Styling menu, the following style rules can be applied to the line chart:
-
The color of the line.