


Editor’s Note: This presentation was given by Michael Moore, Todd Middlemis and Sameep Mondhe at GraphConnect New York in September 2018.
Presentation Summary
Michael Moore, Todd Middlemis and Sameep Mondhe work at EY as an executive director, partner and analytics strategist. EY was experiencing problems looking at hierarchical relationships, organization design and revamping their platform.
EY’s business need was to be able to model, edit and see real-time changes in their applications in a very fluid way. Dealing with HR applications within large company acquisitions meant they needed to see the results of their decisions on a broad scale.
EY needed a solution that illustrated organization mapping, redesign and design. Organization mapping is generally done at a very high level, but deciding how future organizations will be distributed requires a bit more vision.
Additionally, they needed a solution that could compare changes with the original data set and display KPIs supported by Neo4j using Java and Cypher queries.
Users are also able to drill down and filter on specific features. Tabular views is very similar to organization mapping and not only shows changes you’ve made against the master data set but denotes reason codes for other users to better understand why a change was made.
A few functions are incredibly specific to HR protocol like succession planning and employing transfers which works with moving and reorganizing the organization hierarchy. Functions also work to ease transition planning for leaving employees in the off boarding process with Tableau, reporting and organizational charts.
With Neo4j, EY was able to calculate the span of control and better manage relationships. Users feel comfortable making decisions because they know they are able to see the changes in time and, if need be, go back and undo it. You are instantly able to see the impact of a change on all levels and verify that decisions are in line with meeting goals and targets.
The EY process is to consult with the customer and deeply understand the nature of their transformation and how to best help them. For this reason, it is important that they are able to offer support compliance, compare different versions of the graph structure, and intricately understand the relationships between all the nodes.
Working with Neo4j has empowered EY to better consult with their customer and offer dynamic, solution-driven decisions with full visibility on their impact.
Full Presentation
Michael Moore: My name is Michael Moore. I’m an Executive Director at EY. I run our national practice in knowledge graphs and artificial intelligence. I’m pleased to introduce some of our EY team members.
We have Todd Middlemis, who is a partner in our Transaction Advisory Service. When companies want to do acquisitions or spin-offs, we have a practice that supports that.
Todd is joined by Sameep Mondhe who is a Senior Manager, Lead Developer and Architect, for this new application that we are rolling out across EY. The application is called the Organizational Talent Hub.
In addition to performing advisory work around Neo4j, we are actually a Neo4j customer and this is an application that’s built entirely on Neo4j.
Todd Middlemis: I’ll give some context to the business problem that we solve with the application then walk you through it and talk about how we use it.
The Business Problem
As mentioned, we help clients from a consulting services perspective. We help clients manage large complex transactions like acquisitions of two large companies. We tend to work with some of the largest transactions that are happening in the country. We work on acquisitions, spinoffs, integrations, divestitures and joint ventures. In particular, we are focused on the services that we’ll talk about today.
We’re focused on people and positions in those organizations. Imagine taking two organizations with over a 100,000 people each, merging them together, and then figuring out direct reports, legal entities, cost centers and work locations. How will we organize departments and products?
We’ve been developing a platform and providing clients a platform service with technology behind it for a number of years. We used to provide that technology on some of the older technologies. We used to have a lot of hierarchical relationships that we were trying to build with all the technologies.
A couple of years ago we had the opportunity to revamp our platform, look at the latest technologies that run the market and we’ve had a lot of success after adopting Neo4j.
Neo4j is a perfect fit for our business needs. We need to be able to model, change and see real-time changes. It’s important that we dynamically see the impact of those changes in a very fluid way. Typically, our service to clients is our technology platform. As Michael mentioned we are a client for Neo4j. We provide the consulting services and then our methodology.
You’ll see our methodology and processes are embedded inside of the tool in the application, which makes it even richer.
Sameep Mondhe: I will be walking you guys through this particular application.
First, I’ll talk about the technology stack that we are using for the application before I do a deep dive on what features and functionality the application has.
Below is a three tier architecture. The front end is based in AngularJS D3, which is used for some of the graph visualizations.
The middle tier is Java Spring Boot framework and the backend is a Neo4j database. We are using Neo4j to store all the relationships and nodes with respect to positions and people.
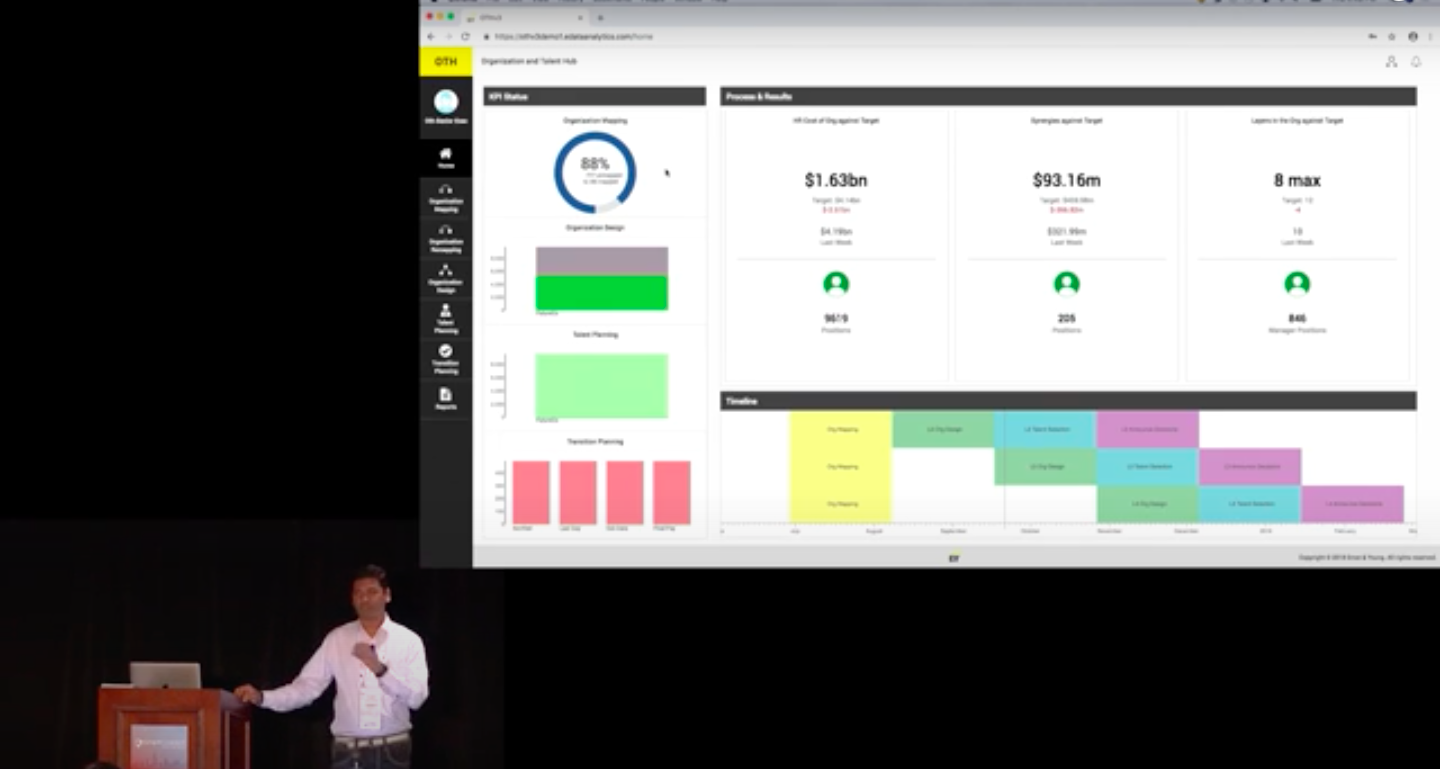
Next, is the home page. We are trying to show a lot of KPIs on this home page. Depending on what user is logged in, you are able to control what level of access each user has for an organization’s data. Whenever we go to any client engagement meeting, we discuss and decide what attributes we want to ingest in this particular application. Then the client is able to take a look at these attributes when they’re making decisions for their future state organization.
The is demo is set up for two companies merging and forming a third company. You will see data from source company A and source company B. Then they’re forming a future company, Futureco.
We go to the clients and discuss data elements. There are tools and features that allow us to customize what kind of data elements are ingested in the application. We ingest that particular data and then it is available for the users to look at depending on the access.
I’m logged in as a senior HR business partner for this particular application. As such, this is the access that I have. As we process this demonstration, you will see that some of the organization mapping and designs have already been taken.
I’ll be walking you through different modules which are part of this engagement model.
This is the home page which gives you a high level view of organization costs, synergies or savings, and the span of control that you want to have for your organizations. From the homepage you will be able to compare how you’re currently doing, against different targets and plans to meet those targets.
Organization Mapping
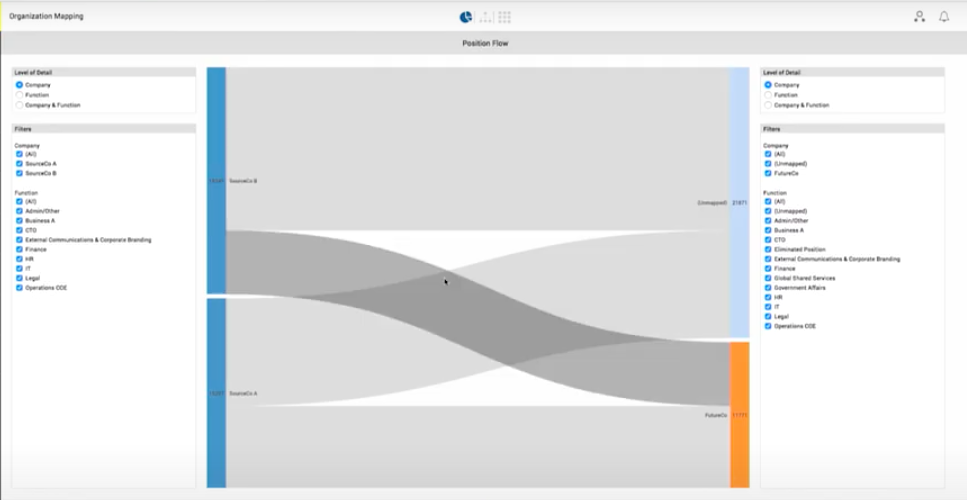
Organization mapping is one of the first steps. You have data from source company A, source company B and then you are deciding how exactly this gets mapped to a future state of the organization.
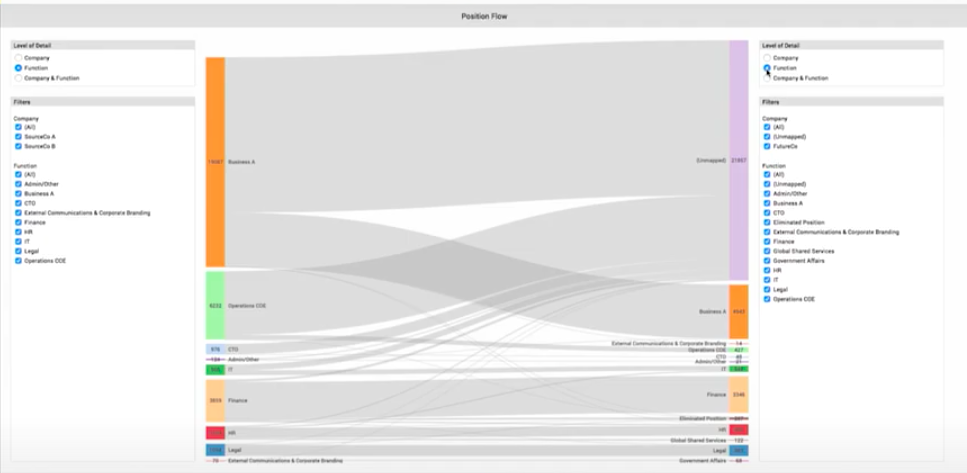
If I drill down to the function level, you see data from businesses or functions. This gives you a very high level view of what everything is and what the platform is doing in the backend. It basically goes into the entire Neo4j hierarchy, reads all the information about all the positions and then shows that information on the functional level.
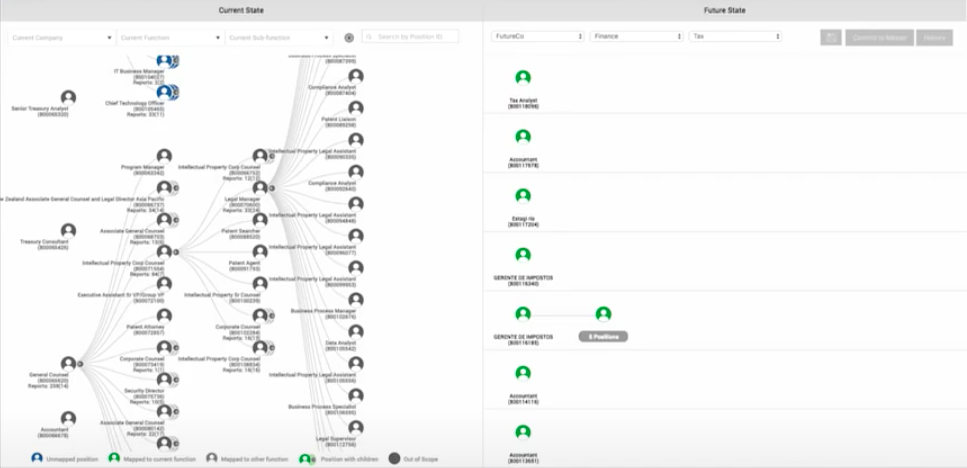
There’s also a chart view, where you see all the positions and the hierarchy that is available for all these positions. You see different titles and then how people report to each other. Then you decide how exactly you want to transform it to the next level.
You see, in the future state, it’s already tagged to finance and tax. You select one hierarchy, take 10 positions and you align them to future state finance and tax. You mention and then you apply those changes to all its children. Then you save those changes.
Once you save it, this is for your own private workspace. These changes are not visible to other users of the application. However, once you commit these changes they’re visible to other users and they’ll be able to see the decisions that you have made.
There is a tabular view as well.
If you want to do certain operations in bulk, you are always able to use this tabular view and all of the columns are filterable. You take a look and decide what other set of positions you want to manage and you can make decisions regarding that.
Let’s filter on a job title. If we search specialists, then you’ll see all the senior specialists. You are able to select all these positions, see how many there are and make decisions about them. You are able to edit and make decisions.
Organization Redesign
Once you perform org mapping- which is usually performed at a very high level, the next step is to decide how the future organization is going to be distributed. Next, you go to a finer level of organization redesign which is org remapping.
I have access to both org mapping and org remapping, but in real life only senior level users would have access to org mapping and junior level HR business partners would have access to remapping modular functionality.
In this case you’re seeing similar information to org mapping. On the left hand side you’re still seeing the future state and then on the right hand you make finer decisions based on how your future organization will look.
Organization Design
Organization design contains the KPIs which are supported by and built on top of Neo4j using Java and Cypher Queries.

What we are doing is looking at the entire organization’s hierarchy and the span of control.
For example, if you see these KPIs, you see what number of positions are available across every level from from level 2 to 10. We also see how many positions are currently there for org design.
You could take a decision, whether you want to retain a position or whether you want to eliminate this position for the future state of the organization. This KPI gives you an overview of what the current state looks like.
Right away, you’ll see that there are 9000 positions that you have access to. Out of that, we see that 4000 positions have not had a decision made about them yet. Approximately 5000 positions have already been retained for future state of the organization and 200 positions have been decided to be eliminated.
KPIs also give you the number of people present in each level and indicate different organizational structures such as flat organization, three levels or four levels. You could also build an organization hierarchy which is like 10 -12 levels.
You are also able to identify the number of direct reports an individual has and that’s how you make decisions on how many people should report to a manager at level three, versus level four.
All of this is done in real time. That means, if I go into org design modeling, I am able to build future state hierarchy.
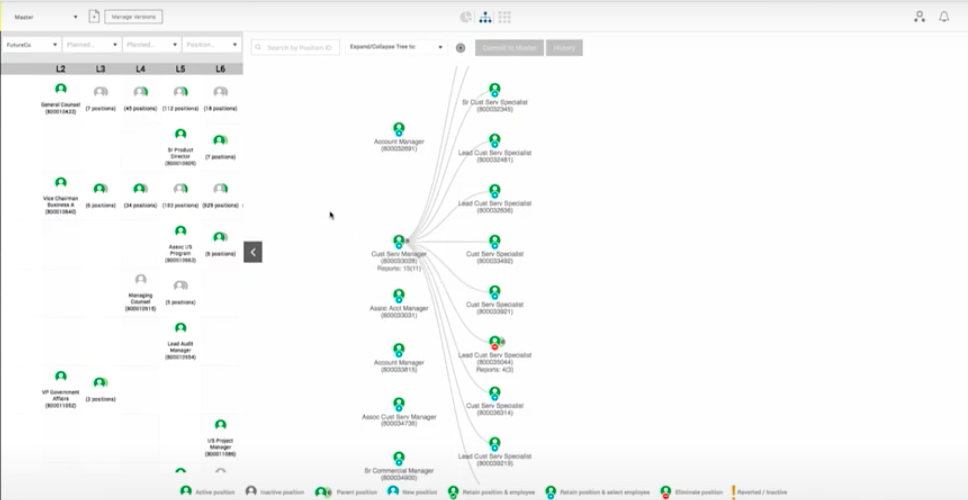
Below is a service manager that is available and these are the number of positions which are reporting into that manager.

I am able to design the future state organization by moving positions around. This lets me build the future state hierarchy.
Then I choose to commit this to the master data which means that I’m saving this particular data.
After I have made these changes and commit them to master, I’m able to go back to the KPIs, which are module specific. There are KPIs within this particular module getting reflected in the home page level KPIs.
What’s significant here is that all these hierarchies are built using Neo4j in the backend. We have nodes and relationships, which helps us navigate through the current state of the organization versus future state of the organization. The positions are the same and you have different relationships for these position nodes where you are able to traverse depending on what you’re trying to look at.
Also this allows you to do some sort of what-if scenario. Let’s say I’m trying to build a hierarchy and I’m not sure whether this is the one that I want as the final structure or not. What I could do is create another version from this, store it like and then save this as a version.
I am now able to look at this particular version and look at the KPIs for the version and compare those against the master version.
Also this button here allows you to see what changes were made accompanied by a comment. You will always know what you’re committing to the database and/or what exactly is getting reflected for other users as well.
You are able to look at the org summary and see that the statistics have changed, then compare between versions and the master version. In addition, these KPIs would show you the difference between what-if scenarios. You could pick and choose the information or what is the structure that you ultimately would select for your future state of the organization.
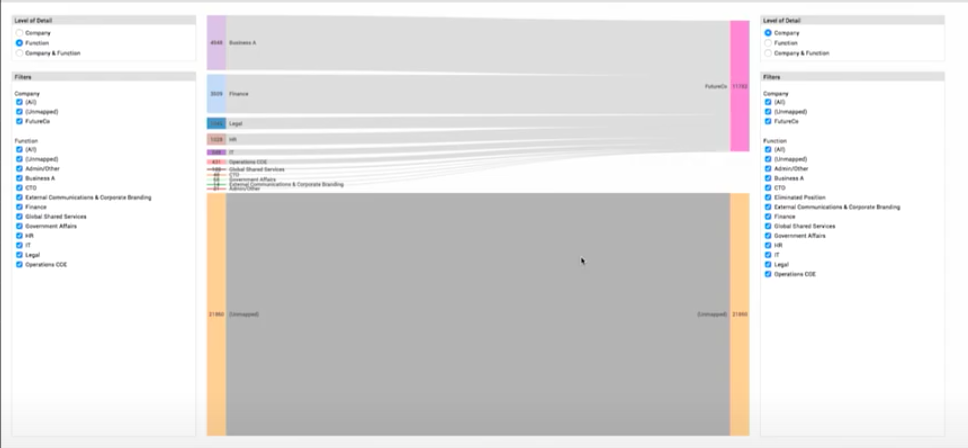
Filter Specific Functions
Similarly you are able to drill down and filter on specific functions. Let’s say I want to filter on tax. I will get a very limited view of that particular function and sub function. The function will only tell you information related to finance and tax.
Similarly there’s a tabular view.
Tabular View
Tabular view is the same as org mapping. You decide in bulk what decisions you want to make. This could include if you want to retain positions or eliminate positions and things like that. Not only positions and employees but you also select what kind of job alignment you want to perform a certain set of positions. For example, do you want to change the future state job IDs for these positions or do you want to change the work location and all that information?
I go to a position and click on configure. This allows me to change position titles or jobs for the positions. It allows me to change the work location details and it allows you to store additional information while making a decision. Let’s say I’m eliminating certain positions. I could decide on what the exact reason code was. I am able to show why I am eliminating or retaining a certain position.
You could also search by this specific position on the left hand side.

Double click any position and this tool gives you additional attributes that you ingest as part of data ingestion.

On the right hand side you’ll see all the information that you want for that particular position.
Most of this data is reference data that you ingested from the client. The client used these data points to decide what they want or what decisions that they want to make.
Succession Planning
Apart from position management, it also helps you with succession planning.
Once you decide what your future position hierarchy is going to look like, you’re able to decide what people would be sitting in what position.

This view tells you there are these 9600 positions and then there are only two selected. This tells us that you haven’t selected what employee would be occupying these positions for the future state.
There’s also a view which allows you to search for an employee that you want to fill.

This employee search gives you search capabilities that use Neo4j. We have built structures in Neo4j, which allow you to search by specific attributes.
On the left hand side, you see different attributes that you have. Also, you are able to search through by manager names and IDs to identify who is reporting to who and what positions they hold.
I am able to select a specific person that I want to assign for a future state. I selected it and now this position has this new person assigned to it. I save and commit and now those changes are visible to other users.
I’m able to do the same thing here on a tabular view. I am able to bulk edit, based on positions. When you’re in the employee view, you are able to decide whether you want to retain the employee in the same position or assign them to a different one.
You select a different position from the list.

Now you could assign the employee for the future state.
Employee Transfers
Depending on your access level, you are able to request for a transfer of an employee. Let’s say you know of an employee whom you do not currently have access to because they sit in a different part of the organization. You are able to request an employee in a search. Then whoever owns that part of the organization would have access to accept or reject your request.
Once the employee’s transfer is approved then you have that particular employee under your rights and you are able to assign them to a new position.
The KPIs are position and employee based. The KPIs give you access to all the information and then you make decisions in real time.
The Switch to Neo4j
Earlier versions of this tool included Excel documents to make these decisions offline. Then user decisions would get loaded to a SQL server and then calculated. Then we get another Excel output back with the results.
With Neo4j, we really calculate what is the span of control such as number of people reporting into one specific position, as well as what is the cost of the organization. That is also able to give you guidance with terms of current state and future state.
All these relationships are managed in Neo4j so you are able to traverse depending on what the functionality you’re trying to showcase. You are able to change your decisions then and there.
You make a decision and you are instantly able to see how it is impacting your top line, bottom line, or target that you need to meet. If this new decision does not support meeting that target then you are always able to always go back, change it in real time and then make sure that you meet your target with another tool.
Transition Planning
When deciding to off board a group of people from the organization there are certain formalities that you have to perform like exit interviews and other HR related formalities.
This tool allows you to control that through specifying different dates and parameters for these off boarding formalities.

That gives you a high level view of what is happening on a certain date. How many people are leaving your organization in wave one, wave two, etc.
Reporting
Also there’s a reporting component.
When all of the information is present you want to easily be able to distribute this information to other sections across your organization.

Organization Charts
Another cool feature that I want to show is an org chart.
Let’s say Future State HR limited. This is a third party tool that we’re using in an org chart now and it prints org charts. You are able to check those out and decide what the future state hierarchy would look like and share it with executives.
Tableau
Also there’s a set of Tableau reports.
If you click one of these reports it will go Tableau. You see similar information such as KPIs, developed in Tableau. Also it has an Excel interface. You are able to download decisions that you made previously as an Excel output, store it on your desktop and use it.
Organization Hierarchy
One of the things that I wanted to show is the entire organization hierarchy. Lot of people asked us if they are able to see the entire organization in plain read only view? We are doing it.

This is an org view. You are able to load the entire hierarchy of the organization and keep scrolling and looking for what you want to find. You are able to filter based on the company that you’re looking at. If you’re looking at source company B and specific functions within that company, you are able to see exactly how the hierarchy for that function or sub function is. Then you are able to make a decision with respect to what you want to perform.
Now, I’ll return to the home page.

Some of this will now make sense. Any decisions that you’re making will be reflected when you come back to the home page. The homepage calculates in real time and pulls data from Neo4j, using Cypher Queries. The homepage will show how much org mapping you’ve performed, org design, talent planning and transition planning.
The homepage also shows the cost of the organization in savings or synergies, the levels within the organization, the span of control and how you are faring against your targets.
The EY Process
This slide details some of the things that Todd mentioned earlier about the process.

There’s a process and consulting component where we go to talk to the customer, understand their situation, what kind of transformation they’re undergoing and how best help them. The technology part is the tool that we use for making, storing and reporting those decisions. Then, there’s the people part of it. The consultants who do this are at the client engagement level.

This slide details important benefits that have this particular tool. We have a single source, it’s the same information, same data store. We do not have any information that is offline or anything like that.
Whenever the decisions are made, they are stored, captured in Neo4j and available to be downloaded easily or shared across different users.
Support Compliance
Because of the nature of the transaction being performed, it is important that we capture the history for every action. Any action needs to be captured. What we do is capture all of this history in Neo4j using relationships. We are able to capture history with respect to who made the change and what the change was. That needs to be captured for the entire span of engagement.
Neo4j relationships help us do that, and it supports our compliance requirements. We are able to identify where we are able to go and identify all sorts of decisions which were made for a position. We’re able to see who made those decisions and if there are incumbents.

Neo4j provides calculations across hierarchies. Whenever we make a change, the entire recalculation of the cost of the organization or span of control is visible. This is done through a nested loop query that you probably would’ve written in a RDBMS database. Now you just traverse the graph, compute that information and show that information to the user with respect to what their organization looks like.
Different Versions of the Hierarchy
Users are able to save different versions of graph structures and compare one version against others. This allows users to see exactly what the difference is. Neo4j helps us save org hierarchies and traverse them as required.
Thousands of Nodes and Relationships
There’s lot of relationships within an organization like direct reports, employees occupying positions, jobs, work locations, cost centers, business, etc. All of these attributes, like employees, home address and employee skill set are different relationships to different properties that we have.
The same thing gets reflected for the future state as well. You have the same decisions, org structure, cost, employees, people relationships, for future state. You have to manage all of these. At any point in time you should be able to look at the current state as well as the future state of the organization and this is also done through Neo4j.
Transaction Support
Whenever you’re doing transformations, there are a lot of different things that are impacted. When you assign an employee to a future state position the impact would be to make sure no other employee is currently occupying that position.
There are a lot of Cypher Queries which get executed behind the scenes to make transaction support happen. Neo4j transactions are key as they help us maintain a consistent state at the end of it. Should anything go wrong, the entire transaction gets rolled back and we’re able to maintain the consistent state at the end of it. Neo4j has really helped us with that.
Deployment Architecture
Lastly is the deployment architecture.

We are deploying on cloud and Azure. We have a frontend web app and backend web app. Back end is written in Spring Boot Java and it reads Cypher Queries.
We use Neo4j Java drivers to execute Cypher Queries on Neo4j. We get that data, and then the backend web app provides JSON information. JSON format information on the frontend uses the same information to render it. We have access from the EY internet, the clients also have access from the HTTPS website.
Want to learn more about what you can do with graph databases? Click below to get your free copy of the O’Reilly Graph Databases book and discover how to harness the power of connected data.
Download My Free Copy
Users are able to save different versions of graph structures and compare one version against others. This allows users to see exactly what the difference is. Neo4j helps us save org hierarchies and traverse them as required.
Thousands of Nodes and Relationships
There’s lot of relationships within an organization like direct reports, employees occupying positions, jobs, work locations, cost centers, business, etc. All of these attributes, like employees, home address and employee skill set are different relationships to different properties that we have.
The same thing gets reflected for the future state as well. You have the same decisions, org structure, cost, employees, people relationships, for future state. You have to manage all of these. At any point in time you should be able to look at the current state as well as the future state of the organization and this is also done through Neo4j.
Transaction Support
Whenever you’re doing transformations, there are a lot of different things that are impacted. When you assign an employee to a future state position the impact would be to make sure no other employee is currently occupying that position.
There are a lot of Cypher Queries which get executed behind the scenes to make transaction support happen. Neo4j transactions are key as they help us maintain a consistent state at the end of it. Should anything go wrong, the entire transaction gets rolled back and we’re able to maintain the consistent state at the end of it. Neo4j has really helped us with that.
Deployment Architecture
Lastly is the deployment architecture.
We are deploying on cloud and Azure. We have a frontend web app and backend web app. Back end is written in Spring Boot Java and it reads Cypher Queries.
We use Neo4j Java drivers to execute Cypher Queries on Neo4j. We get that data, and then the backend web app provides JSON information. JSON format information on the frontend uses the same information to render it. We have access from the EY internet, the clients also have access from the HTTPS website.
Want to learn more about what you can do with graph databases? Click below to get your free copy of the O’Reilly Graph Databases book and discover how to harness the power of connected data.
Download My Free Copy
Download My Free Copy


