
Slice and Dice Your Graph Data With Neo4j Bloom

Software Engineer, Neo4j
7 min read

Neo4j Bloom is an advanced graph exploration tool. You can display different Neo4j graphs and explore graph data using the search feature, expanding it visually or by using custom Cypher queries.
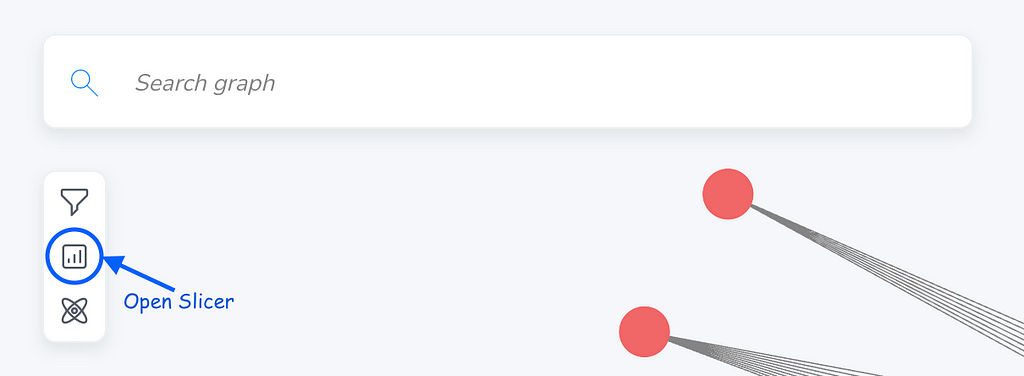
But now we’ve added a new feature to interactively explore your graph changing by values on your nodes and relationships — The Slicer!
In Neo4j Aura you might press shift+reload in Neo4j Workspace to get the latest version with this feature.
Each node or relationship in a Neo4j database may contain different properties. For example, a node with the label Movie can have different properties like title, year, rating, etc. The values and types of the properties can vary and the distribution of the distinct values for each property is different among nodes or relationships.
What if you are interested in individual properties in a specific range of values?
Bloom’s new feature, the Slicer, displays all the existing distinct values of a property of a node or relationship in the scene, in ascending order, like a timeline or histogram — you can easily slice the visual Bloom scene based on those values.
This gives you the ability to interactively display specific subgroups of nodes and/or relationships which contain a selected range of property values and allows to see the changes over time (for date/time properties) or otherwise highlight nodes with varying property values (for numerical properties). This enables Bloom users to tell a story about their data.
You can select a specific slice of the set of the total distinct values of a property using the Slicer chart bar. Each bar of the chart represents the count of the nodes and/or relationships that contain a distinct property value (or a subgroup of values in the case of large datasets).
For example, you can focus only on the nodes which have the value 1998 for the property born. Selecting two continuous bars, 1998 and 1999, only the nodes, which contain the property born, and their value is inside of the selected range [1998, 1999] will be shown in the Bloom scene.
How to create ranges
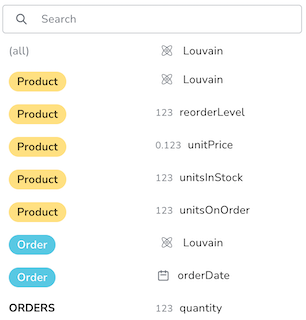
Initially, you can select from a list of options that contain the full range of properties. Each option represents a different set of nodes and/or relationships and is a combination of:
- the group(s) the property belongs to; category name (for nodes) or relationship type (for relationships)
- the property type (supported types of values are integer, float, date/time, or duration)
- the property name (for example, year)
In case of universal properties (with same name and type) for all graph elements, an additional option is generated and gets tagged as all.
Choosing the “all” option, the selection of the visible nodes or relationships depends on all the nodes and/or relationships where the property exists and the property values type is the same as the range property type.
Values generated by the Graph Data Science integration in Bloom are considered properties and are included in the list. You can choose them for creating a new range in the Slicer based on their values.
Selection of visible nodes and relationships
In the basic operation, you just select a property and then can see the distribution in the histogram and select the slice that you want to be visible.
Like shown below for Product(unitsInStock) or Order(orderDate).
Playback mode
There are two types of range selection:
(a) manual, by resizing/dragging the range window on the histogram
(b) playback mode, which automatically changes the window in a specific period of time; the bloom visual scene gets sliced automatically, as well, according to the temporary window position.
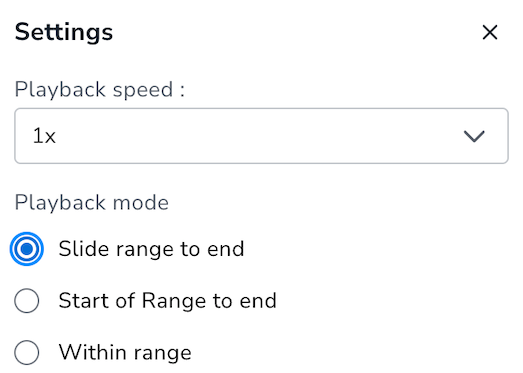
Also, the playback mode can be customized. You can select the mode and the speed of the animation.
There are three types of playback modes:
- Slide range to end: which slides the slice from left to right keeping the range window width fixed over time
- Start of range to end: which enlarges the specified range from the end of the range to the end of the histogram
- Within range: which reduces the range from the start of the range to the end
Notes:
- The ranges configuration is stored locally in your Browser or in the database (for enterprise users) in order to be shareable and reusable for future sessions.
- Any change in the scene removes automatically the existing ranges.
Slicer is now available for exploration in the new 2.7.0 Bloom release and in the Neo4j workspace.
Give us feedback or suggestions here. If you need more technical information about Bloom, see the documentation, and for more use cases take a look at our website.
The following section goes more into the nitty gritty details of compound ranges but is not necessary to understand how the slicer works and to get value out of it.
Here be Math — Parallel compound ranges
You can create different ranges in the Slicer (up to five), adjusting the Slicer window and focusing, in parallel, on different properties and/or different groups. You need to click on “Add Range” to achieve that.
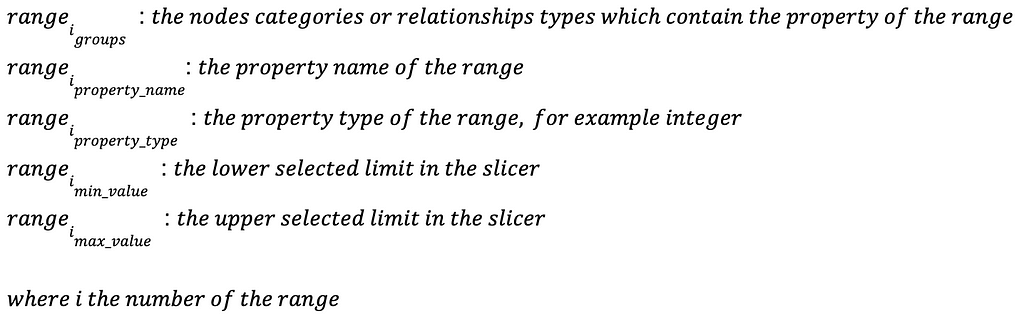
A range is defined by the below parameters:
A node or relationship (s) is defined by the parameters:

And for each node or relationship property:
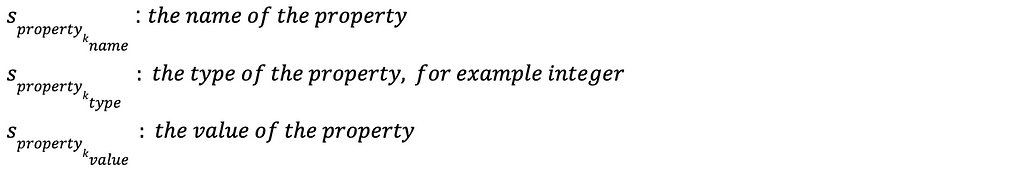
A graph, G = (V, E), in the Bloom scene, is a combination of nodes (V) and relationships (E).
Initially, we check if a node category or relationship type is included in the range groups and contains a property that matches the range property name and type.
The set that satisfies the above criteria — where i is the number of each range and k is the number of a property of a node or relationship — is:
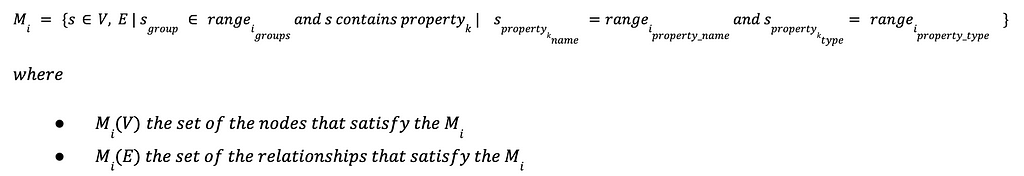
The function that returns the value of each property of a node or relationship (in this context s), which belongs to the above set, is:

In order to calculate the final visible nodes and relationships we take into consideration the following sets:
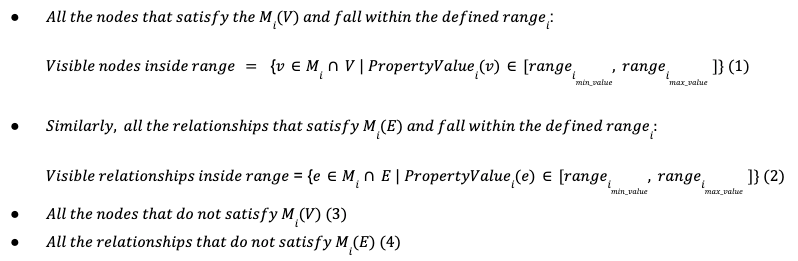
Combining (1) and (3) we get the final visible nodes by:

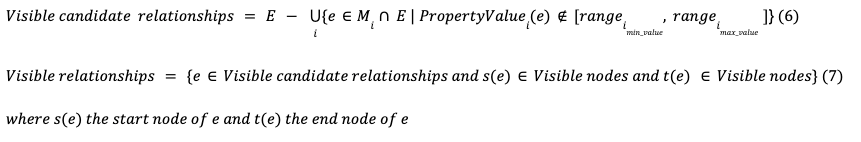
The same logic is applied for the selection of visible relationships, (2) and (4), but for the calculation of the final visible relationships there is an additional layer of filtering.
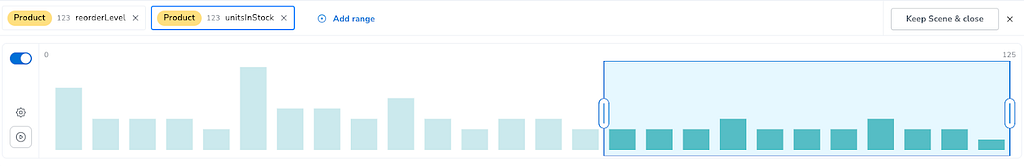
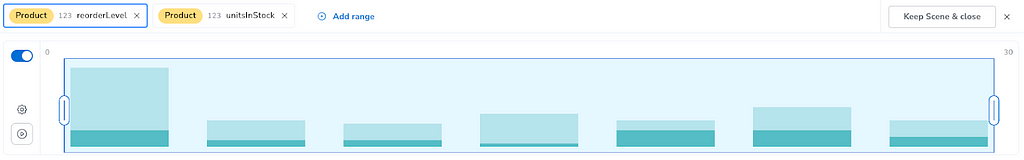
For example, you can have two ranges selected for the properties:
(a) Product integer unitsInStock
(b) Product integer reorderLevel
Initially, all the possible values of (a) are between [0, 125] and all the possible values of (b) are between [0, 30] which cover the full range of the nodes in the scene. Then, using the Slicer, you can change the ranges, for example, to [8, 9] and [10, 20] respectively.
In that case, according to (5), we focus on the nodes that belong to the Product category and include the properties unitsInStock with type integer and/or reorderLevel with type integer, as well. Any node that does not match any of the above criteria is visible. In case a node matches the range criteria, the value of the node properties unitsStock and/or reorderLevel should be inside the selected ranges, between [8, 9] for (a) and [10, 20] for (b), in order to be visible.
In case of a node that contains both unitsInStock and reorderLevel (only for integer type values) then both properties should satisfy the selected range of values in order to be visible.
Also, relationships which are linked to hidden nodes are not visible as well (7).
If a node contains both properties where at least one is out of their range then it’s not visible and is considered hidden in the chart. The number of the hidden nodes is displayed with lighter color in the chart bars.
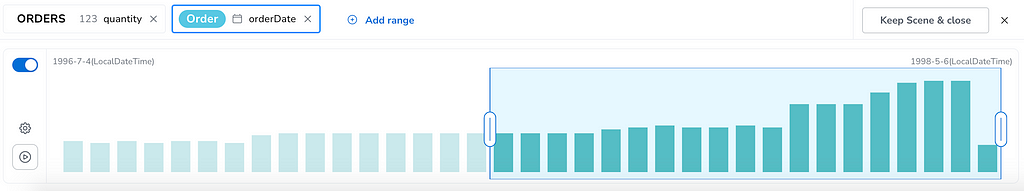
The same rules are applied in case of relationship properties. For example, you can add two new ranges:
(a) ORDERS integer quantity, where ORDERS is a relationship type
(b) Order datetime orderDate, where Order is a category
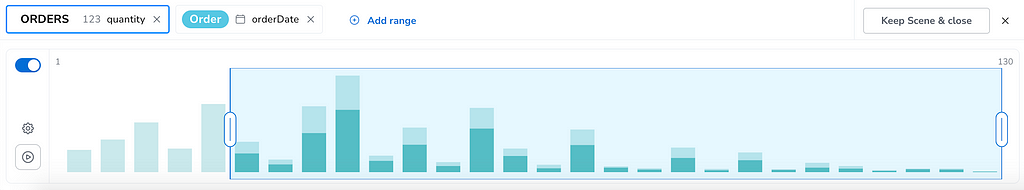
In the above example, (a) hides all the relationships with quantity value less than 7 and (b) hides the nodes with orderDate earlier than a specific date.
In the first image you can see that inside a valid range, [7, 130], some of the relationships are hidden (displayed with lighter color). That happens because some of the relationships found in the selected (a) range are associated with hidden nodes which contain the property orderDate and are out of the range (b).
A node or relationship, with matching range criteria, has to satisfy all the ranges in order to be visible, as explained in the previous example as well.
Congratulations! You made it all the way to the end, so now go and try out the cool new feature and let us know how you like it.
Slice and dice your graph data with Neo4j Bloom was originally published in Neo4j Developer Blog on Medium, where people are continuing the conversation by highlighting and responding to this story.
Share Article


Explore
Related Articles

Mastering Fraud Detection With Temporal Graph Modeling


Text2Cypher Across Languages: Evaluating Foundational Models Beyond English


