Scene interactions
When you first open a new Perspective and have no data visualized in your scene, you are greeted with two options to get started; Show a graph snippet or Search the graph.
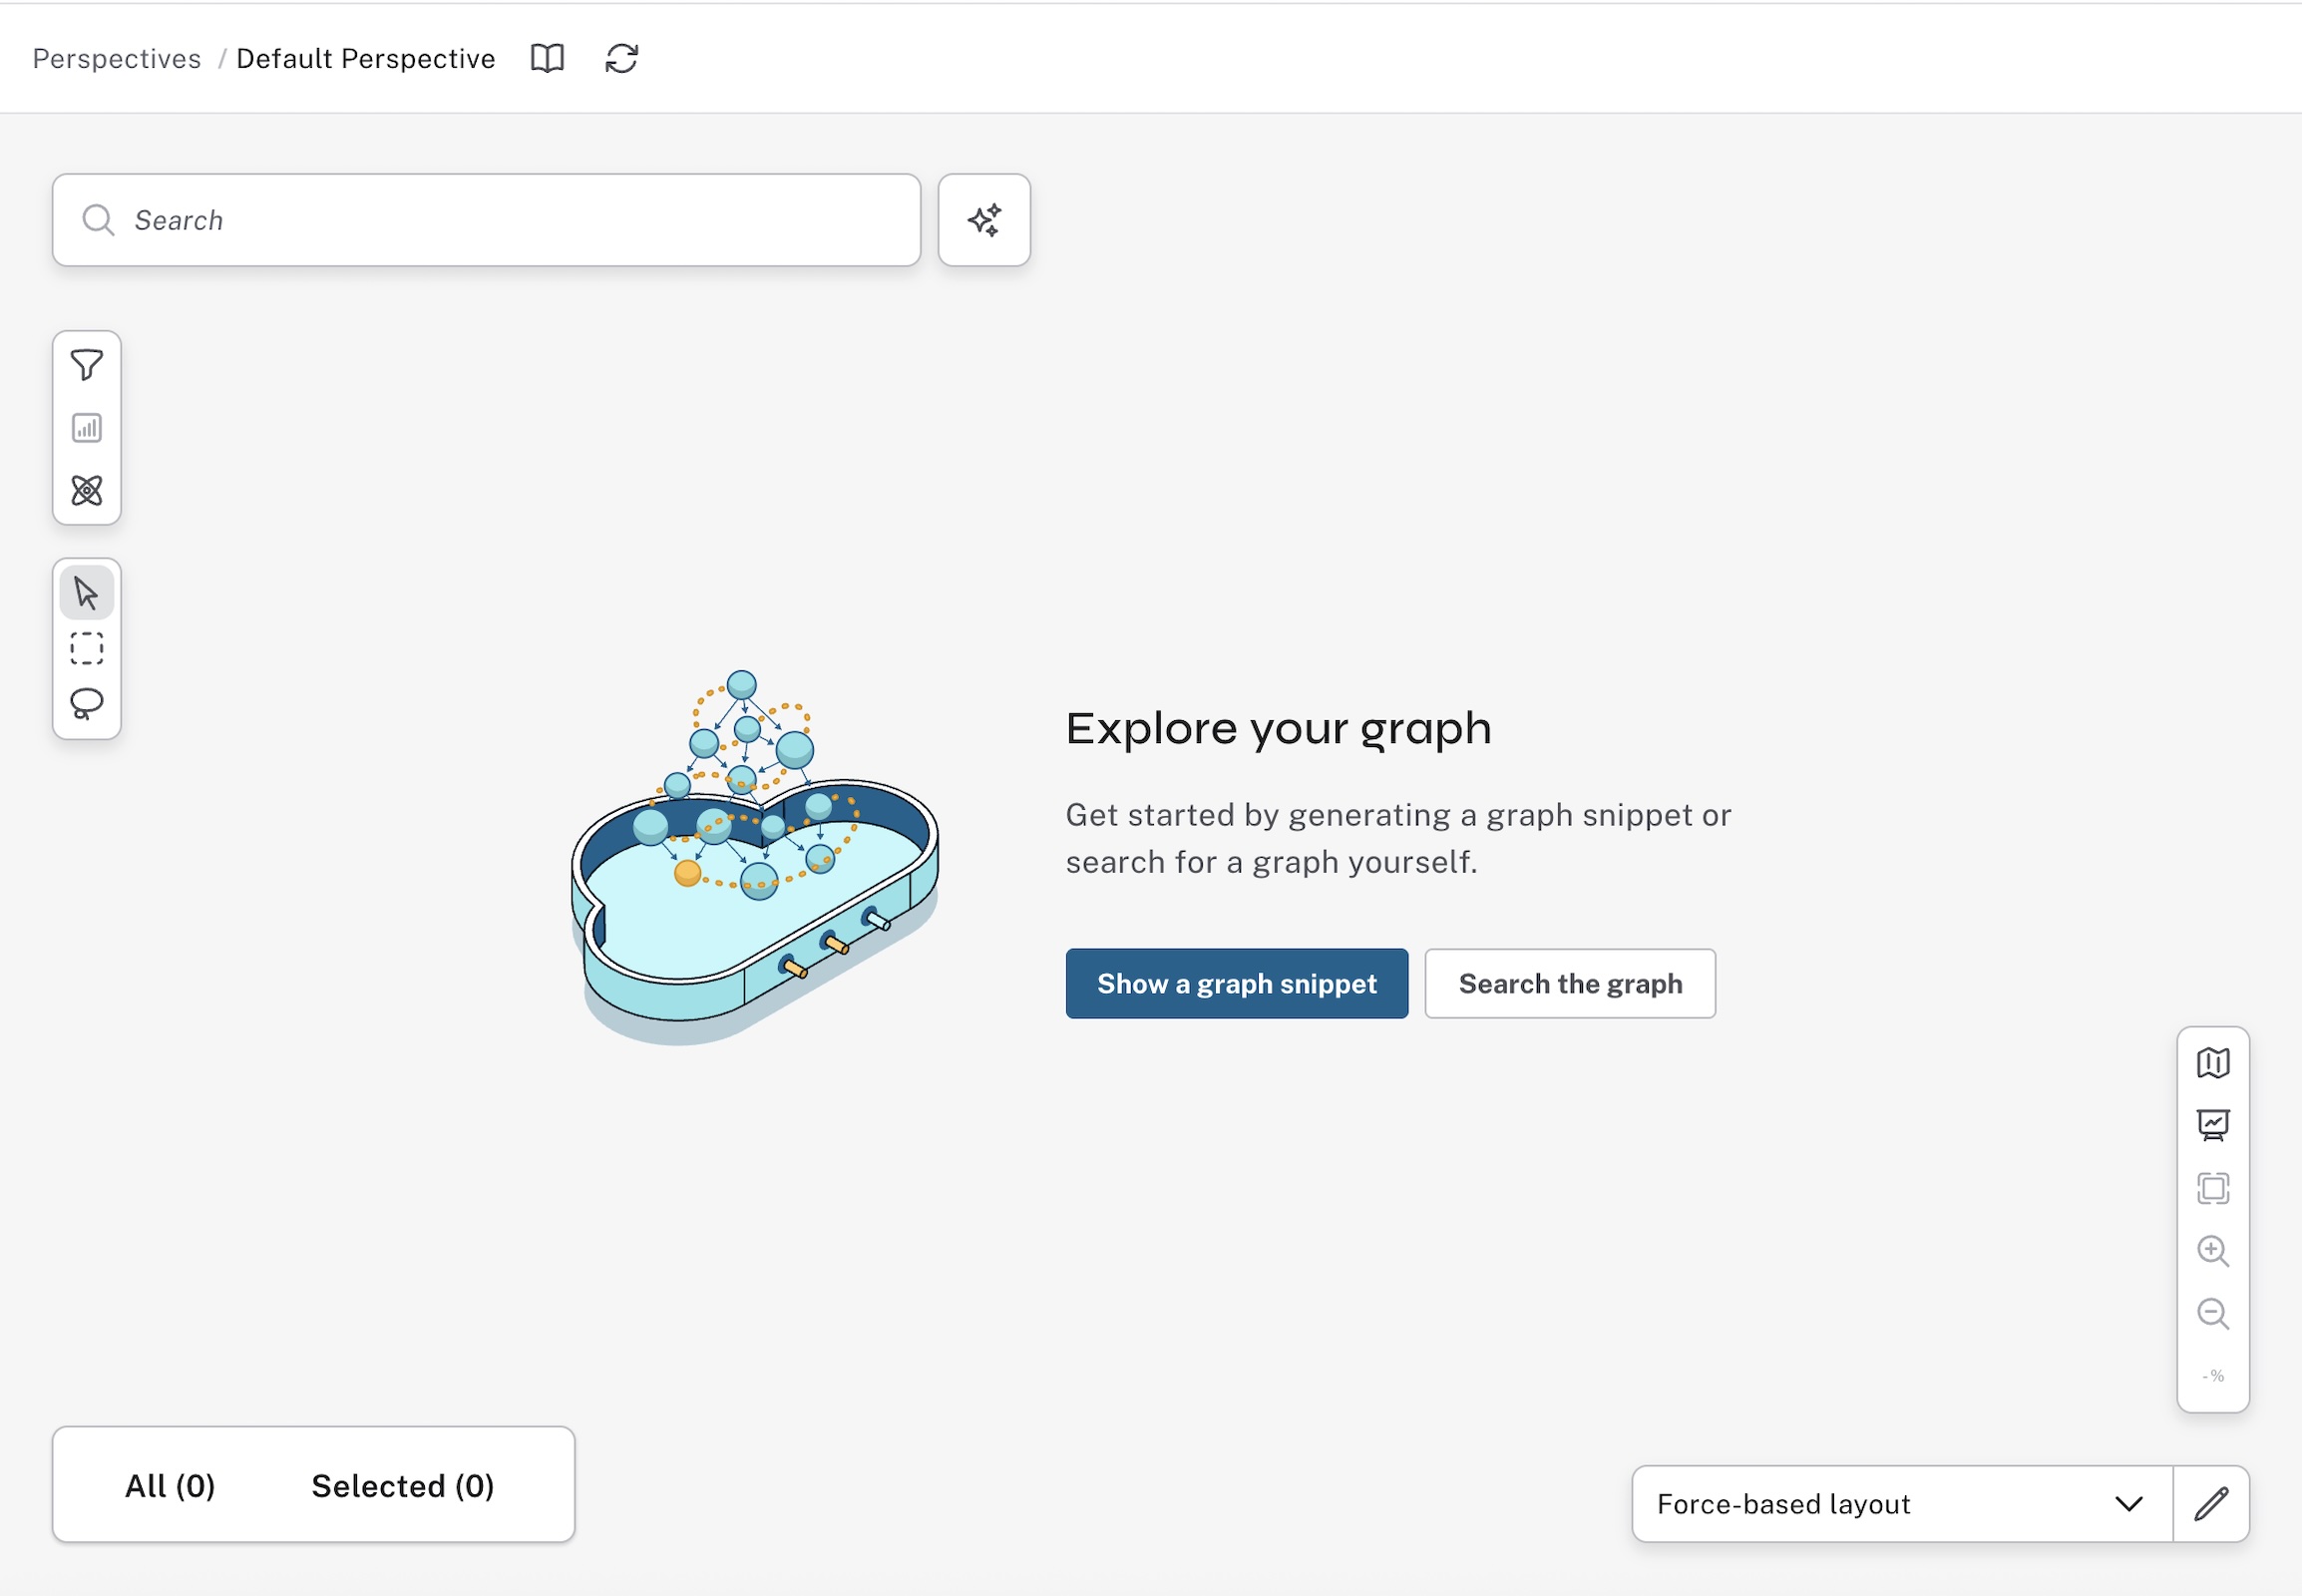
The first option returns a sample of your data and can help you get started with visualizing your database. The second option takes you directly to the search bar to start retrieving specific elements from your data.
Once you have data in your scene, several interactions are readily available to help you explore your graph visualization. Some of the commonly expected ones are:
-
Zoom in and out using your mouse or touchpad scroll functions, or use the buttons at the bottom right of the scene. The size of the text on nodes is dynamic in relation to the size of the node.
-
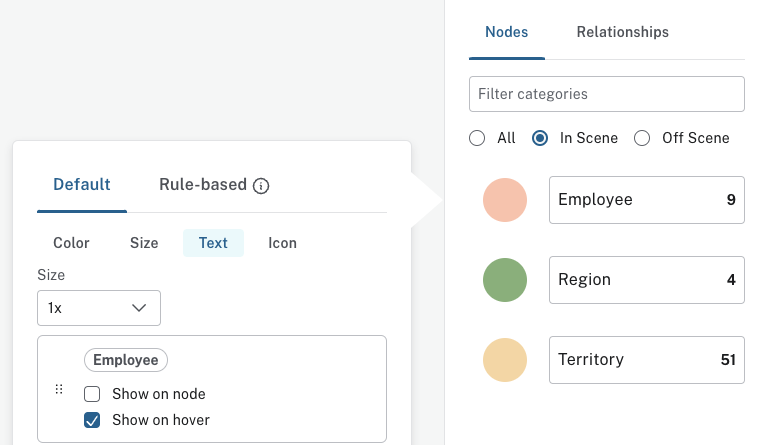
Hover over a node or a relationship to see its label and selected properties. For nodes, but not relationships, you can control what properties to display. This is done in two steps, first you select which properties should be available for display from the Perspective drawer. Click on a label from the list of Categories and check/uncheck Exclude from the available properties. Next, in the Legend panel, select the colored circle to open the styling menu and then find the Text option under Default. Then you select which property/properties to show on hover.
-
Left-click on a single node or relationship to select or deselect it. Multiple objects can be selected by holding the appropriate keyboard modifier key (Cmd or Ctrl key) before selecting.
-
Double-click on a node or relationship to open the Inspector to inspect the element’s details.
-
Left-click in an empty spot on the scene and drag immediately to pan the visualization.
-
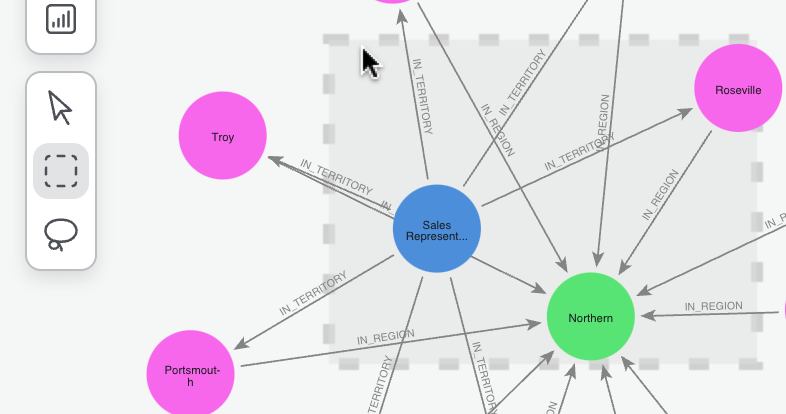
Use the marquee tools to select multiple nodes and relationships.
-
Right-click anywhere on the scene to bring up context-sensitive menus for the object(s) clicked on. You can right-click on a single node or relationship, on a group of highlighted nodes and/or relationships, or on an empty spot on the scene.
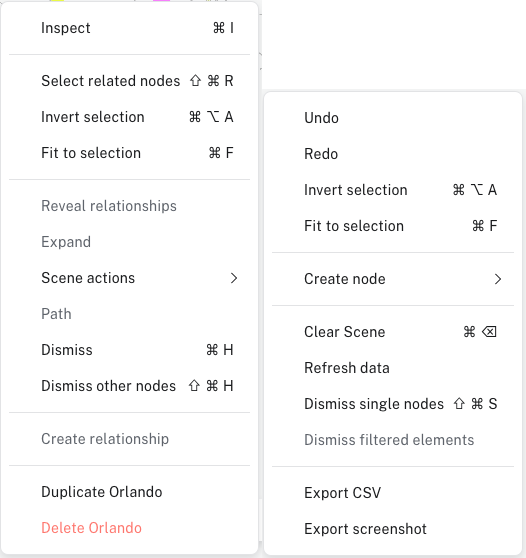
The following sections describe some of the notable graph interactions available in these context menus.
Select related nodes
If you want to work with a node and its closest connected neighbors, you can select it and from the context menu Select related nodes. Once selected, you can then dismiss the other (unselected) nodes and only have your nodes of interest in the Scene. This action is also possible with multiple nodes selected.
Dismiss single nodes
As mentioned above, it is often convenient to display only connected nodes. Without selecting any nodes or relationships, the context menu lets you Dismiss single nodes to remove all nodes that are not related to any other visible nodes in the Scene.
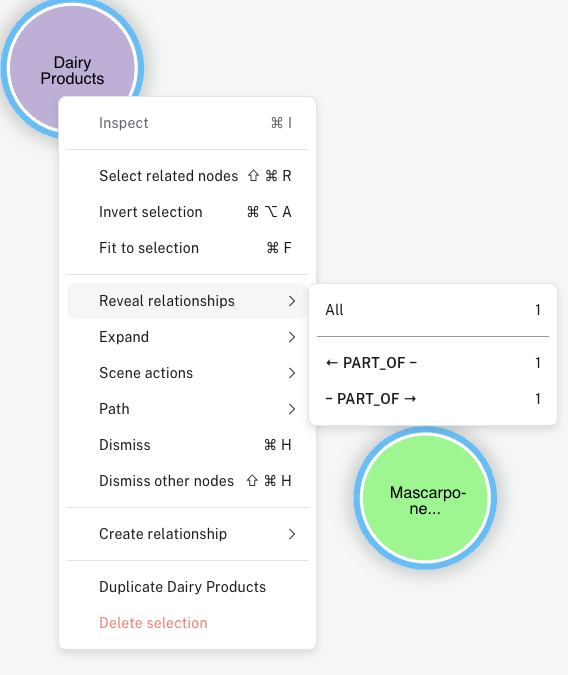
Reveal relationships
With a single or group of nodes selected, you can reveal direct relationships between them that are not already visible in your scene.
This option is available if relationships exist between selected nodes, provided that they are not already displayed.
Accordingly, if only one node is selected, the Reveal relationships is available only if the node in question has a relationship to itself.
Expand nodes
With a single or group of nodes selected for context, you can expand the nodes to visualize their immediate neighbors. Then, select from the result and expand further to navigate local areas of the graph. Expansion can be done from the right-click context menu of a node or from the Inspector when viewing a node’s relationships or neighbors. When expanding neighbors of a node, the number of nodes returned is limited to the number specified in the Node query limit in the Settings drawer.
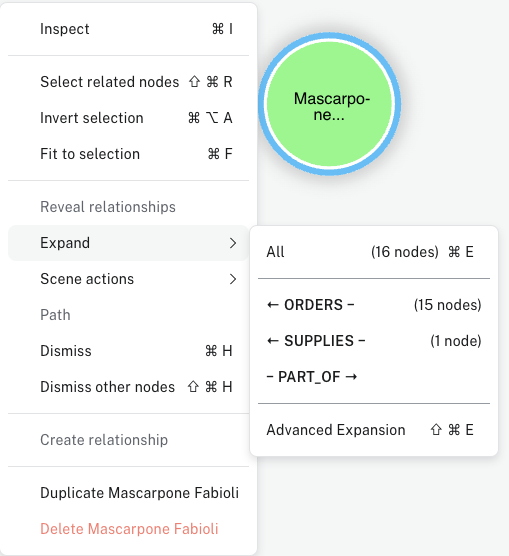
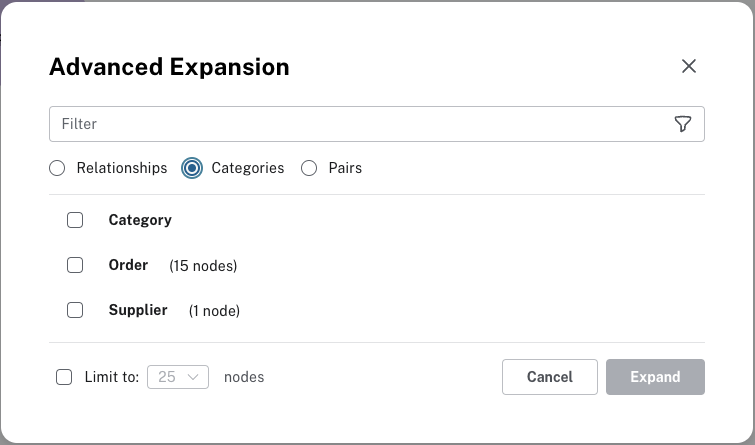
The right-click context menu provides additional options to expand selectively along a specific relationship type and direction, or to open the Advanced Expansion dialog and choose to expand along several specific paths, or to specific neighboring node types, or a combination. You can also choose to limit the number of nodes that should be returned in the result. If you set a limit in the context menu, this overrides any Node query limit set in the Settings drawer.
Group nodes and relationships
Sometimes you may be interested in how a group of nodes relate to others, rather than how each individual node fits in. Bloom offers an option to group selected nodes and have them represented as one visually distinct larger node. Any relationships between the grouped nodes other nodes are displayed individually. Once two or more nodes are selected, the context menu includes an option to group them.
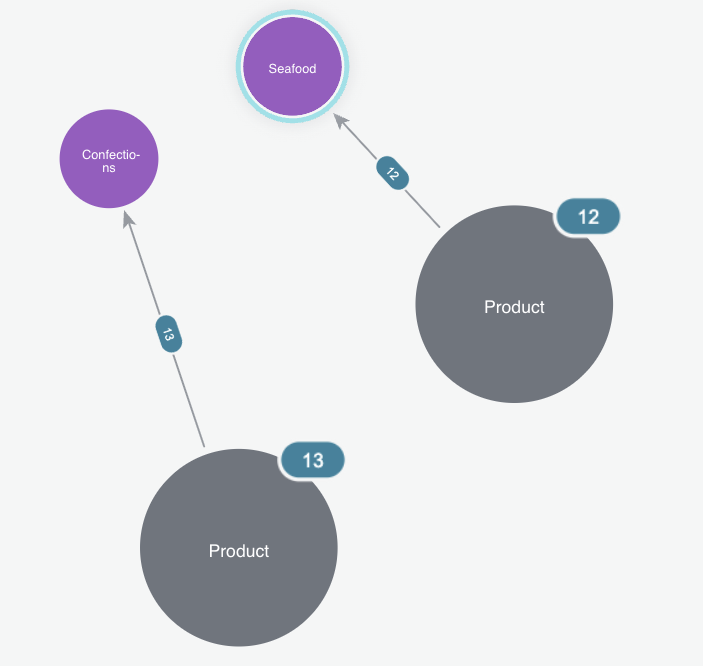
Similarly to how you group nodes, you can group relationships should you be more interested in that nodes are related and less in how they are. From the context menu available with a right-click from anywhere on the scene, without selecting any elements, you can group relationships provided that there exist two or more relationships between the same nodes. Once grouped, you can ungroup from the same menu. Note that both grouping and ungrouping relationships affect all applicable relationships present. Grouped relationships are represented with an arrow and a number that indicates how many relationships the group consists of. Double-click the relationship group to inspect it and display the relationship types present in the group. Alternatively, you can use the button in the legend panel to group/ungroup relationships present in the scene.
Shortest path
A powerful feature of Neo4j graphs is to see how two entities may be connected without knowing the exact path of relationships between them. To do so in Bloom, you can run a shortest path command between two nodes. Select the two nodes of interest, right-click on one of the nodes to bring up the context menu and select the Shortest Path option.
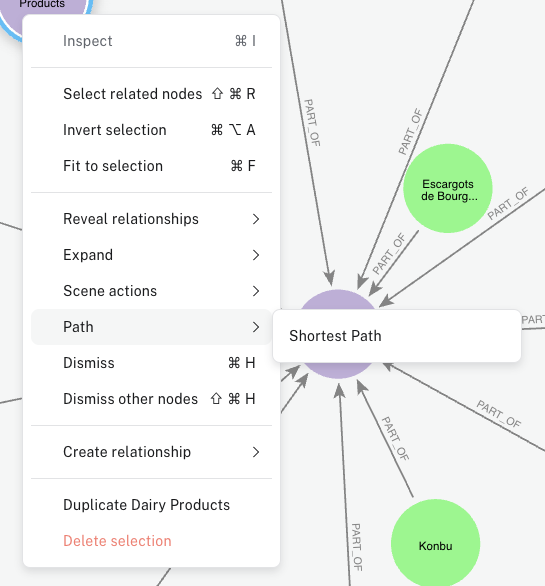
| Bloom searches for shortest paths within 20 hops and shows the first shortest path found by the database. |
Layouts
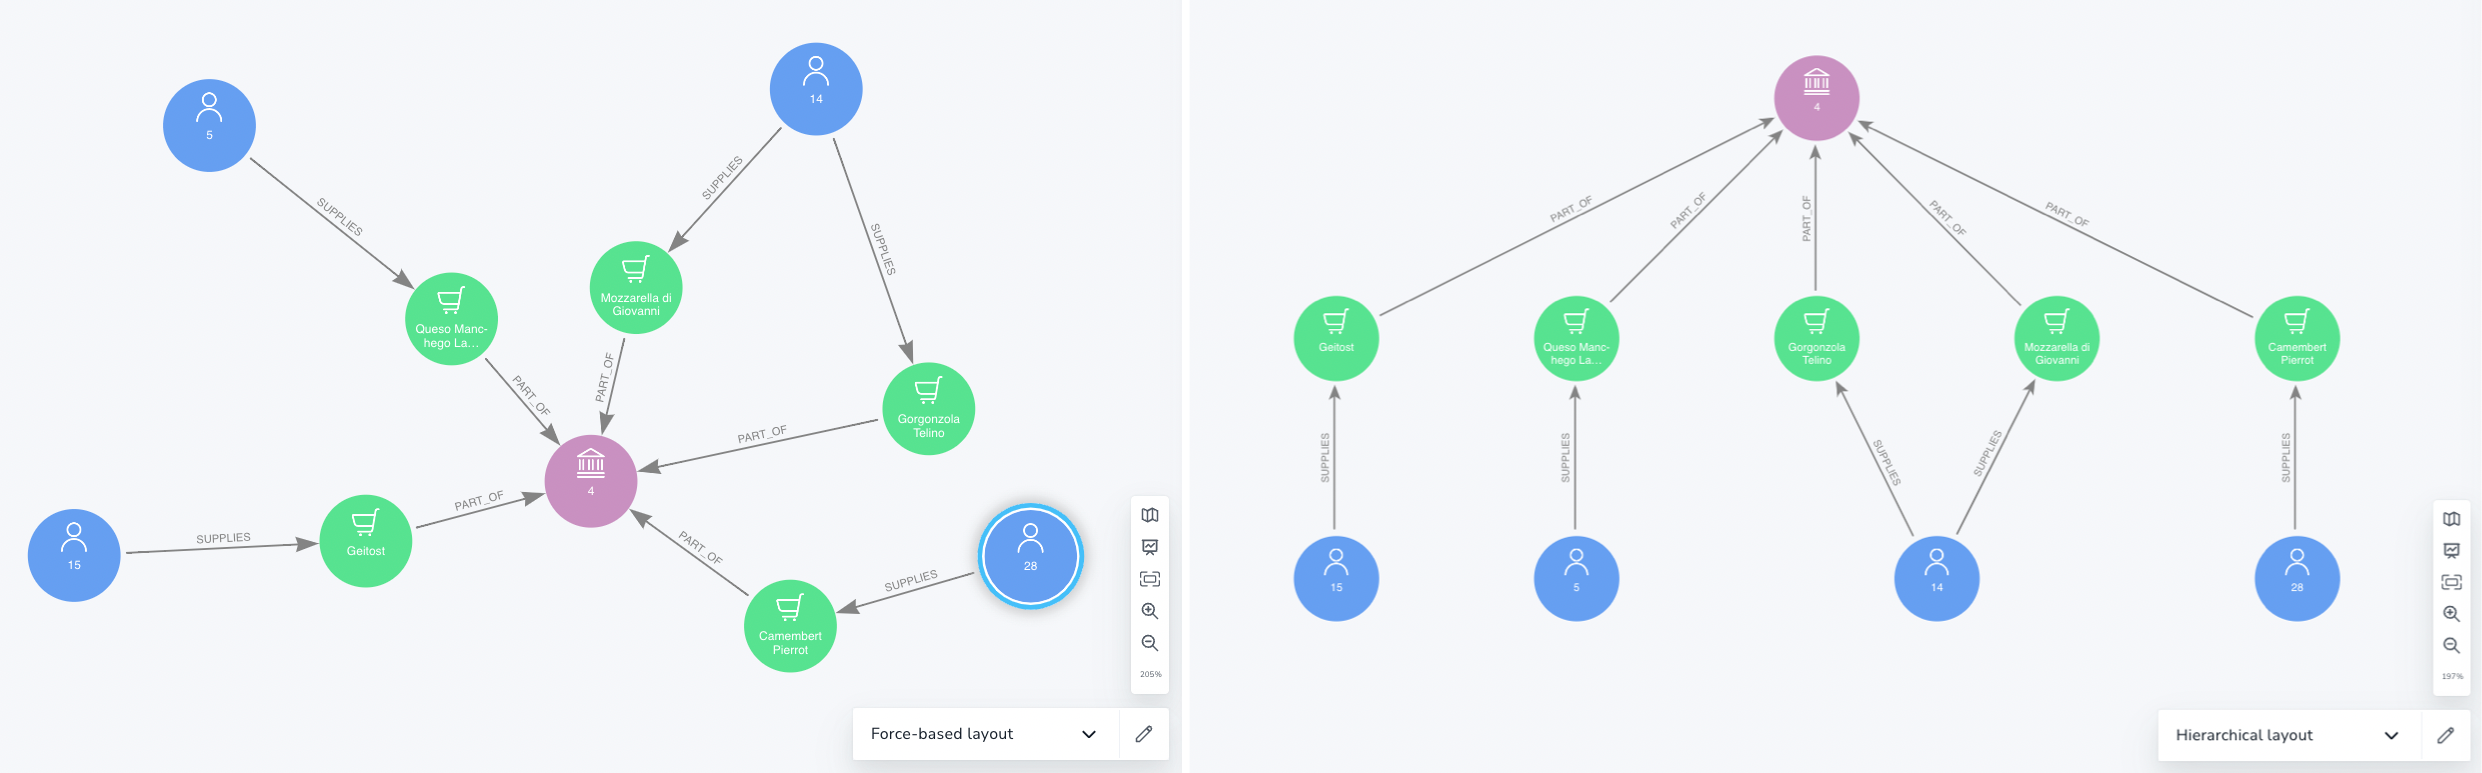
In instances where you are interested in knowing more about how various nodes are related in comparison to each other, Bloom allows you to change the layout of your scene. By default, the nodes and relationships in a scene are presented in a force-based layout. There are two different force-based layouts available:
-
Force-based layout 1 - GPU accelerated layout that is fast and renders a quite dense and compact graph.
-
Force-based layout 2 - not accelerated by GPU so is slower but renders a more spread-out graph.
The difference between the two force-based layouts is most apparent when working with larger graphs.
The hierarchical-layout option from the layout menu located at the bottom right-hand corner of the scene, presents the nodes in the Scene in an hierarchical order instead. The nodes are then arranged by the directionality of their relationships, determined by the way relationship directions are set up in the database. When the hierarchical layout is activated, you can change the orientation with the edit-button directly to the right of the layout menu.
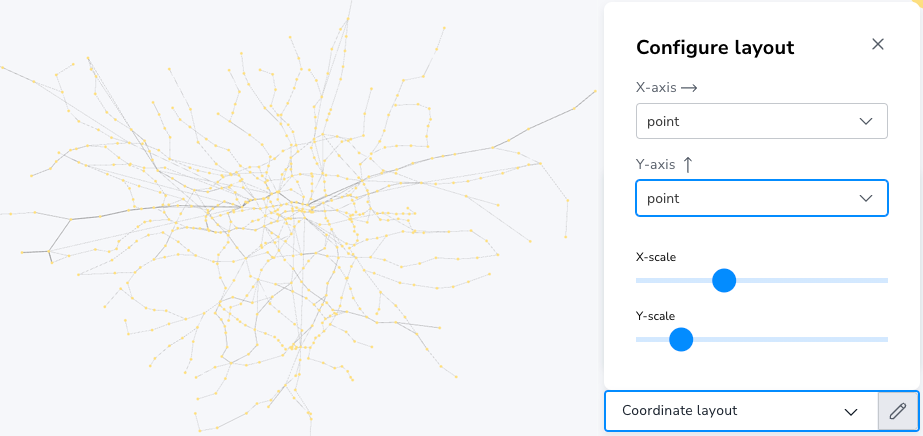
The third option is the coordinate layout and it arranges, and fixes, the nodes on the scene by their integer, float, or point type properties (provided that the nodes have them) and is used for geographical entities for example.
You can select which node property to use from the dropdown menu.
If no property is selected for the x-axis, Bloom automatically looks for any point property and if no such property exists, it looks for any property named latitude, then lat, and then x.
For the y-axis, the order is: point, any property named longitude, long, and lastly y.
If some nodes already in the Scene do not have applicable properties when switching to the coordinate layout, they are placed on one side.
Only properties with numerical values are available, i.e. not string properties.
For point properties, both two-dimension Cartesian and geographic (longitude and latitude) points are supported.
When geographic points are used, Mercator Projection is used as the map projection.
You can scale both axes to find the right level of granularity for your dataset.
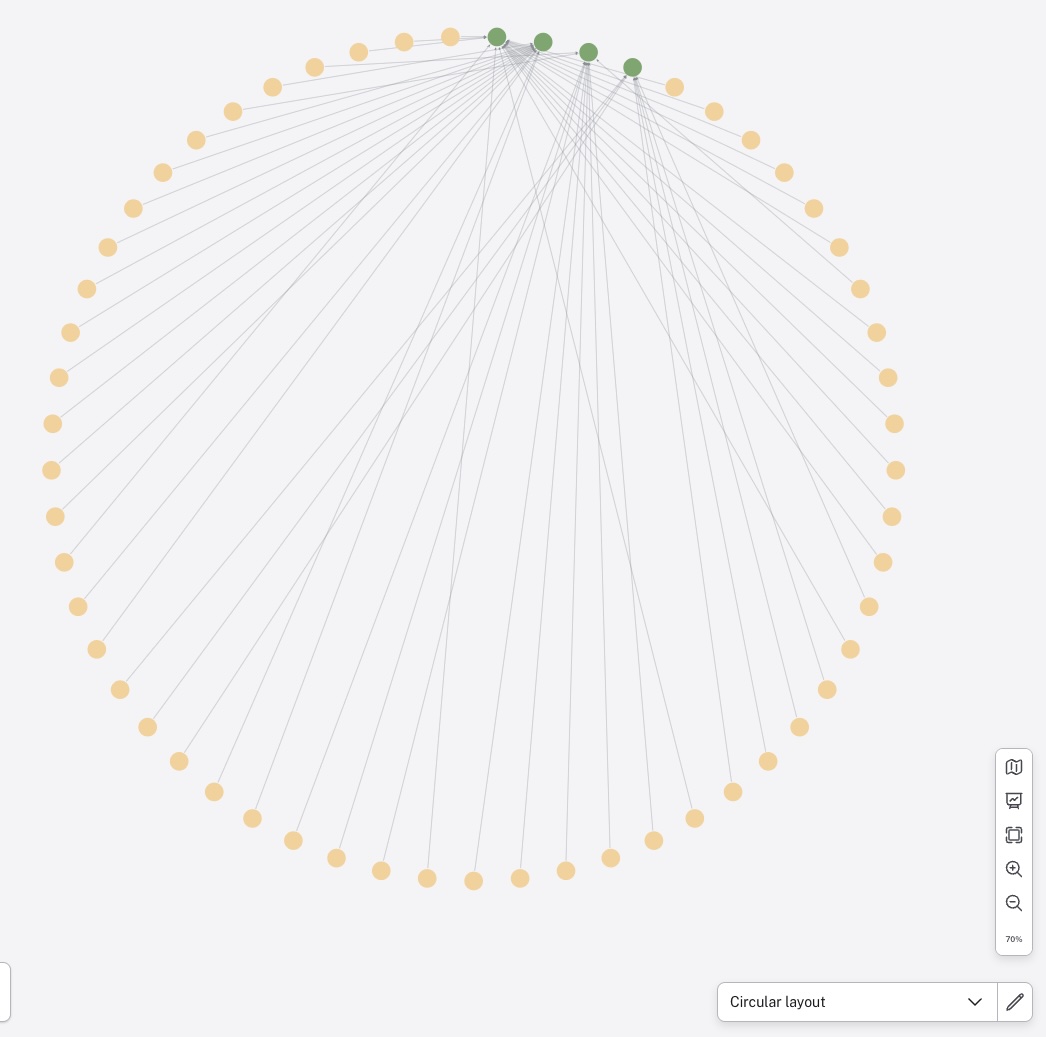
A fourth option is to display your results in a circular layout. This can be useful when you want to highlight centrality for example, is any node more connected than others in the same category?
The best choice of layout depends on many factors but mainly on the structure of your data and the nature of your queries.
If you want to go back to the force-directed layout, just select the force-based layout from the layout menu.
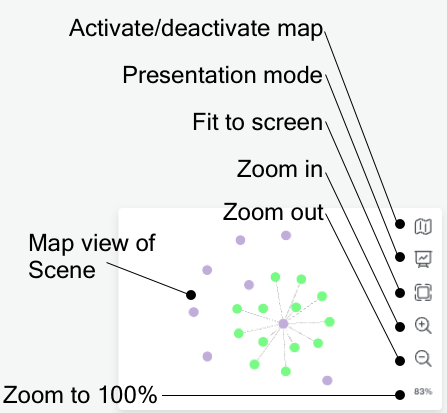
Map
The map is located in the bottom right corner of the scene and gives you an overview of the entire scene. It helps you navigate, especially when your graph is large and/or when your nodes contain a lot of information and you often need to zoom in and out to view.
The map shows all the nodes present in the scene, as well as the currently visible selection and where this selection is located in relation to the whole scene.
It allows you to pan the Scene by dragging the box that contains the current selection, you can zoom in and out using the + and -.
Presentation mode hides the search bar, legend panel and other elements to take the current Scene into full screen. If you need the legend panel while in presentation mode, use the arrow-button to expand.
Your current zoom-percentage is shown and by clicking that number, you reset the zoom to 100%. In addition, you can select to fit the entire graph to the screen or hide the map.
Filtering
When you have a Scene full of nodes and relationships, it can be difficult to identify exactly the sub-graph you need.
Applying a filter can help you fine-tune the results from your Search phrase and help you find what you are looking for in your data.
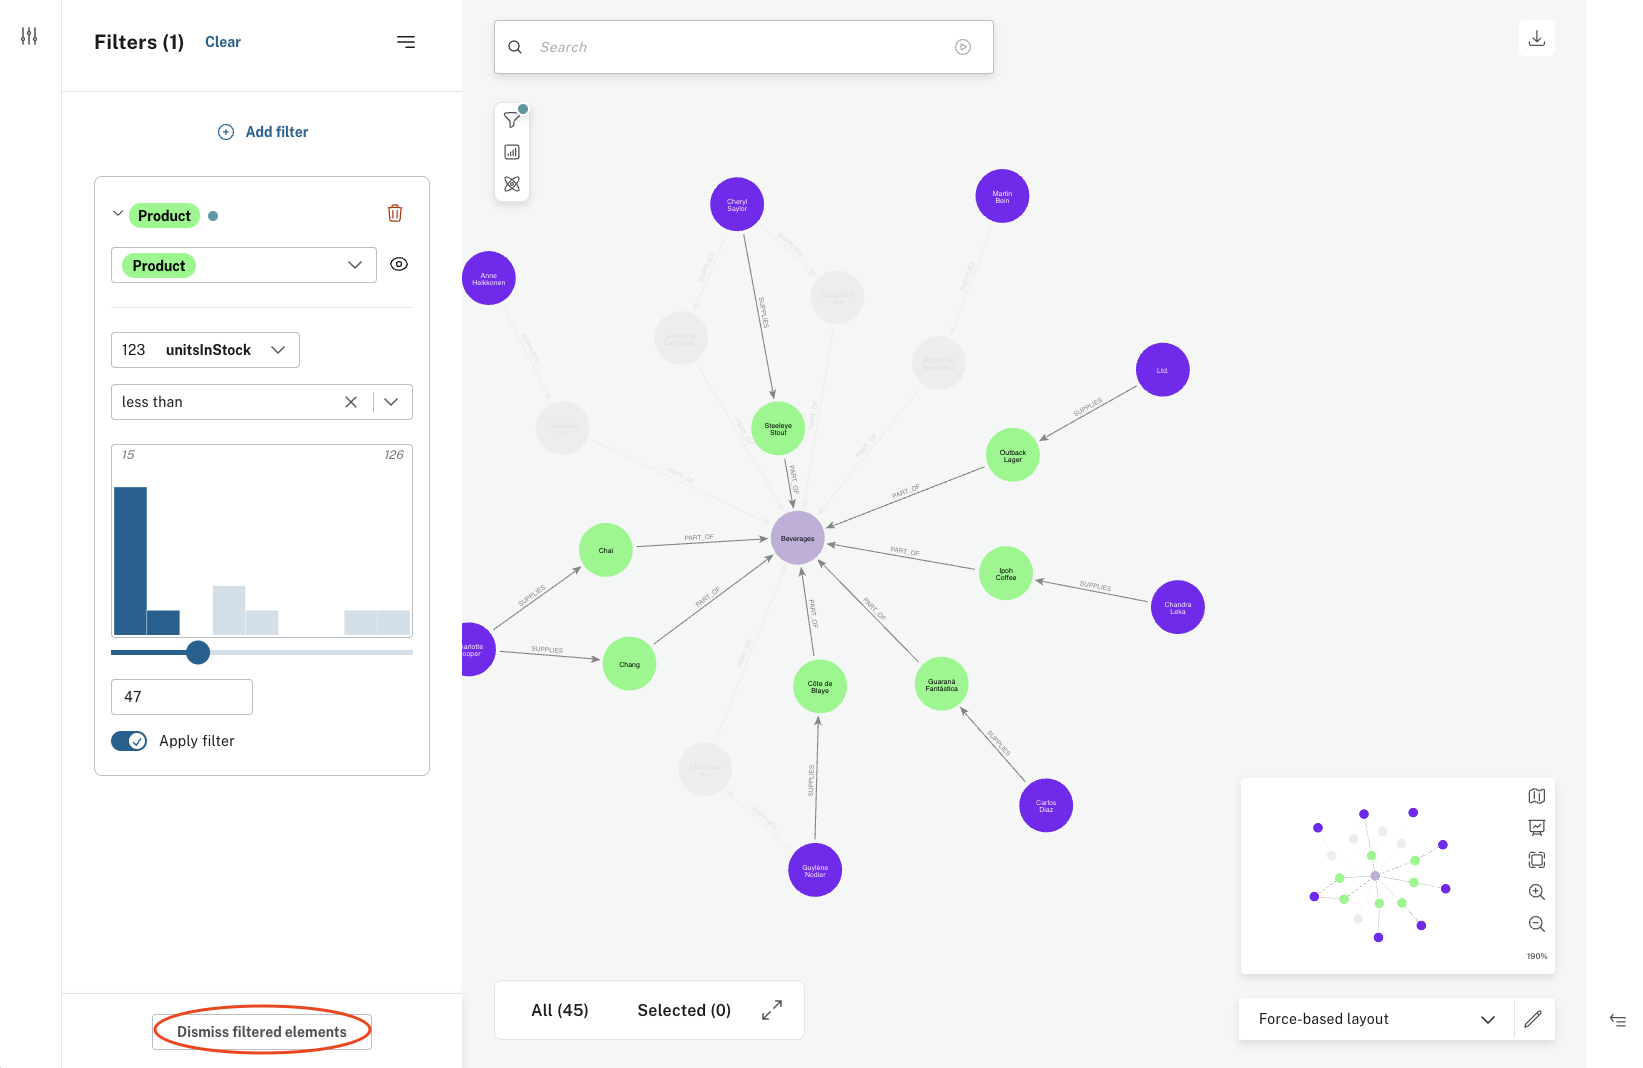
When a filter is applied, all filtered elements are greyed out in the Scene, they are still visible but you cannot interact with them.
You can also completely remove the filtered elements from the Scene, by using the Dismiss Filtered elements.
Filters can be accessed from the Filter drawer and are created based on the elements present in your scene, their categories, types, and properties. The filter can be as coarse or as fine as you like and applies to affected elements in your scene. Filters are not saved, so when the scene is cleared so is the filter panel. If you want to save the results of a filter, you can export the scene instead.
To start, you select the node category or relationship type to base the filter on.
At that point, you have the option to filter out all other categories present in the Scene.
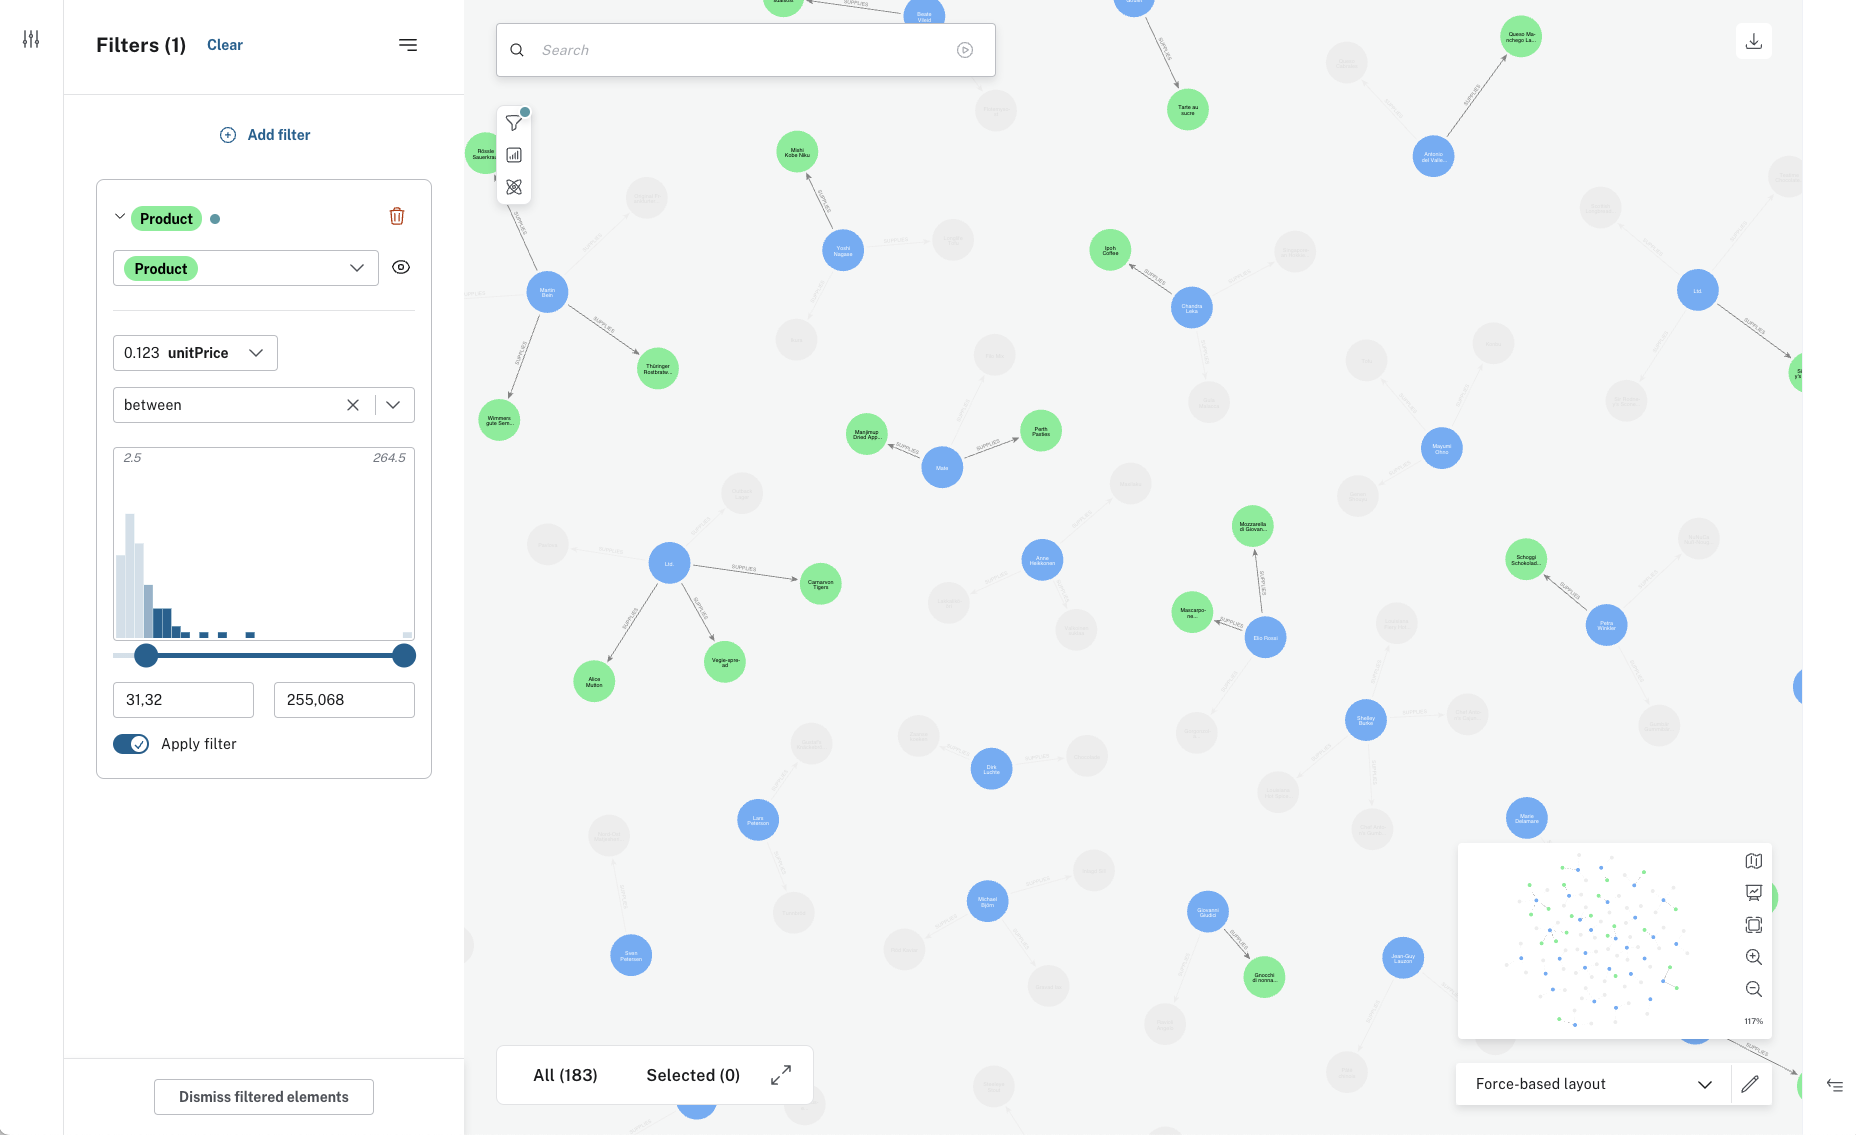
For more fine-grained filtering, you can further specify properties to filter on.
Filtering is supported for integer, float, boolean, string, Date, Time, LocalTime, DateTime, and LocalDateTime properties.
If the chosen property is numeric, a histogram gives you an overview of the values present in the current Scene.
The slider(s) allows you to set value(s) for your filter.
When you are satisfied, you use the toggle to apply the filter.
You can create as many filters as you like, they remain in the Filter drawer until you delete them. When you have multiple filters, they are collapsed in the drawer and you click on them to expand them and see their details.
Filtering on temporal properties
If your data contains temporal values, either on nodes or relationships, you can filter on these properties. Bloom’s support of temporal value types is aligned with the types supported in Neo4j. For more information, see the Cypher Manual → Temporal (Date/Time) values.
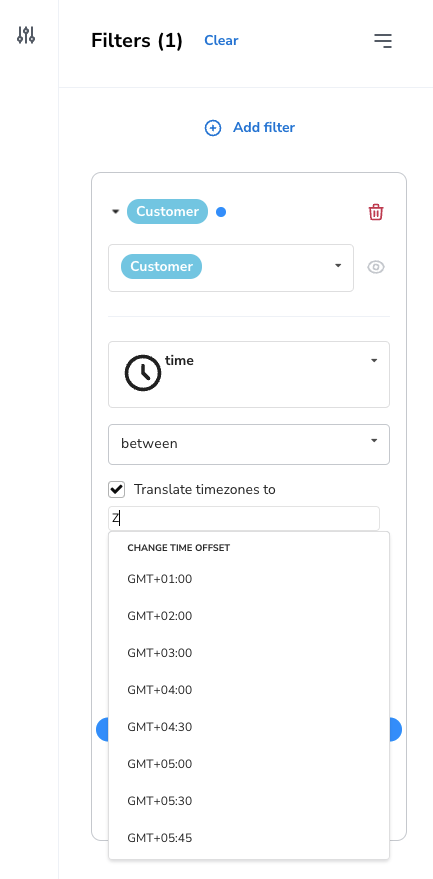
Timezones are supported for both Time and DateTime values.
You can configure your filter to use local time, ignoring any timezones, or to normalize to one time zone.
If you check the box Translate timezones to, you can select which timezone you want to use as your normal, based on your region.
(Note that Z indicates Zulu timezone, ie. GMT, time offset +00:00.)
Editing in Bloom
If you have the required write permissions to your graph database, you can edit your graph data in Bloom. You can edit labels and properties as well as create new nodes and relationships directly from your scene. For more information, see Edit graph data.