Quick start
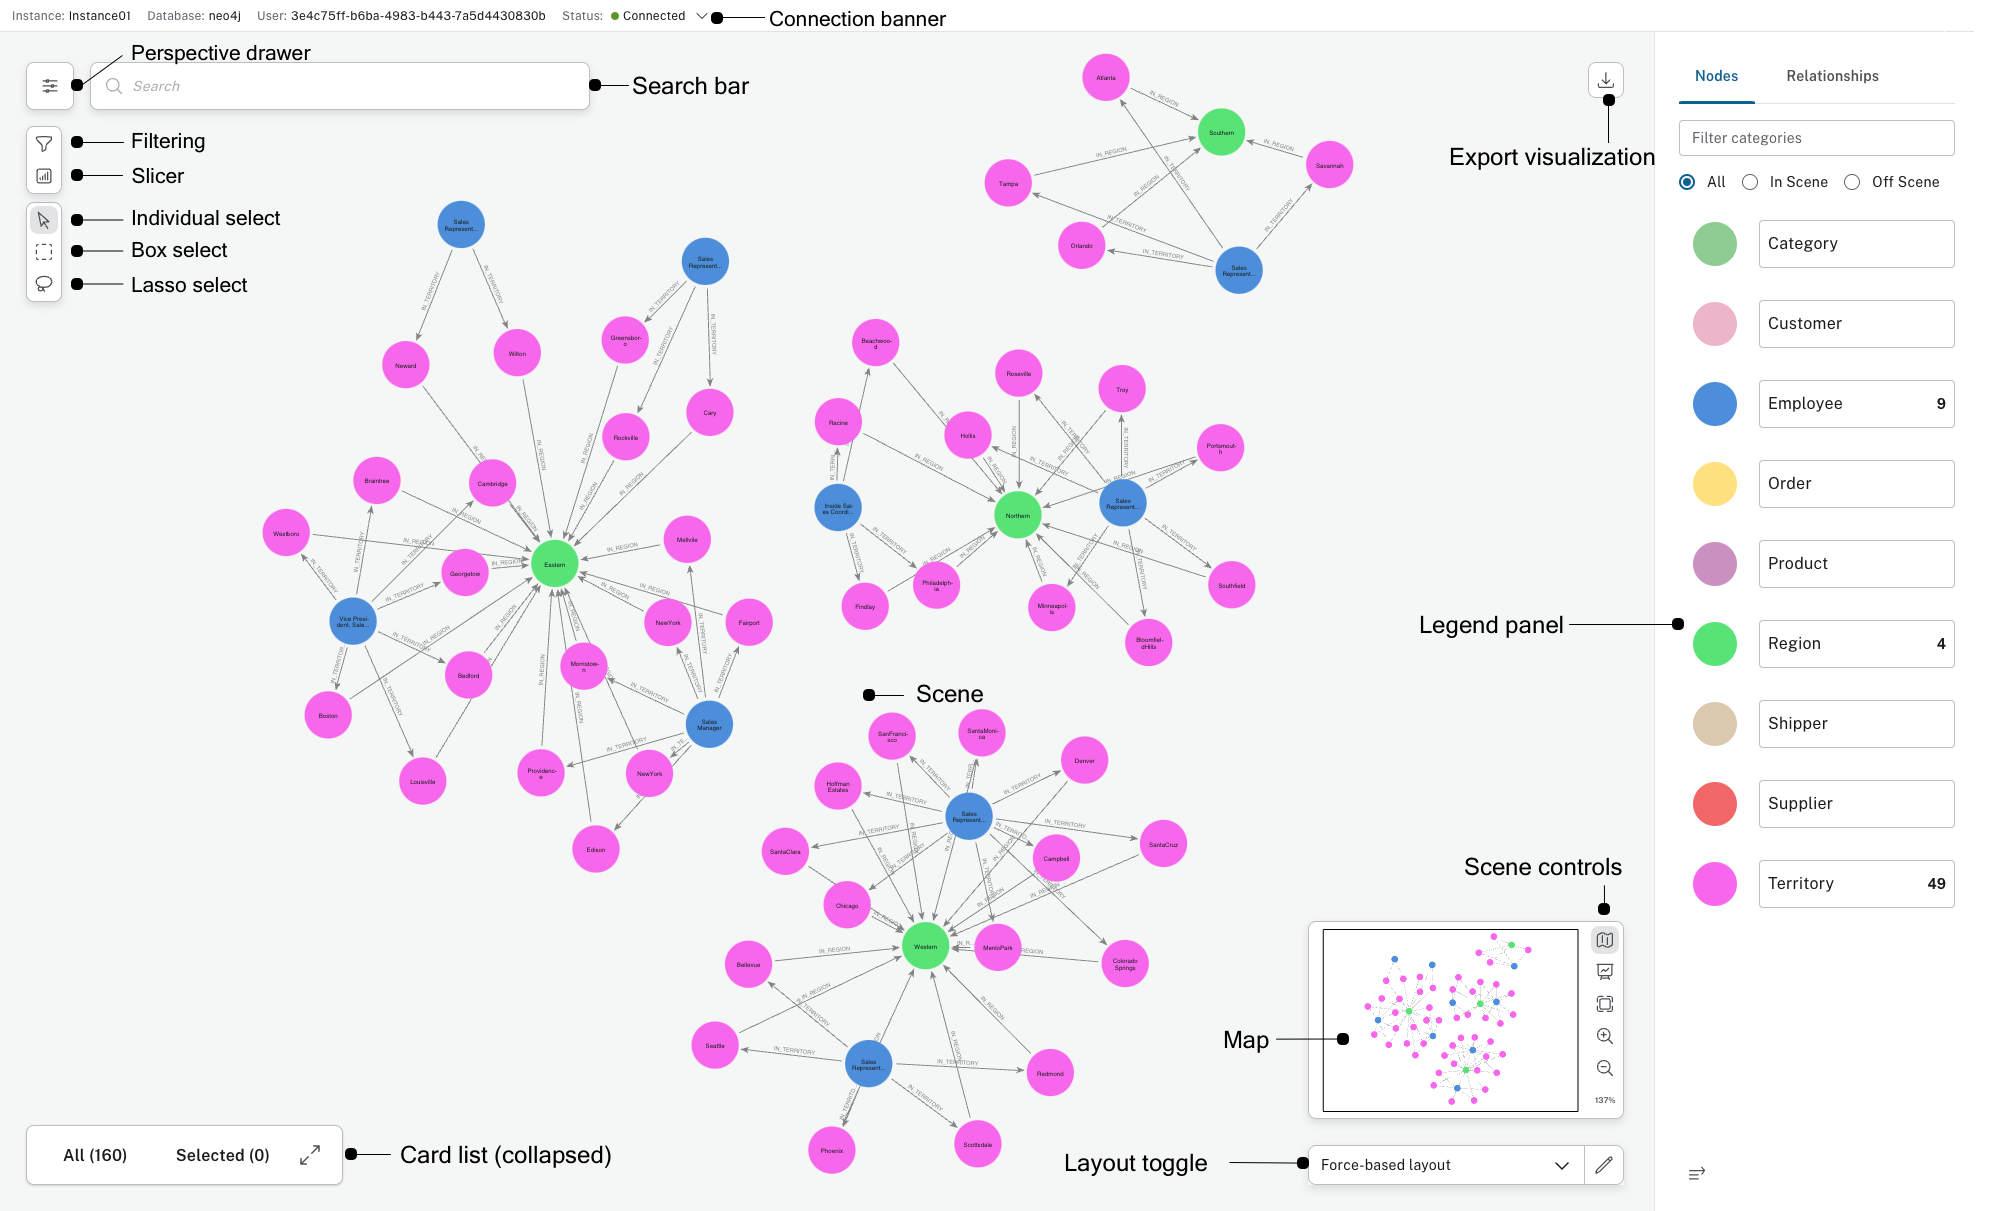
Explore is designed to be simple and intuitive enough for a business person or knowledge worker to pick up and use. Follow these quick start tips if you would like to play with the interface on your own before returning to this guide to learn about the more advanced and nuanced features.
You need an active connection to an instance that contains data, one of the example data sets works. Additionally, Explore needs a Perspective as a business view of the graph to which it connects. The first time that Explore connects to a graph, it shows a selection of already defined Perspectives or, if you have the access rights, offer to auto-generate a new one. Auto-generation is a good place to jump quickly into graph exploration. Keep in mind that a complete scan of the database will be performed when you auto-generate a Perspective and if your database is large, this can take a long time. In that case, you may opt for a quick scan instead. See Database scans for more information.
Graph exploration begins by searching for interesting parts of the graph.

Start by searching
By loading the Northwind example data set, you can start interacting with the graph right away. If you need help loading the dataset, the process is described in detail here.
Once loaded, try searching for:
-
everything in a category, like Products.
-
particular things in a category, like Products with productName _Louisiana.
-
qualified patterns, like Suppliers of Products with productName Louisiana.
-
long patterns, like Customer purchase details about order for product with productName Louisiana.
-
generic patterns, like Categories of Products with Suppliers.
|
For faster search performance, it is highly recommended to set up indexes in the Neo4j database for all properties that should be searchable in Explore. See Cypher Manual → Indexes. |
Interact with the visualization
With a currently displayed graph visualization you can:
-
zoom in and out using the buttons or scroll using a mouse or touchpad.
-
double-click a node to see details.
-
right-click to bring up a context menu and try the available options.
-
short press click in an empty spot and drag to pan the visualization.
-
use the marquee tools to select nodes and relationships in the visualization.
-
click on the legend panel to select / deselect all nodes in a category.