Result frames
There are three ways to view data in Neo4j Browser. All queries that you run in the Cypher® editor populate a reusable result frame. Query results are rendered as:
-
Graph — graph result frame.
-
Table — table result frame.
-
RAW — code result frame.
-
Plan — execution plan frame.
You can switch between those with the icons on the left side of the result frame. The results can be downloaded and exported in various formats depending on view, as described below. The download button is located in the upper right corner of the result frame.
|
Queries that return only tabular/scalar data cannot be visualized as a graph. The results are returned in table and RAW view only. |
Graph result frame
The graph visualization functionality is designed to display a node-graph representation of the underlying data stored in the database in response to a given Cypher query. Nodes are represented as circles and relationships as lines and is especially useful for determining areas of interest or quickly assessing the current state and structure of the data. Graph view results can be downloaded as PNG.
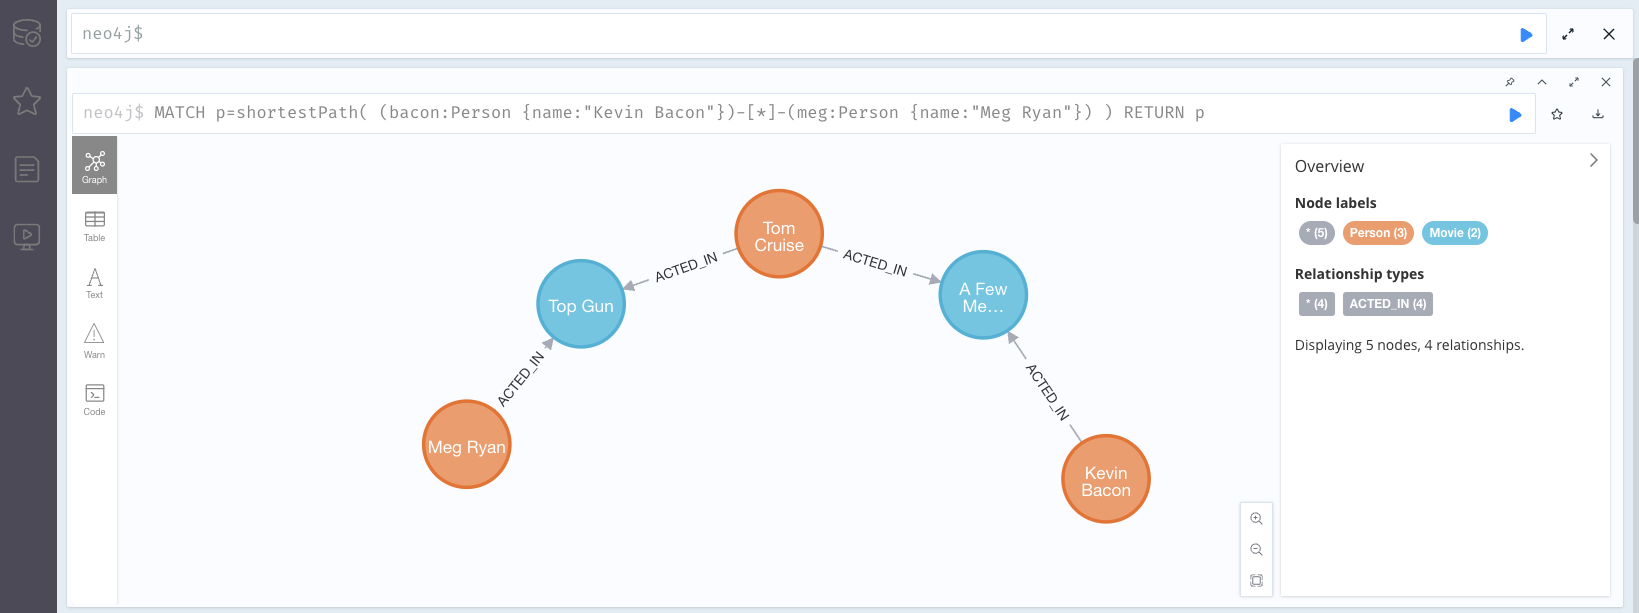
Tips when using the Graph view:
-
Use the controls in the bottom right corner of the frame to zoom in and out of the visualization. Additionally, you can zoom using trackpad zoom gestures or a mouse wheel in combination with a modifier key. (If you are in full-screen view, the modifier key is not needed to zoom.) On Mac, use
⌘ + scrolland on Windows and Linux, useCtrl + scrollto trigger zoom. You can also use the Fit to screen button to fit all query results into the view. -
Expand the Cypher editor area with the
 icon next to the play button in the editor.
 -
Select a node or a relationship to view its properties. The nodes already have sensible captions assigned by the Browser, which auto-selects a property from the property list to use as a caption. To change how your graph looks, see Browser styling.
-
Right-click a node to expand (see its neighbors), dismiss it from the visualization, or unpin it. If you double-click a node, you automatically expand it, and if you double-click it again, you undo the expansion. If you right-click a relationship, you can dismiss it.
-
Right-click in an empty spot allows you to show all relationships between elements in the result frame or to undo your last ation with the visualization.
-
If you cannot see the whole graph or the results display too close together, you can adjust by moving the visual view and dragging nodes to rearrange them.
Table result frame
The Table result view displays the result in a tabular format. For queries that return only tabular data, only the table and RAW views are available. Table view results can be downloaded as CSV or JSON, and additionally you can copy both CSV and ASCII table to your clipboard.
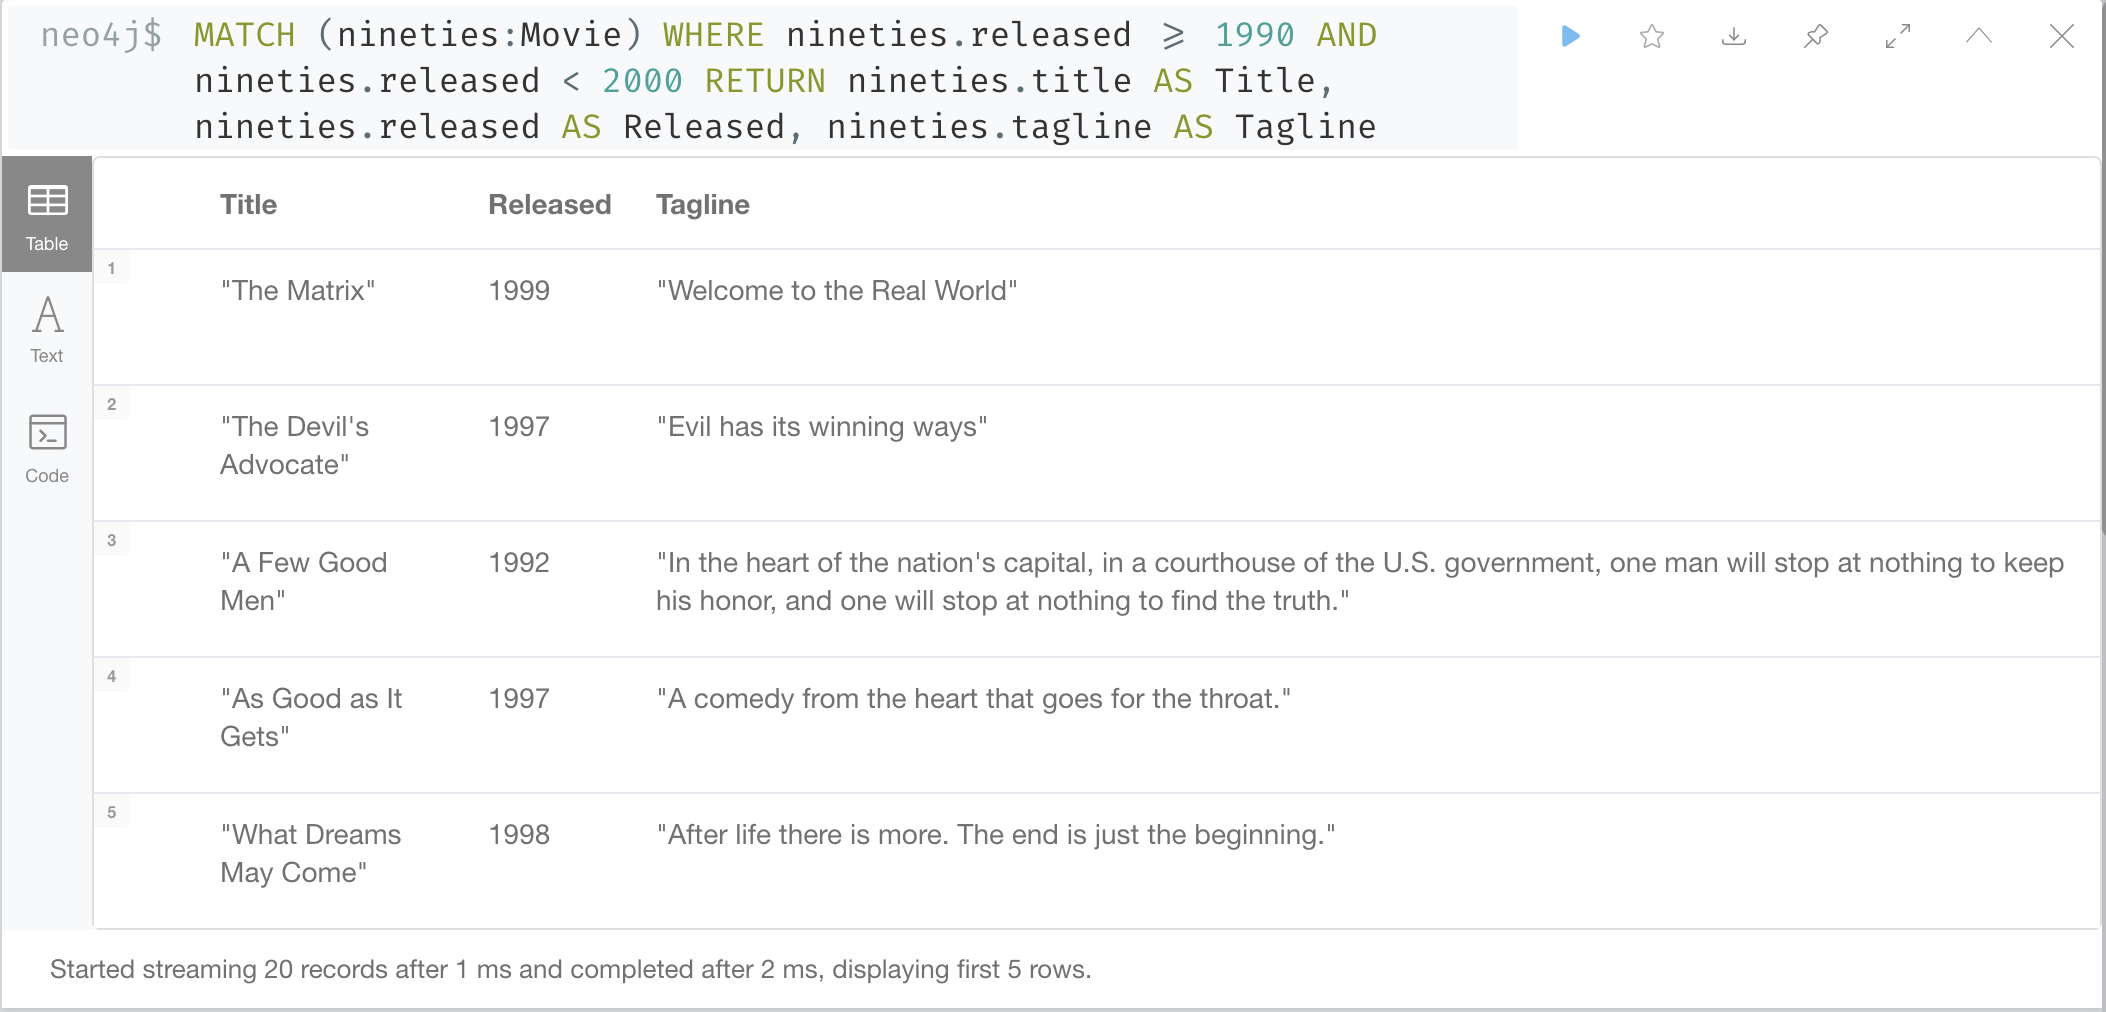
Tabular results can be pretty-printed, filtered or downloaded using the buttons in the upper right corner of the result frame.
|
Filtering only filters on the returned results and is thus limited by the query and/or record limit (set in the Settings drawer). |

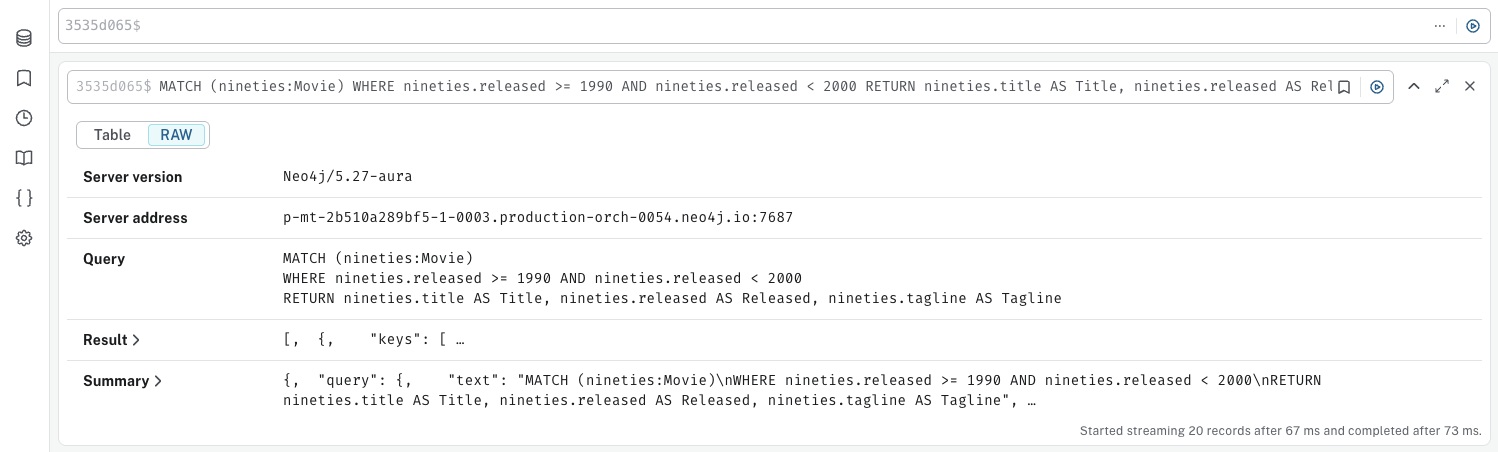
RAW result frame
The RAW result view displays the submitted request, the Neo4j Server version and address, and the response. RAW results cannot be downloaded.
Plan view
The Plan view is available for EXPLAIN and PROFILE queries and shows the execution plan for the query.
For such queries, you can also toggle to view the results in a RAW format.

Query execution time
Each result frame, regardless of view, displays the time it took to execute the query and the time it took to return the results. For example, Started streaming 20 records after 67 ms and completed after 73 ms. means that:
-
The query resulted in 20 records.
-
It took 67 ms for the first record to become available.
-
It took 73 ms for the entire operation, from execution to returning the last record. And thus it took 73-67= 6 ms to stream all 20 records.