How EcocomityChain.AI maps supply chains eight tiers deep on Neo4j
EcocomityChain.AI built a supply chain intelligence platform with resilience as an important premise on Neo4j that follows a product from finished assembly down to the ore. Its aim: give manufacturers weeks of warning instead of days.
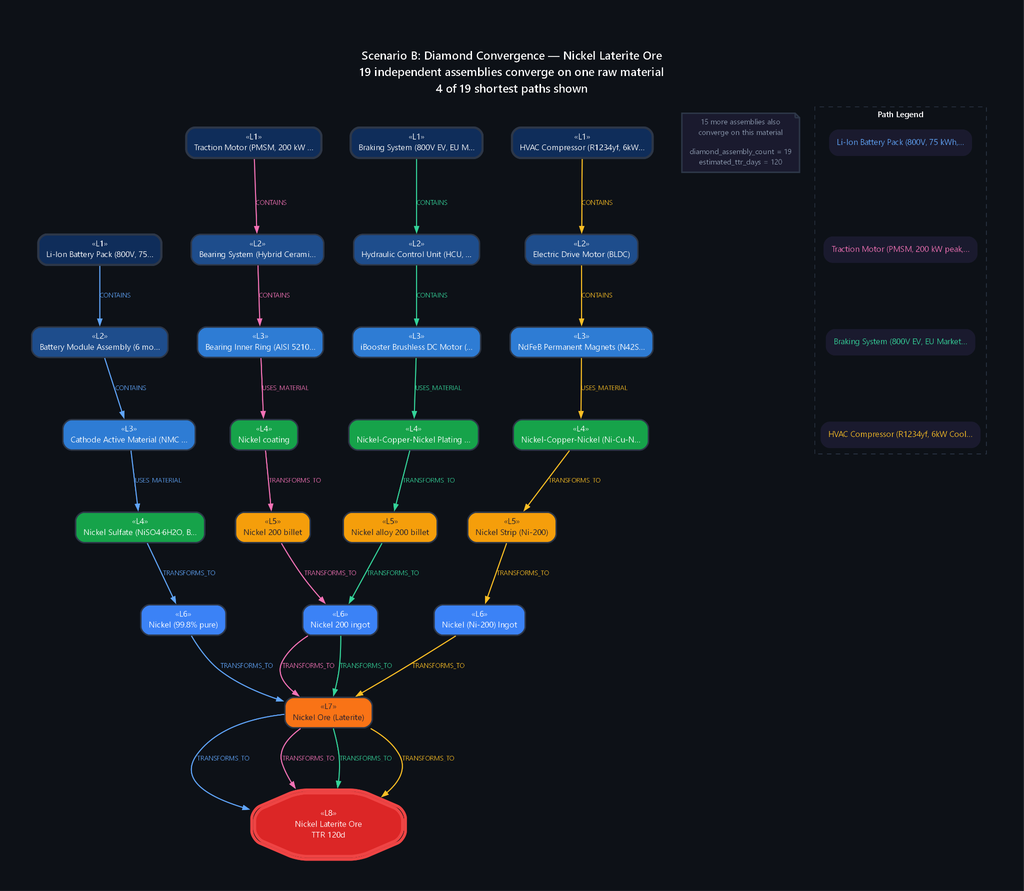
A traditional bill of materials (BOM) roughly tells you what a product is made of. It lists parts and sub-parts down to level three or four, then stops. What it can’t tell you is where the trouble hides: the rare-earth ore seven tiers down that feeds four independent assembly paths at once. The single supplier whose disruption cascades across nineteen assemblies, the material whose chemistry ties it to a geopolitical constraint you never modeled.
That blind spot has a cost. Ask a manufacturer running just-in-time production what happens when a deep-tier supplier goes down, and they find out two weeks before the line is scheduled to run. There’s no time to find a second source or to reroute, no time to do anything but pay. During recent shortages, a single wafer that normally costs under a dollar had to be bought for $143.
EcocomityChain.AI built PMG (Product Material Genealogy) to close that gap. It’s a supply chain risk intelligence platform built on Neo4j that maps a product from finished assembly down to the ore at the source, and scores risk at every node along the way. This is the story of why they built it on a graph, and what that makes possible.
The problem: you can’t manage what your data model can’t see
Deep-tier risk is hard to see for two reasons: the first is organizational, and the second is technical.
The organizational risk is silos. At large enterprises, one department might not know what another is doing. Each team optimizes its own slice and no one owns the full lifecycle from raw material ordering to final delivery. When resilience is everyone’s concern and no one’s job, it stays a slide in a deck rather than something you can act on.
The technical risk runs deeper. Model a multi-tier BOM in a relational database and you hit a wall fast. Relational schemas want you to know the depth of your supply chain in advance, and real supply chains don’t work that way. Try to represent variable-depth, heterogeneous parts and you end up with a seven-way join or a polymorphic table stuffed with type columns that strips the data of any real meaning. So teams do the rational thing and stop early, at L3 or L4. The chemistry, the ore, the cross-tier dependency, the geopolitical exposure buried in the genealogy: all of it falls off the edge of the model.
Put those two together, and you get manufacturers who can’t reliably answer a basic question: are my suppliers beyond tier one actually resilient? Under the old approach, they’d learn the answer one or two weeks before a production run, with no runway left to do anything but fall back on a worse, more expensive plan.
Why EcocomityChain chose a graph
A supply chain is a network. Materials connect to suppliers, suppliers connect to assemblies, assemblies roll up into products, and the same rare-earth supplier can sit underneath a dozen unrelated parts. That’s a graph, whether or not you store it as one. Force it into rows and joins and you spend your effort fighting the model instead of asking questions of it.
Neo4j stores that network natively. Variable depth, mixed node types, and cross-tier links are what a graph is built for, so EcocomityChain.AI could model the full genealogy instead of truncating it. PMG maps eight levels, from final assembly (L0) down to raw materials and ores at the source (L8), and holds hierarchy edges and supply edges in the same graph. A single traversal renders the whole picture. In their modeled European battery-electric-vehicle supply chain, that’s 266 supplier entities at the base and thousands of nodes flagged Critical or High, connected in ways a tabular model simply can’t express.
Storing the network as a graph is what makes the hard questions answerable:
- Deep-tier dependencies become visible. A Tier 7 ore supplier feeding multiple independent Tier 2 and Tier 3 paths shows up as an actual pattern in the graph, not an inference you have to reconstruct by hand.
- Single points of failure fall out of a query. Finding a supplier or material that sits on two or more independent downstream paths (a “diamond”) is a multi-hop pattern match in Cypher, run across the full product graph in real time. In the modeled BEV chain, PMG surfaced 99 convergence nodes rated Critical or High, with a dominant risk corridor from the USA to Germany.
- Structural risk gets named for what it is. When the niobium ingot turned up as a shared ancestor across 19 separate assemblies, PMG scored it 1.00 out of 1.00 on structure alone. The topology is the driver: one disruption propagates to all 19 assemblies at once, with no independent recovery path.
- Risk scoring stays explainable. Every node carries a score built from independently weighted vectors: dependency impact from the graph structure, plus financial health and geopolitical exposure from external intelligence. Every contributing signal is human-readable, so the platform produces no unexplained numbers.
The same model even carries trade risk. Tariff state, regime classification, and financial exposure live as properties on the material node, so a question like “what’s our worst-case tariff exposure on this magnet chain?” is a graph query rather than a separate pipeline.
The result: two weeks of warning becomes six
All of this buys one thing: time.
When you can traverse the genealogy and see disruption forming several tiers down, you stop finding out one or two weeks before a production run and start getting notified three, five, or even six weeks ahead. That’s the difference between reacting and responding. With six weeks, you can evaluate alternative suppliers, reroute, request a certificate of origin to resolve a tariff exposure, and bring operations back to normal before the shortage ever reaches the line. In two weeks, you pay $143 for a one-dollar wafer.
It gives leaders the elevated view they’ve been missing, too: one place to watch the whole life cycle, from raw material ordering to final customer delivery, instead of a dozen departmental dashboards that never quite line up. Resilience stops being theoretical when everyone is looking at the same graph.
What comes next
EcocomityChain.AI is building PMG around three things: a control tower that gives every stakeholder a lifecycle-wide view, proactive disruption alerts that push the warning window further upstream, and structured response playbooks so teams act on early warnings instead of scrambling.
Deep-tier BOMs break relational models where a graph holds them natively. That’s why PMG runs on Neo4j, through the Neo4j Startup Program.
Building something that maps messy, deeply connected data? You can start for free on Neo4j AuraDB. And if you’re an early-stage startup like EcocomityChain.AI, apply to the Neo4j Startup Program for credits, technical support, and go-to-market help.
-
 Google Cloud Platform
Explore more