A tremendous amount of database science is devoted to the fine art of “normalization” – making your data easier for their databases to digest. Time to ask yourself: Who does normalization actually serve?

Graph computing solves problems. It solves them by modeling those problems using symbols folks can readily understand, and then mapping graphs to data in a sensible, straightforward manner.
It’s not always easy to throw a party around the ideal of “sensible” and “straightforward” – or if we want to go even deeper, “normal.” If anyone’s ready to throw a party to celebrate a big problem being solved, it would probably be, “Hey, gasoline’s back below four bucks a gallon. Hooray!”
What might be genuinely exciting about graph computing – especially compared to other indisputably exciting things like the onset of summer and the cancellation of The Celebrity Dating Game – is that graph computing solves more problems than it creates. Getting to that point of excitement with graph databases requires something of a breakthrough. It’s when folks finally comprehend that graph is a methodology, not a visualization.
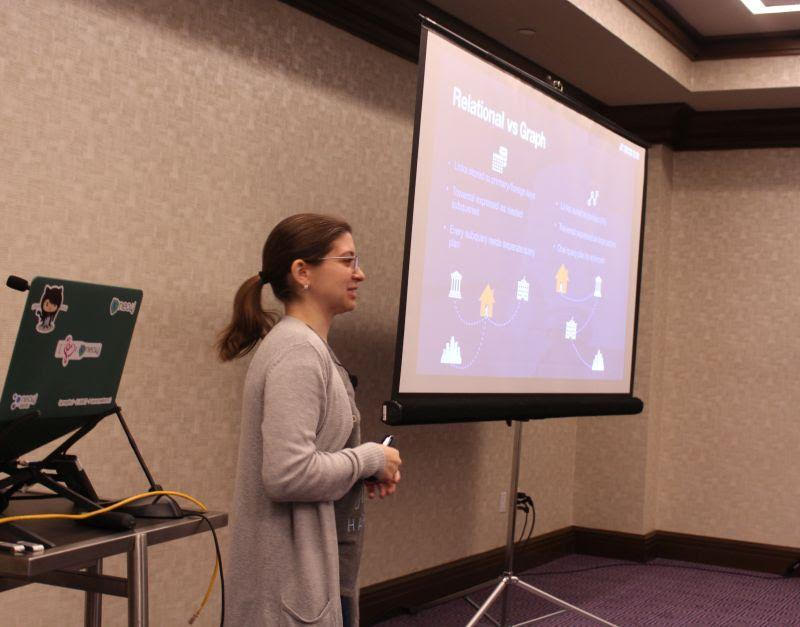
“There are cases where we have Neo4j running as the transaction system,” explained Jennifer Reif, a Neo4j engineer and developer advocate, in response to an attendee of her graph computing workshop at GraphConnect 2022 in Austin, Texas. Reif’s declaration may not have been what this attendee expected to hear. Surely, he told her, the graph data model must be a re-envisioning of the “real” data model someplace underneath. Isn’t Neo4j a graph visualization tool, and a traditional database system the real transaction system?
No, Neo4j is the database, and it starts with the graph. That’s where folks’ notion of “normal” – based on six decades of batch transaction processing – may begin to decompose.
Normal From the Start

“Graph databases arose from this need,” Reif explained. “No other solution out there existed for what they were trying to solve. You’re still going to get a tradeoff (with graph). You have the compute intensity of relational databases, and you have storage and memory consumption of document databases. What graph databases wanted to do was mediate a little bit of both of those. They wanted to make both of those – compute and storage – as efficient as possible.”
Accomplishing this, she told her audience, involves a departure from the typical database processing route of normalization.
Normalization is something that’s taught to newcomer data engineers and data scientists as the principal technique they must all employ to protect and support the integrity of their databases.
“For example,” explains a page of Microsoft’s documentation on SQL Server, “consider a customer’s address in an accounting system.” That person’s address wouldn’t need to be replicated into the table for every customer transaction; rather, you’d use a foreign key in the transaction table that maps to a primary key in the customer table. That way, it’s easy to join customer records with transaction records.
That’s the Second Normal Form. Common sense database management. Everyone knows that, right? This is where things get curious for folks: “Normalization,” as we’ve come to call it, is necessary for a tabular, relational database because it removes the number of steps necessary for it to reassemble data that is included in relationships.
In a graph database, you don’t need to reassemble data to produce relationships, because the relationships are already integral to the structure of the database. Up until now, the whole idea of so-called transactional databases espoused separation as necessary for transactional efficiency.
So you can’t blame this fellow for being just a little astonished that the path to graph efficiency involves stepping away from what we thought was normal. After all, building relationships into transactional, relational data requires you to employ JOINs and UNIONs that are explicitly described as “de-normalization.”
The Downside of “Nice Little Tables”
According to software developer site RubyGarage.org, you denormalize tabular data for three reasons: to make it easier to manage, to improve performance, and to make reporting easier.
“The good thing is,” writes “Medium” contributor Kate Walters, “normalization reduces redundancy and maintains data integrity. Everything is organized into nice little tables where all the data that should stay together, does… But, much like the downside of Rails, normalized databases can cause queries to slow down, especially when dealing with a (insert Nixonian expletive for a very large amount) of data. This is where denormalized databases come in.”

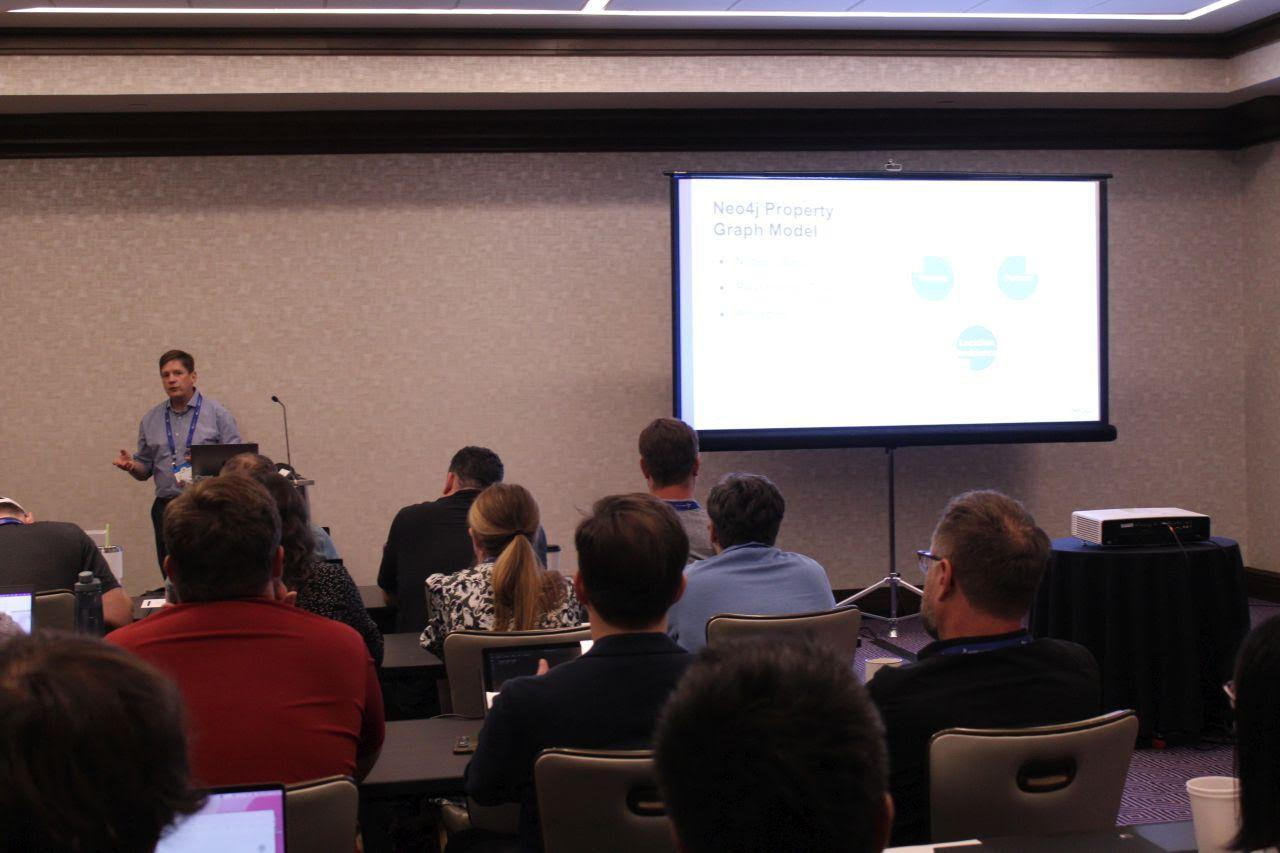
“If you’re in a relational database, you think about denormalization,” remarked David Lund, a Neo4j software engineer and technical trainer, “which is putting more columns and things into a single record. It’s costly to read that database record. You put more things in there, so you have to do less database hits.
“The exact opposite is true in a graph database,” Lund continued, speaking at GraphConnect 2022. “It gets to how stuff is stored, and how you’re going to access it. Any property that’s inside a (graph) database is always attached to a specific node or a specific relationship. Internally, it’s stored as a linked list. So the first property internally points to a node object… We only have a handful of objects in a database, and they’re all fixed sizes.”
Think of that central, fixed-sized node as an anchor. Because properties are stored as linked lists pointing to that anchor, all those properties are accessible as though they were already joined. The result is the phenomenon of index-free adjacency, which isn’t so much an invention as a discovery. Essentially, if all properties are connected to one node, they’re all already adjacent to each other.
“That’s what index-free adjacency is,” said Lund. “Everything’s connected to everything. In a relational database, you denormalize the database. You’ve got to free up all that space, and periodically you’ve got to condense that down and get that space (even more) free. We don’t ever do that. If we did that, it would screw up all those pointers, and it just wouldn’t work.”
So to review: To ensure integrity, we break up data to normalize it. Then to promote expeditious transactions, we crush that integrity to death with UNIONs and JOINs to de-normalize it. And then (you knew this was coming) to aid in reporting, you normalize the result again.
Unless… your aim is to federate data from different sources into a single map. As our friends at Stardog noted, once you join the reports or end-products for transactions involving denormalized data, the results are, not surprisingly, not normal. In other words, since you reintroduced redundancies into your data tables to expedite transactions, fusing those non-normal tables together must result in a non-normal conglomerate.
The solution, we’re told, is to re-normalize the denormalized aggregate. In fact, as TechTarget’s George Lawton tells us, there’s an entire enterprise already built up around configuring enterprise-wide data fabric schemas – a process being marketed to companies as “holistic data management.”
Hopefully you’re not getting seasick from all this normalization.
“You don’t have to denormalize your data,” Reif explained at GraphConnect 2022. “You don’t have to sacrifice your memory, and you don’t have to sacrifice your CPU intensity.”
The New Fabric of Space and Time

“What does fabric enable you to do? It enables you to execute queries in parallel across a series of graphs,” explained Stu Moore, product manager for Neo4j core database, speaking at GraphConnect 2022. “Those graphs could be federated graphs – that’s where you’re trying to combine the business value of multiple business systems together.
“It could be to operate at greater horizontal scale,” Moore continued, “essentially by taking one multi-terabyte database, breaking it off into hundreds of gigabytes, and making it more manageable, easy to back up, and to restore. That’s sharding. And it also enables hybrid cloud queries. So you’ll be able to query across Aura instances and Neo4j database instances as well.”
What Moore is describing is fairly analogous to the goal of data fabrics with more conventional data models. However, noticeably absent is an entire industry that leverages the verbal equivalent of fanfare and timpani to compel users into re-normalizing already denormalized data sets – something folks should be doing anyway, if the architecture was practical to begin with.
The picture one vendor in particular paints of the ideal of data fabric presents the concept as a stitched-together single view of all interrelated data across an organization. It incorporates elements from data lakes, data warehouses, and relational data stores. This vendor distinguishes data fabric from data virtualization by presenting the latter as a means of pulling together metadata from various sources, to give a data client the view of a stitched-together composite without actually having to do so. A fabric, this vendor says, utilizes a knowledge store to generate a kind of graph that explains the results of all the stitching.
This vendor then goes on to assert that a proper data fabric requires, at its outset, a data fabric architecture. However, the components of this fabric may be loosely coupled, like a sandcastle whose ideal form isn’t meant to be attainable through structure and physics, but rather by piling things onto each other until they attain the desired shape.
Not surprisingly, then each enterprise ends up with something of a bespoke architecture, a unique creation unto itself.
Other vendors go even further with this notion, suggesting “smart” architectures enable very loosely coupled components to resolve themselves pretty much at will, through processes that no doubt blend normalization with denormalization. Machine learning systems could be employed at some point – they suggest to determine which architectural adjustments may be appropriate for future moments.
Ever notice how “smart” tends to be used as a marketing moniker for systems whose design supposedly doesn’t really require “smarts,” but rather just magically falls into place? “It looks like that would work,” you tell yourself. “Something somewhere must be really smart.”
The final artifact that represents the present state of this data fabric for an organization is usually a knowledge graph. It’s a simple, diagrammatic, and for everyone at Neo4j, strikingly familiar way of depicting the relationships between data entities derived from such a variety of sources.
What becomes obvious at this point – perhaps painfully so – is this emergent fact: Had this fabric architecture been constructed with a graph to begin with, none of this haphazard exchange of normalizations would even be necessary.
Put another way, it’s like a building construction effort that waits until the very last tile is laid before spitting out a blueprint, rather than use that blueprint to guide the building process.
Indeed, with Neo4j’s implementation of graph data fabric, the process of stitching graphs together seems almost unnervingly easy by comparison.
“The topology is stored, unsurprisingly, in a graph,” said Moore. This graph reveals at all times the locations of primary and secondary clusters, and is immediately updated whenever the fabric topology changes.
The First Normal Form
It’s fair to ponder the question – why weren’t databases built as graphs to begin with? There’s a logical and equally fair answer. During the 1960s and 1970s when the relational model was being created, the bandwidth did not yet exist to project database structures as dimensional, visual networks. Indeed, it was this exact deficiency that E. F. Codd attempted to solve when creating the relational model for IBM: a way to index data components more generally, so that changes to underlying structures no longer resulted in data inconsistencies.
The very first sentence of one of Codd’s most important treatises addresses this very problem: “Future users of large data banks must be protected from having to know how the data is organized in the machine (the internal representation).”
Codd went on to write, “Changes in data representation will often be needed as a result of changes in query, update, and report traffic and natural growth in the types of stored information.”
Codd was perfectly aware of the dilemmas database users were likely to face, as well as the nature of their solutions. He proposed “normal forms” as a way of representing elements whose connections were, for one reason or another, likely to change. It was the best solution… for his time. He either did not envision, or refused to give credence to, the notion that denormalization would become a necessary tool for stitching together normalized views.
So Codd wasn’t wrong, and relational isn’t bad. At cloud scale, however, it becomes limited, in a way that the graph model is not. There was a time when most of the world’s data was stored in Codd’s relational form. Now, it’s just dumped somewhere, sometimes called “semi-structured” – as if semi-structured meant anything more than unstructured.
In an era where it’s becoming more obvious to us that everything we see and know is related to everything else, it makes less sense to keep producing less data whose relationships can be attained through deconstruction, obfuscation, and denormalization.


