To detect fraud fast, analysts need to see a real-world view of the data. Visualizations help answer the key questions: Who was involved? Where and when did it happen? What assets do they hold? And most importantly, how are each of these details connected?
In this blog post, I use Neo4j and the other premium tools in GRANDstack to build a graph and timeline visualization app that drives fraud investigations.
Focusing on fraud in Wikipedia articles about 2020 U.S. election presidential candidates, we’ll explore why an anomaly detection platform featuring dedicated timeline analysis is an effective choice.
A network and timeline visualization app provides two powerful ways to analyze the same dataset.
Fighting Fraud in Wikipedia Articles
Wikipedia hosts 46 million articles in 300 languages and is accessed by 1.4 billion devices every month. The content is written and edited by over 200,000 people worldwide.
With such wide coverage and popularity and an open editing system, it’s no surprise that Wikipedia is prone to fraud. Most opportunistic vandalism is swiftly reverted by Wikipedia moderators, but premeditated and organized fraud poses a greater challenge.
One famous example is the 2015
OrangeMoody ‘conflict-of-interest’ case. Wikipedia blocked nearly 300 fake accounts (“sock puppets” or “socks” for short) for impersonating senior editors and extorting page subjects. It used a premeditated and complex editing strategy that developed slowly and cautiously, making it difficult to detect.
Fraudsters and investigators alike have access to the full revision history of every Wikipedia article. It’s available through the main Wikipedia site and the comprehensive MediaWiki API.
Revision history for Wikipedia’s page on the 2020 US presidential election.
We’ll use the MediaWiki API to feed the edit networks into Neo4j, then visualize them to detect potentially fraudulent behaviors.
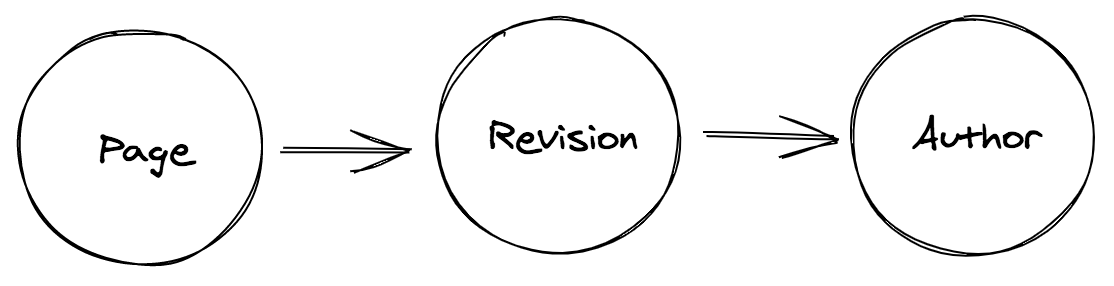
Basic Graph Data Model
For the Wikipedia graph data model I used timestamps on individual revision nodes that connect an author to a page. This makes it more easy and efficient to query time-based events and extract relevant graph subsets.
GRANDstack and Data Visualization Toolkit Architecture
I’ve
written before about how good Neo4j GRANDstack is at providing structure to application development, thanks to rock-solid tooling from Neo4j, GraphQL, React and Apollo.
The framework I used also features two JavaScript libraries from Cambridge Intelligence that form the core of my visual analysis app:
ReGraph for graph visualization, and
KronoGraph for timeline visualization.
Loading Wikipedia Data into Neo4j
To start, I wrote a small NodeJS module to speak to the MediaWiki API. The API returns JSON summaries of the
edits made against Wikipedia pages. Here’s an example URL that’s been parameterized to return edits made to the Neo4j Wikipedia page:
https://en.wikipedia.org/w/api.php?action=query&prop=revisions&titles=Neo4j&rvprop=ids|timestamp|user|userid|comment|tags|oresscores&rvlimit=500&rvdir=newer&format=json&rvstart=2020-01-01T00:00:00Z
Next, I used the exhaustive
APOC library from Neo4j to iteratively query all edits made to Wikipedia pages over time. The Neo4j BOLT JavaScript driver combines the flexibility of NodeJS scripting and APOC + Cypher querying:
const getRevisionsCypher = ({ url, title, category }) => `
  WITH "${url}" AS url
  CALL apoc.load.json(url,'$.query.pages.*') YIELD value
  UNWIND value.revisions AS rev
  MERGE (page:Page {id: "${title}"}) ON CREATE
    SET page.title = "${title}"
    SET page.category = "${category}"
  MERGE (author:Author {id:rev.userid}) ON CREATE
    SET author.username = rev.user
  MERGE (revision:Revision {id:rev.revid, comment: COALESCE(rev.comment, ''), timestamp: datetime(rev.timestamp)})
    SET revision.size = rev.size
  MERGE (page)-[:REVISION]-(revision)-[:BY]->(author)
`;
This means I can wrap calls to the above function with the URL which includes the parameters for the pages I want to query. There’s also a continue parameter so I can keep track of the edits I’ve downloaded so far and work with the paginated results from MediaWiki.
Connecting the Front and Back Ends
The Apollo GraphQL data platform provides the communication layer that connects my front-end React apps to Neo4j.
Apollo’s excellent developer libraries help us get the most out of our GraphQL schema.
Apollo-boost gets ReGraph and KronoGraph talking to my GraphQL server.
import ApolloClient from 'apollo-boost';
import { ApolloProvider} from '@apollo/react-hooks';

const client = new ApolloClient({ uri: URL });

ReactDOM.render(
 <ApolloProvider client={client}>
   <App />
 </ApolloProvider>,
 document.getElementById('root')
);
Here I’m wrapping my App component in an ApolloProvider. This means I can rely on the useQuery hook to query my instance.
import { useQuery } from '@apollo/react-hooks';
import { gql } from 'apollo-boost';

const fullQuery = gql`
 query($title: String, $y1: Int, $m1: Int, $d1: Int, $y2: Int, $m2: Int, $d2: Int) {
   Page(first: 10, title: $title) {
     id
     title
     __typename
     revision(
       filter: {
         AND: [
           { timestamp_gte: { year: $y1, month: $m1, day: $d1 } }
           { timestamp_lte: { year: $y2, month: $m2, day: $d2 } }
         ]
       }
     ) {
       id
       __typename
       text: comment
       size
       timestamp {
         formatted
       }
       by(
         first: 10
         filter: {
           AND: [
             { username_not_contains: "BOT" }
             { username_not_contains: "Bot" }
             { username_not_contains: "bot" }
           ]
         }
       ) {
         id: username
         name: username
         __typename
       }
     }
   }
 }
`;

const { data, error, loading } = useQuery(QUERY, {
  variables: { title: term, ...gqlRange },
});
Visualizing Wikipedia Data with ReGraph and KronoGraph
Now I’m ready to bring my data to life through visualization. ReGraph, Cambridge Intelligence’s graph visualization tool for React developers, integrates seamlessly with GRANDstack. So does KronoGraph, our timeline visualization tool for exploring time-based data in a new way.
With a simple transformation step, I can translate the JSON returned by the GraphQL server into the format ReGraph and KronoGraph expect. The transformation also includes a call to the MediaWiki API to get the URL of a page thumbnail, making the pages represented in our network instantly recognizable.
ReGraph and KronoGraph both have robust event engines which make it easy to synchronize interactions between the two libraries. There are many ways to configure interactive visual analytics applications. We can share functions between the two libraries to use the flexibility without duplicating code.
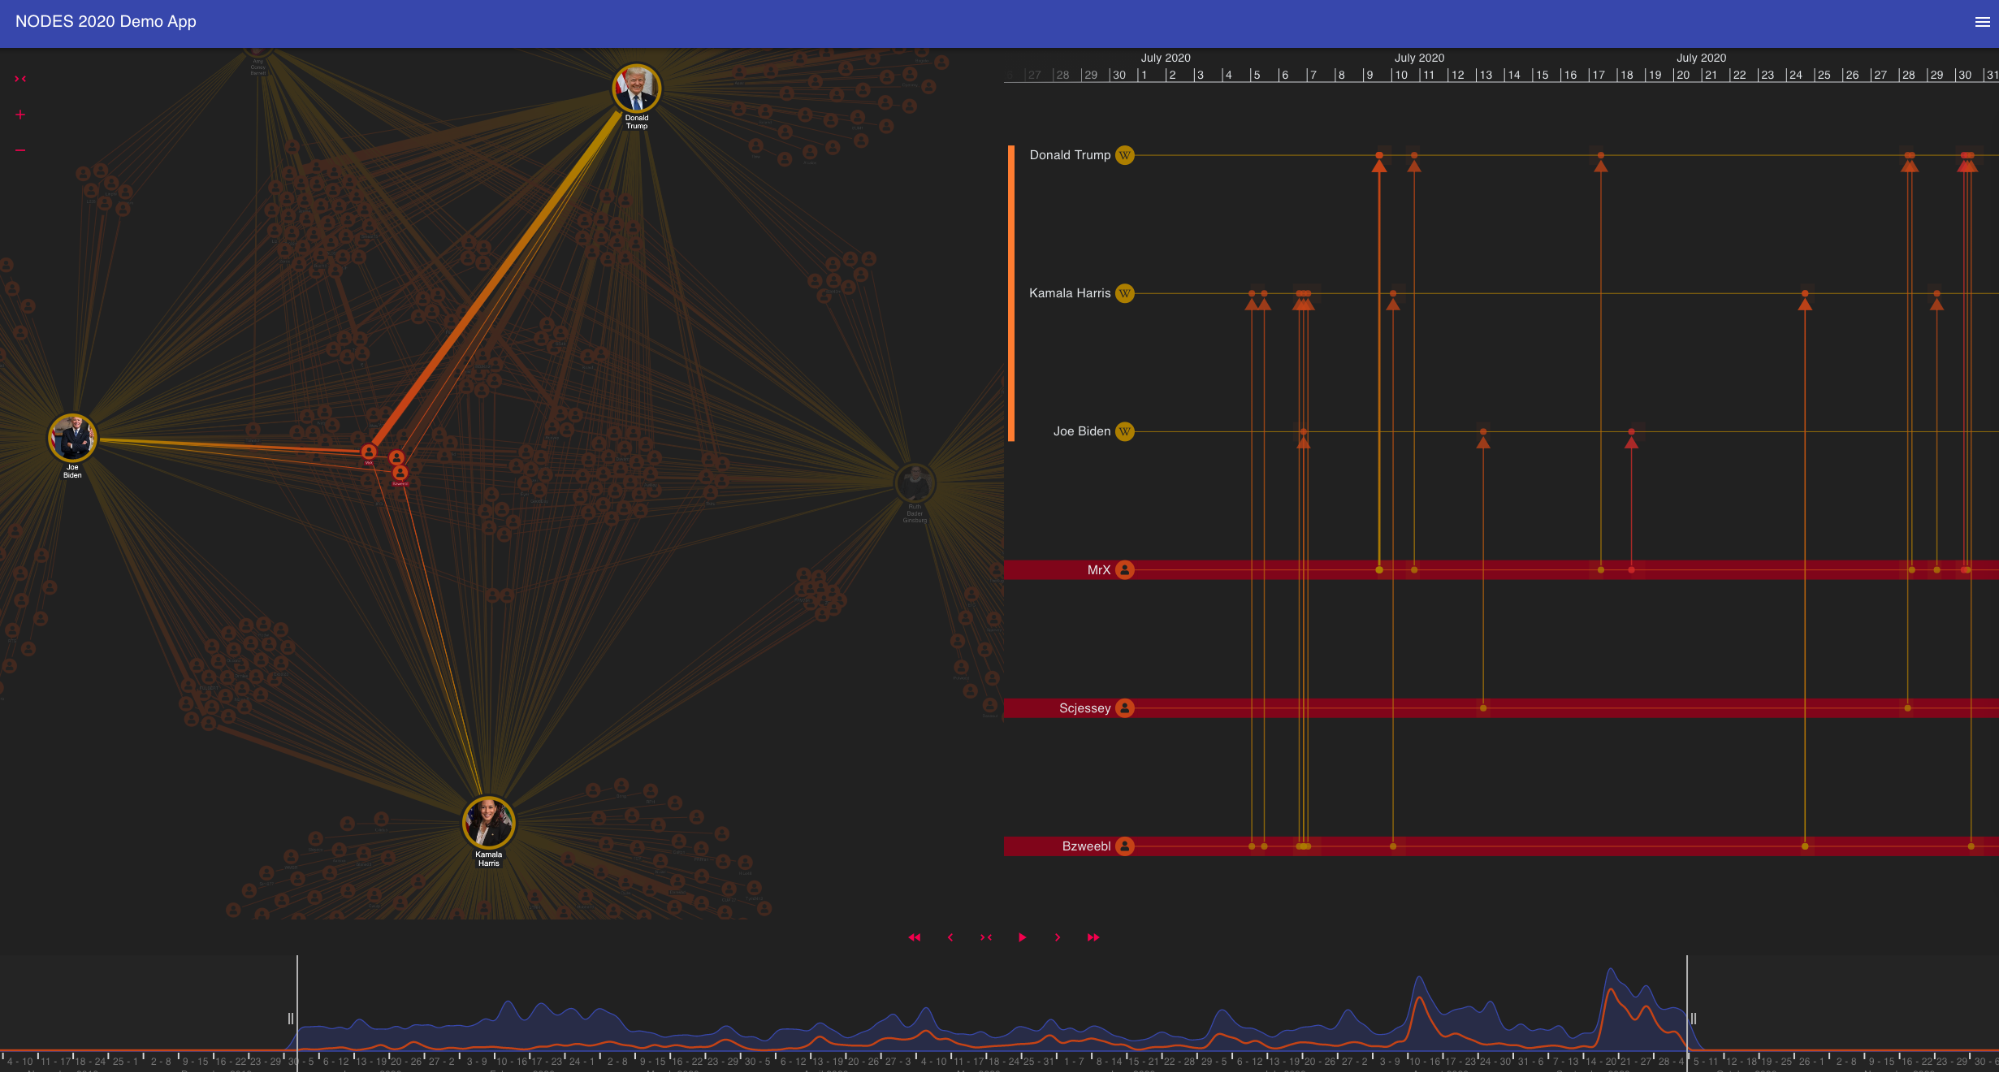
Here’s my app, complete with a dark-themed interface I created using React’s Material-UI framework.
Wikipedia data stored in a Neo4j graph database and visualized using ReGraph and KronoGraph visualization tools.
On the left we have a fascinating real-world network of connections between editors and Wikipedia pages. To help me detect potential fraud, I want to know when each event took place, so my app features two fully-interactive time-based components: the
ReGraph time bar at the bottom of the screen, and
KronoGraph timelines to the right of the network.
A Revolution in Time-Based Data Visualization
The time bar provides a summary of the entire extracted dataset of page edits. I can move sliders around to filter and summarize the data I see on screen.
ReGraph’s time bar makes it easy to spot peaks of activity.
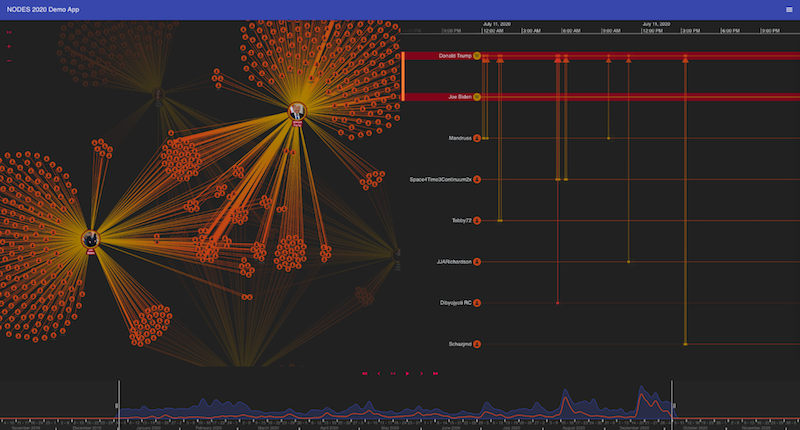
KronoGraph timelines show how events unfold and makes it easy to recognize patterns and outliers quickly. It’s a standalone toolkit, but integrating with ReGraph means I can explore the same data in complementary ways: using the network view to identify entities worth investigating, or using the timeline to find events that are hard to spot in the network.
Selecting editors in the timeline reveals their connections in the network.
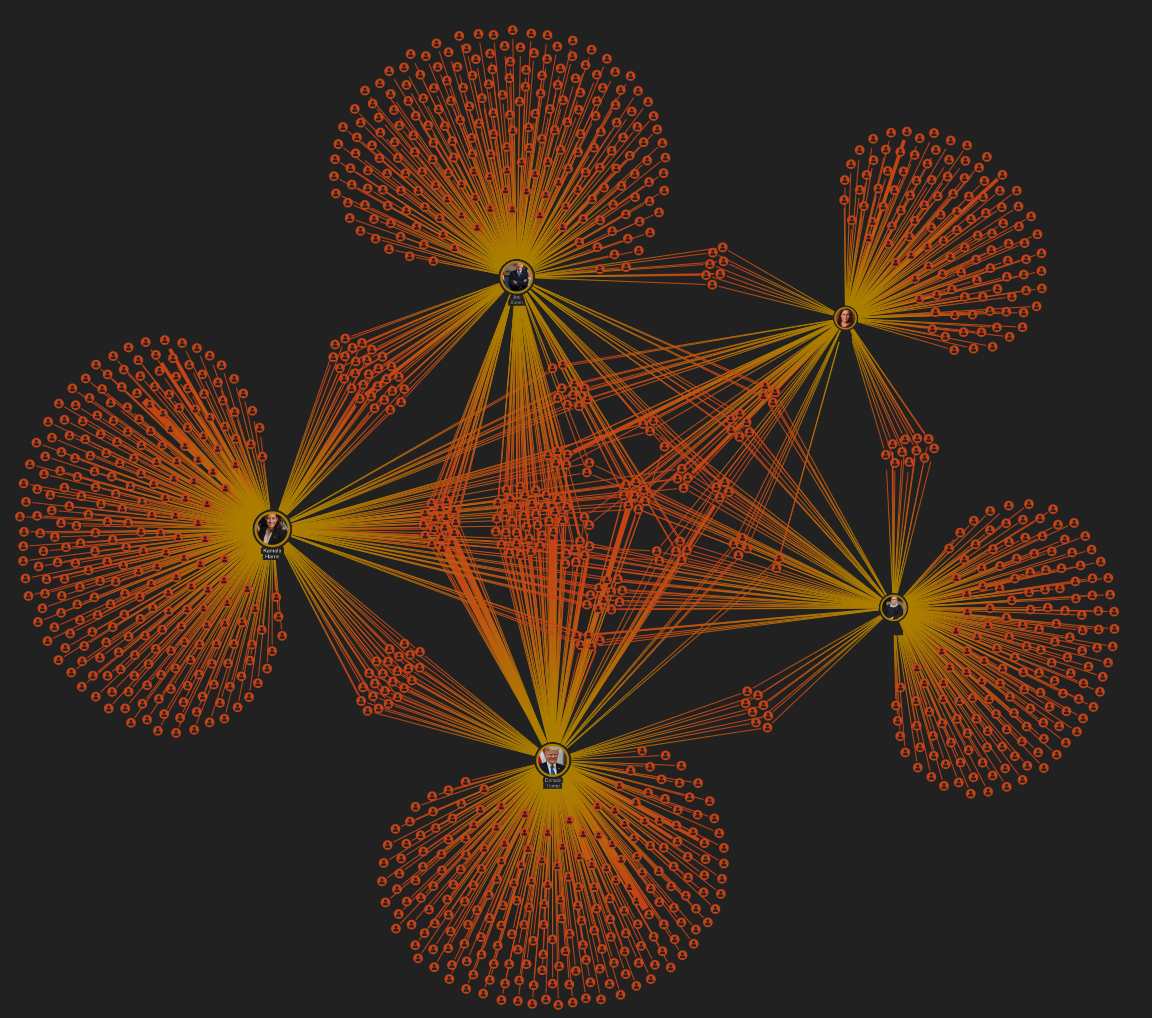
In my application, I synchronized the search box with the useQuery React hook to make it easy to bring in further entities. These come to life in both the graph and the timeline and it’s simple to spot the commonality between certain page editors.
Visualizing editing patterns: from those on the periphery who work solely on one Wikipedia page, to those in the center contributing to multiple articles.
When I bring in thousands of events from the Neo4j database to the timeline, the app recognizes that there’s too much for a detailed view and instead presents a heatmap. This aggregated version of the data gives me the high-level summary I need. I can even use markers to add context or key information.
The heatmap view makes it easy to spot periods of intense activity.
Driving Fraud Investigations with Time-Based Visualizations
For developers looking for a way to build and prototype data visualization apps fast, GRANDstack’s rich ecosystem of tools is the standout choice. Integrate a powerful Neo4j graph database with
our toolkit technology, and you’ll have a time-based visualization app for smarter fraud investigation.